This pipeline computes the correlation between significant copy number variation (cnv focal) genes and molecular subtypes.
Testing the association between copy number variation 23 focal events and 7 molecular subtypes across 36 patients, 3 significant findings detected with P value < 0.05 and Q value < 0.25.
-
del_14q32.12 cnv correlated to 'CN_CNMF'.
-
del_14q32.11 cnv correlated to 'CN_CNMF'.
-
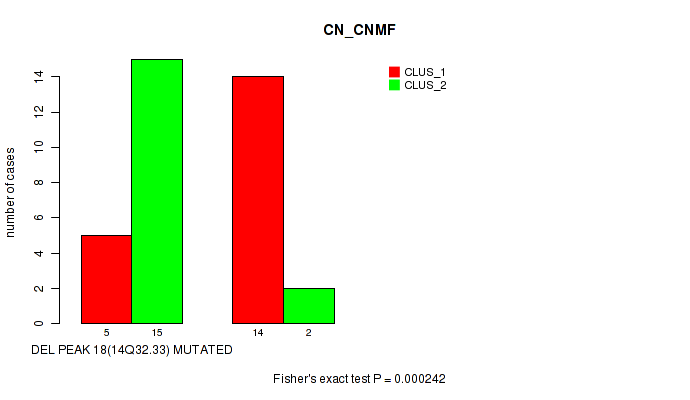
del_14q32.33 cnv correlated to 'CN_CNMF'.
Table 1. Get Full Table Overview of the association between significant copy number variation of 23 focal events and 7 molecular subtypes. Shown in the table are P values (Q values). Thresholded by P value < 0.05 and Q value < 0.25, 3 significant findings detected.
|
Clinical Features |
CN CNMF |
MRNASEQ CNMF |
MRNASEQ CHIERARCHICAL |
MIRSEQ CNMF |
MIRSEQ CHIERARCHICAL |
MIRSEQ MATURE CNMF |
MIRSEQ MATURE CHIERARCHICAL |
||
| nCNV (%) | nWild-Type | Fisher's exact test | Fisher's exact test | Fisher's exact test | Fisher's exact test | Fisher's exact test | Fisher's exact test | Fisher's exact test | |
| del 14q32 12 | 20 (56%) | 16 |
0.000242 (0.0389) |
0.912 (1.00) |
0.0594 (1.00) |
0.967 (1.00) |
0.757 (1.00) |
0.175 (1.00) |
0.37 (1.00) |
| del 14q32 11 | 20 (56%) | 16 |
0.000242 (0.0389) |
0.913 (1.00) |
0.0579 (1.00) |
0.966 (1.00) |
0.754 (1.00) |
0.175 (1.00) |
0.373 (1.00) |
| del 14q32 33 | 20 (56%) | 16 |
0.000242 (0.0389) |
0.913 (1.00) |
0.0581 (1.00) |
0.967 (1.00) |
0.757 (1.00) |
0.175 (1.00) |
0.368 (1.00) |
| amp 1p22 3 | 15 (42%) | 21 |
0.736 (1.00) |
0.201 (1.00) |
0.0714 (1.00) |
0.167 (1.00) |
0.198 (1.00) |
0.736 (1.00) |
0.427 (1.00) |
| amp 1q22 | 24 (67%) | 12 |
0.302 (1.00) |
0.119 (1.00) |
0.353 (1.00) |
0.926 (1.00) |
0.405 (1.00) |
1 (1.00) |
0.682 (1.00) |
| amp 11q13 3 | 8 (22%) | 28 |
1 (1.00) |
0.599 (1.00) |
0.044 (1.00) |
0.298 (1.00) |
0.971 (1.00) |
0.694 (1.00) |
0.853 (1.00) |
| amp 12q13 2 | 10 (28%) | 26 |
1 (1.00) |
0.806 (1.00) |
0.908 (1.00) |
0.262 (1.00) |
0.52 (1.00) |
0.26 (1.00) |
0.63 (1.00) |
| del 1p36 21 | 30 (83%) | 6 |
0.0203 (1.00) |
0.0193 (1.00) |
0.00814 (1.00) |
0.392 (1.00) |
0.128 (1.00) |
0.677 (1.00) |
0.152 (1.00) |
| del 3p25 3 | 28 (78%) | 8 |
0.0438 (1.00) |
0.776 (1.00) |
0.0699 (1.00) |
0.418 (1.00) |
0.761 (1.00) |
0.424 (1.00) |
0.853 (1.00) |
| del 3p13 | 28 (78%) | 8 |
0.0438 (1.00) |
1 (1.00) |
0.288 (1.00) |
0.54 (1.00) |
0.242 (1.00) |
0.694 (1.00) |
0.992 (1.00) |
| del 4q34 3 | 23 (64%) | 13 |
0.502 (1.00) |
0.192 (1.00) |
0.329 (1.00) |
0.194 (1.00) |
0.484 (1.00) |
1 (1.00) |
0.535 (1.00) |
| del 5q13 3 | 8 (22%) | 28 |
0.236 (1.00) |
0.0273 (1.00) |
0.158 (1.00) |
0.856 (1.00) |
0.668 (1.00) |
0.694 (1.00) |
0.569 (1.00) |
| del 6q13 | 21 (58%) | 15 |
0.00801 (1.00) |
0.274 (1.00) |
0.251 (1.00) |
0.754 (1.00) |
0.344 (1.00) |
0.176 (1.00) |
0.471 (1.00) |
| del 6q25 3 | 25 (69%) | 11 |
0.00338 (0.533) |
0.0551 (1.00) |
0.0614 (1.00) |
0.14 (1.00) |
0.183 (1.00) |
0.0769 (1.00) |
0.0361 (1.00) |
| del 8p23 1 | 13 (36%) | 23 |
0.502 (1.00) |
0.0759 (1.00) |
0.0669 (1.00) |
0.612 (1.00) |
0.317 (1.00) |
0.31 (1.00) |
0.242 (1.00) |
| del 9p21 3 | 23 (64%) | 13 |
0.502 (1.00) |
0.681 (1.00) |
0.16 (1.00) |
0.173 (1.00) |
0.621 (1.00) |
0.159 (1.00) |
0.734 (1.00) |
| del 9q21 11 | 19 (53%) | 17 |
0.525 (1.00) |
0.696 (1.00) |
0.186 (1.00) |
0.32 (1.00) |
0.429 (1.00) |
0.516 (1.00) |
0.518 (1.00) |
| del 10q26 12 | 12 (33%) | 24 |
0.732 (1.00) |
0.44 (1.00) |
0.681 (1.00) |
0.471 (1.00) |
0.212 (1.00) |
0.499 (1.00) |
0.225 (1.00) |
| del 11q25 | 13 (36%) | 23 |
0.299 (1.00) |
0.209 (1.00) |
0.639 (1.00) |
0.817 (1.00) |
0.216 (1.00) |
0.484 (1.00) |
0.17 (1.00) |
| del 12q24 13 | 8 (22%) | 28 |
0.434 (1.00) |
0.47 (1.00) |
0.615 (1.00) |
0.541 (1.00) |
0.667 (1.00) |
0.424 (1.00) |
0.85 (1.00) |
| del 13q21 32 | 16 (44%) | 20 |
1 (1.00) |
0.832 (1.00) |
0.875 (1.00) |
0.619 (1.00) |
0.488 (1.00) |
1 (1.00) |
0.288 (1.00) |
| del 14q22 1 | 14 (39%) | 22 |
0.0388 (1.00) |
1 (1.00) |
0.117 (1.00) |
0.964 (1.00) |
0.972 (1.00) |
0.732 (1.00) |
0.411 (1.00) |
| del 16q23 1 | 7 (19%) | 29 |
0.684 (1.00) |
0.663 (1.00) |
0.413 (1.00) |
0.66 (1.00) |
0.0187 (1.00) |
1 (1.00) |
0.665 (1.00) |
P value = 0.000242 (Fisher's exact test), Q value = 0.039
Table S1. Gene #20: 'del_14q32.12' versus Molecular Subtype #1: 'CN_CNMF'
| nPatients | CLUS_1 | CLUS_2 |
|---|---|---|
| ALL | 19 | 17 |
| DEL PEAK 16(14Q32.12) MUTATED | 5 | 15 |
| DEL PEAK 16(14Q32.12) WILD-TYPE | 14 | 2 |
Figure S1. Get High-res Image Gene #20: 'del_14q32.12' versus Molecular Subtype #1: 'CN_CNMF'

P value = 0.000242 (Fisher's exact test), Q value = 0.039
Table S2. Gene #21: 'del_14q32.11' versus Molecular Subtype #1: 'CN_CNMF'
| nPatients | CLUS_1 | CLUS_2 |
|---|---|---|
| ALL | 19 | 17 |
| DEL PEAK 17(14Q32.11) MUTATED | 5 | 15 |
| DEL PEAK 17(14Q32.11) WILD-TYPE | 14 | 2 |
Figure S2. Get High-res Image Gene #21: 'del_14q32.11' versus Molecular Subtype #1: 'CN_CNMF'

P value = 0.000242 (Fisher's exact test), Q value = 0.039
Table S3. Gene #22: 'del_14q32.33' versus Molecular Subtype #1: 'CN_CNMF'
| nPatients | CLUS_1 | CLUS_2 |
|---|---|---|
| ALL | 19 | 17 |
| DEL PEAK 18(14Q32.33) MUTATED | 5 | 15 |
| DEL PEAK 18(14Q32.33) WILD-TYPE | 14 | 2 |
Figure S3. Get High-res Image Gene #22: 'del_14q32.33' versus Molecular Subtype #1: 'CN_CNMF'
-
Copy number data file = transformed.cor.cli.txt
-
Molecular subtype file = CHOL-TP.transferedmergedcluster.txt
-
Number of patients = 36
-
Number of significantly focal cnvs = 23
-
Number of molecular subtypes = 7
-
Exclude genes that fewer than K tumors have alterations, K = 3
For binary or multi-class clinical features (nominal or ordinal), two-tailed Fisher's exact tests (Fisher 1922) were used to estimate the P values using the 'fisher.test' function in R
For multiple hypothesis correction, Q value is the False Discovery Rate (FDR) analogue of the P value (Benjamini and Hochberg 1995), defined as the minimum FDR at which the test may be called significant. We used the 'Benjamini and Hochberg' method of 'p.adjust' function in R to convert P values into Q values.
In addition to the links below, the full results of the analysis summarized in this report can also be downloaded programmatically using firehose_get, or interactively from either the Broad GDAC website or TCGA Data Coordination Center Portal.