This pipeline computes the correlation between significantly recurrent gene mutations and selected clinical features.
Testing the association between mutation status of 46 genes and 11 clinical features across 223 patients, 4 significant findings detected with Q value < 0.25.
-
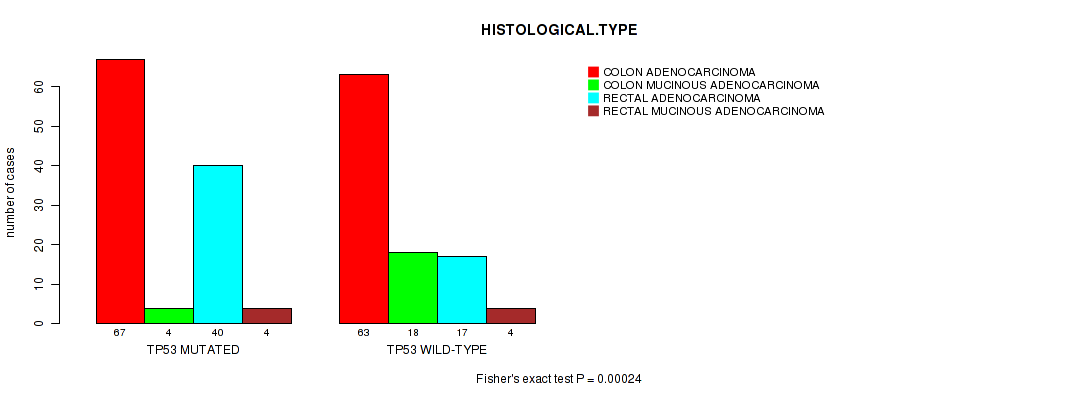
TP53 mutation correlated to 'HISTOLOGICAL.TYPE'.
-
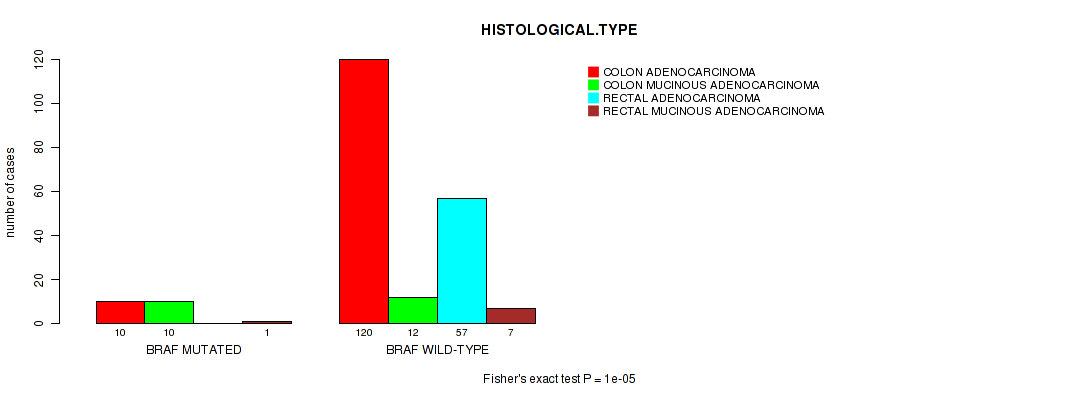
BRAF mutation correlated to 'HISTOLOGICAL.TYPE'.
-
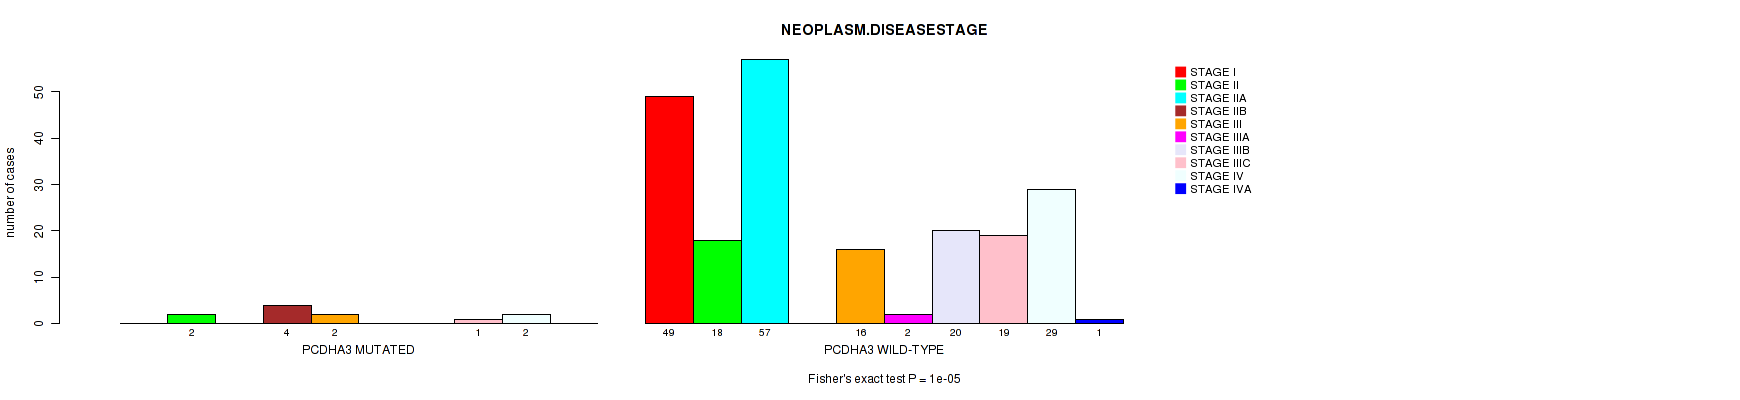
PCDHA3 mutation correlated to 'NEOPLASM.DISEASESTAGE'.
-
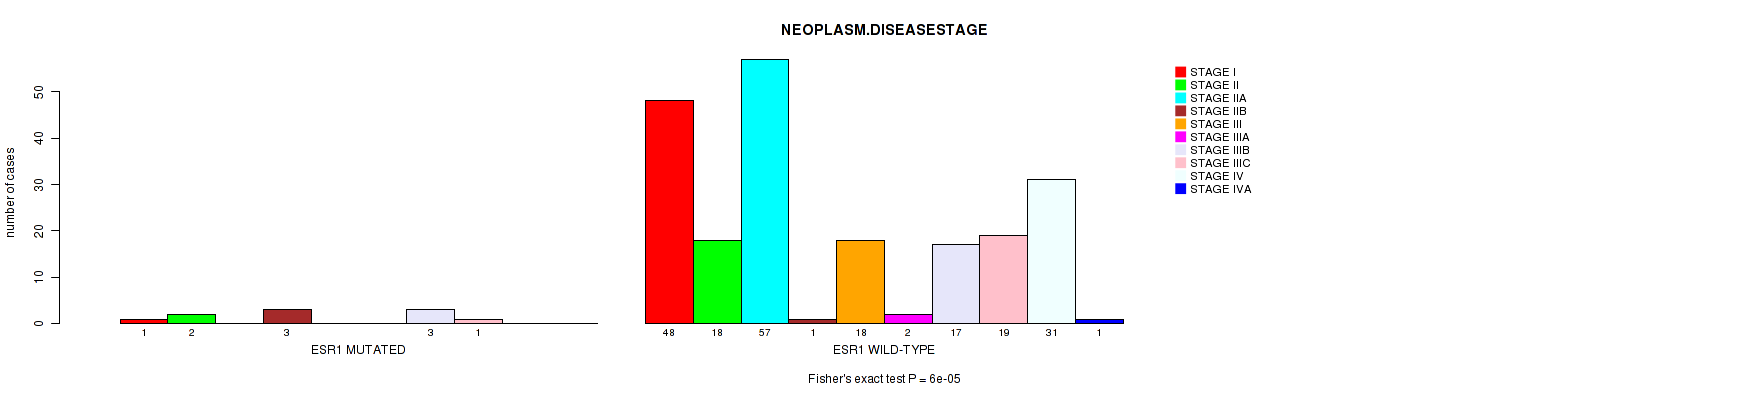
ESR1 mutation correlated to 'NEOPLASM.DISEASESTAGE'.
Table 1. Get Full Table Overview of the association between mutation status of 46 genes and 11 clinical features. Shown in the table are P values (Q values). Thresholded by Q value < 0.25, 4 significant findings detected.
|
Clinical Features |
Time to Death |
AGE |
PRIMARY SITE OF DISEASE |
NEOPLASM DISEASESTAGE |
PATHOLOGY T STAGE |
PATHOLOGY N STAGE |
PATHOLOGY M STAGE |
GENDER |
HISTOLOGICAL TYPE |
COMPLETENESS OF RESECTION |
NUMBER OF LYMPH NODES |
||
| nMutated (%) | nWild-Type | logrank test | Wilcoxon-test | Fisher's exact test | Fisher's exact test | Fisher's exact test | Fisher's exact test | Fisher's exact test | Fisher's exact test | Fisher's exact test | Fisher's exact test | Wilcoxon-test | |
| TP53 | 117 (52%) | 106 |
0.361 (1.00) |
0.0701 (1.00) |
0.0194 (1.00) |
0.605 (1.00) |
0.963 (1.00) |
0.45 (1.00) |
0.92 (1.00) |
0.423 (1.00) |
0.00024 (0.121) |
0.583 (1.00) |
0.157 (1.00) |
| BRAF | 21 (9%) | 202 |
0.205 (1.00) |
0.00407 (1.00) |
0.00524 (1.00) |
0.131 (1.00) |
0.057 (1.00) |
0.903 (1.00) |
0.386 (1.00) |
0.0369 (1.00) |
1e-05 (0.00506) |
0.605 (1.00) |
0.888 (1.00) |
| PCDHA3 | 12 (5%) | 211 |
0.0622 (1.00) |
0.426 (1.00) |
0.352 (1.00) |
1e-05 (0.00506) |
0.0409 (1.00) |
0.376 (1.00) |
0.673 (1.00) |
0.558 (1.00) |
0.717 (1.00) |
0.0929 (1.00) |
0.81 (1.00) |
| ESR1 | 11 (5%) | 212 |
0.681 (1.00) |
0.796 (1.00) |
0.0197 (1.00) |
6e-05 (0.0302) |
0.0236 (1.00) |
0.568 (1.00) |
0.39 (1.00) |
1 (1.00) |
0.0513 (1.00) |
0.652 (1.00) |
0.671 (1.00) |
| APC | 163 (73%) | 60 |
0.256 (1.00) |
0.113 (1.00) |
0.101 (1.00) |
0.849 (1.00) |
0.932 (1.00) |
0.776 (1.00) |
0.757 (1.00) |
0.0346 (1.00) |
0.342 (1.00) |
0.522 (1.00) |
0.556 (1.00) |
| KRAS | 97 (43%) | 126 |
0.241 (1.00) |
0.139 (1.00) |
0.0392 (1.00) |
0.71 (1.00) |
0.305 (1.00) |
0.252 (1.00) |
0.169 (1.00) |
0.687 (1.00) |
0.102 (1.00) |
0.0319 (1.00) |
0.149 (1.00) |
| NRAS | 20 (9%) | 203 |
0.983 (1.00) |
0.0543 (1.00) |
0.623 (1.00) |
0.271 (1.00) |
0.293 (1.00) |
0.0374 (1.00) |
0.546 (1.00) |
0.0357 (1.00) |
1 (1.00) |
0.471 (1.00) |
0.879 (1.00) |
| SMAD4 | 26 (12%) | 197 |
0.516 (1.00) |
0.837 (1.00) |
1 (1.00) |
0.911 (1.00) |
0.877 (1.00) |
1 (1.00) |
0.795 (1.00) |
0.838 (1.00) |
0.012 (1.00) |
0.832 (1.00) |
0.811 (1.00) |
| FBXW7 | 38 (17%) | 185 |
0.475 (1.00) |
0.0177 (1.00) |
0.34 (1.00) |
0.0101 (1.00) |
0.119 (1.00) |
0.775 (1.00) |
0.00429 (1.00) |
0.374 (1.00) |
0.0281 (1.00) |
0.0346 (1.00) |
0.888 (1.00) |
| SMAD2 | 15 (7%) | 208 |
0.962 (1.00) |
0.775 (1.00) |
0.78 (1.00) |
0.00955 (1.00) |
0.368 (1.00) |
0.271 (1.00) |
1 (1.00) |
0.291 (1.00) |
0.379 (1.00) |
0.749 (1.00) |
0.0892 (1.00) |
| FAM123B | 24 (11%) | 199 |
0.0384 (1.00) |
0.49 (1.00) |
0.351 (1.00) |
0.696 (1.00) |
0.77 (1.00) |
0.336 (1.00) |
0.59 (1.00) |
1 (1.00) |
0.747 (1.00) |
0.634 (1.00) |
0.905 (1.00) |
| PIK3CA | 33 (15%) | 190 |
0.736 (1.00) |
0.147 (1.00) |
0.226 (1.00) |
0.0422 (1.00) |
0.916 (1.00) |
0.0217 (1.00) |
0.132 (1.00) |
0.851 (1.00) |
0.0258 (1.00) |
0.305 (1.00) |
0.00377 (1.00) |
| TCF7L2 | 18 (8%) | 205 |
0.319 (1.00) |
0.253 (1.00) |
0.785 (1.00) |
0.676 (1.00) |
0.336 (1.00) |
0.943 (1.00) |
0.736 (1.00) |
0.624 (1.00) |
0.495 (1.00) |
0.578 (1.00) |
0.757 (1.00) |
| ARID1A | 20 (9%) | 203 |
0.877 (1.00) |
0.267 (1.00) |
0.623 (1.00) |
0.00844 (1.00) |
0.139 (1.00) |
0.0176 (1.00) |
0.383 (1.00) |
0.349 (1.00) |
0.478 (1.00) |
0.602 (1.00) |
0.0405 (1.00) |
| MGC42105 | 11 (5%) | 212 |
0.55 (1.00) |
0.701 (1.00) |
0.179 (1.00) |
0.175 (1.00) |
0.305 (1.00) |
0.461 (1.00) |
0.392 (1.00) |
0.761 (1.00) |
0.414 (1.00) |
1 (1.00) |
0.146 (1.00) |
| ACVR1B | 14 (6%) | 209 |
0.57 (1.00) |
0.799 (1.00) |
0.0692 (1.00) |
0.127 (1.00) |
0.0403 (1.00) |
1 (1.00) |
0.717 (1.00) |
1 (1.00) |
0.0214 (1.00) |
1 (1.00) |
0.903 (1.00) |
| CDC27 | 13 (6%) | 210 |
0.223 (1.00) |
0.687 (1.00) |
0.759 (1.00) |
0.476 (1.00) |
0.721 (1.00) |
0.53 (1.00) |
0.718 (1.00) |
0.154 (1.00) |
0.563 (1.00) |
1 (1.00) |
0.23 (1.00) |
| KIAA1804 | 15 (7%) | 208 |
0.344 (1.00) |
0.921 (1.00) |
0.0181 (1.00) |
0.71 (1.00) |
0.732 (1.00) |
0.345 (1.00) |
1 (1.00) |
0.425 (1.00) |
0.0226 (1.00) |
0.747 (1.00) |
0.405 (1.00) |
| PCDHGB1 | 8 (4%) | 215 |
0.294 (1.00) |
0.357 (1.00) |
0.44 (1.00) |
0.0197 (1.00) |
0.149 (1.00) |
0.892 (1.00) |
0.614 (1.00) |
0.485 (1.00) |
0.463 (1.00) |
0.639 (1.00) |
0.897 (1.00) |
| PCBP1 | 5 (2%) | 218 |
0.397 (1.00) |
0.0546 (1.00) |
1 (1.00) |
0.0806 (1.00) |
0.526 (1.00) |
0.694 (1.00) |
0.0246 (1.00) |
1 (1.00) |
1 (1.00) |
1 (1.00) |
0.348 (1.00) |
| ZHX2 | 10 (4%) | 213 |
0.217 (1.00) |
0.223 (1.00) |
0.727 (1.00) |
0.152 (1.00) |
0.128 (1.00) |
0.182 (1.00) |
1 (1.00) |
1 (1.00) |
0.794 (1.00) |
1 (1.00) |
0.314 (1.00) |
| PCDHA2 | 12 (5%) | 211 |
0.614 (1.00) |
0.905 (1.00) |
1 (1.00) |
0.153 (1.00) |
0.0605 (1.00) |
0.374 (1.00) |
0.266 (1.00) |
0.239 (1.00) |
0.22 (1.00) |
1 (1.00) |
0.851 (1.00) |
| ELF3 | 8 (4%) | 215 |
0.812 (1.00) |
0.0634 (1.00) |
0.704 (1.00) |
0.892 (1.00) |
0.26 (1.00) |
0.786 (1.00) |
0.34 (1.00) |
0.723 (1.00) |
1 (1.00) |
0.343 (1.00) |
0.472 (1.00) |
| CRTC1 | 4 (2%) | 219 |
0.361 (1.00) |
0.0255 (1.00) |
1 (1.00) |
0.735 (1.00) |
0.193 (1.00) |
0.644 (1.00) |
1 (1.00) |
1 (1.00) |
1 (1.00) |
1 (1.00) |
0.438 (1.00) |
| CASP8 | 10 (4%) | 213 |
0.806 (1.00) |
0.0404 (1.00) |
0.0336 (1.00) |
0.177 (1.00) |
0.104 (1.00) |
0.141 (1.00) |
0.393 (1.00) |
1 (1.00) |
0.0494 (1.00) |
0.67 (1.00) |
0.0437 (1.00) |
| CACNG3 | 8 (4%) | 215 |
0.974 (1.00) |
0.0481 (1.00) |
0.704 (1.00) |
0.396 (1.00) |
0.346 (1.00) |
0.786 (1.00) |
0.62 (1.00) |
0.485 (1.00) |
0.668 (1.00) |
0.641 (1.00) |
0.543 (1.00) |
| PCDHGA7 | 5 (2%) | 218 |
0.825 (1.00) |
0.514 (1.00) |
0.327 (1.00) |
0.128 (1.00) |
0.525 (1.00) |
0.3 (1.00) |
1 (1.00) |
0.673 (1.00) |
0.116 (1.00) |
1 (1.00) |
0.723 (1.00) |
| CCBP2 | 10 (4%) | 213 |
0.205 (1.00) |
0.812 (1.00) |
0.29 (1.00) |
0.783 (1.00) |
0.228 (1.00) |
0.236 (1.00) |
1 (1.00) |
0.526 (1.00) |
0.25 (1.00) |
1 (1.00) |
0.129 (1.00) |
| MAP2K4 | 11 (5%) | 212 |
0.409 (1.00) |
0.049 (1.00) |
0.51 (1.00) |
0.0452 (1.00) |
0.386 (1.00) |
0.694 (1.00) |
0.403 (1.00) |
0.761 (1.00) |
0.685 (1.00) |
0.67 (1.00) |
0.402 (1.00) |
| PCDHGA9 | 6 (3%) | 217 |
0.728 (1.00) |
0.224 (1.00) |
0.669 (1.00) |
0.213 (1.00) |
0.323 (1.00) |
1 (1.00) |
0.607 (1.00) |
0.43 (1.00) |
0.745 (1.00) |
0.107 (1.00) |
0.827 (1.00) |
| RBM10 | 8 (4%) | 215 |
0.0164 (1.00) |
0.498 (1.00) |
0.254 (1.00) |
0.0239 (1.00) |
0.15 (1.00) |
0.0432 (1.00) |
0.0107 (1.00) |
0.157 (1.00) |
0.282 (1.00) |
1 (1.00) |
0.00968 (1.00) |
| PTEN | 7 (3%) | 216 |
0.821 (1.00) |
0.00791 (1.00) |
0.679 (1.00) |
0.166 (1.00) |
0.175 (1.00) |
1 (1.00) |
1 (1.00) |
0.713 (1.00) |
0.224 (1.00) |
0.597 (1.00) |
0.51 (1.00) |
| DNMT1 | 17 (8%) | 206 |
0.754 (1.00) |
0.804 (1.00) |
1 (1.00) |
0.336 (1.00) |
0.0876 (1.00) |
0.435 (1.00) |
1 (1.00) |
0.207 (1.00) |
0.0643 (1.00) |
0.388 (1.00) |
0.172 (1.00) |
| BCOR | 9 (4%) | 214 |
0.132 (1.00) |
0.399 (1.00) |
1 (1.00) |
0.0641 (1.00) |
0.0263 (1.00) |
0.803 (1.00) |
0.634 (1.00) |
0.318 (1.00) |
0.419 (1.00) |
0.398 (1.00) |
0.858 (1.00) |
| PCDHGB5 | 7 (3%) | 216 |
0.0774 (1.00) |
0.807 (1.00) |
0.442 (1.00) |
0.00488 (1.00) |
0.0155 (1.00) |
0.119 (1.00) |
1 (1.00) |
0.448 (1.00) |
0.48 (1.00) |
0.0566 (1.00) |
0.0357 (1.00) |
| ZFP3 | 8 (4%) | 215 |
0.216 (1.00) |
0.48 (1.00) |
1 (1.00) |
0.224 (1.00) |
0.256 (1.00) |
0.421 (1.00) |
0.61 (1.00) |
0.485 (1.00) |
1 (1.00) |
0.634 (1.00) |
0.224 (1.00) |
| RWDD2B | 7 (3%) | 216 |
0.895 (1.00) |
0.18 (1.00) |
1 (1.00) |
0.351 (1.00) |
0.174 (1.00) |
0.117 (1.00) |
0.607 (1.00) |
0.713 (1.00) |
1 (1.00) |
1 (1.00) |
0.0357 (1.00) |
| TBC1D10C | 3 (1%) | 220 |
0.548 (1.00) |
0.375 (1.00) |
0.554 (1.00) |
0.281 (1.00) |
0.701 (1.00) |
0.133 (1.00) |
1 (1.00) |
0.609 (1.00) |
0.0758 (1.00) |
1 (1.00) |
0.54 (1.00) |
| ERCC6L | 5 (2%) | 218 |
0.722 (1.00) |
0.0726 (1.00) |
1 (1.00) |
0.424 (1.00) |
0.199 (1.00) |
0.387 (1.00) |
1 (1.00) |
0.0242 (1.00) |
0.682 (1.00) |
1 (1.00) |
0.489 (1.00) |
| ERBB3 | 14 (6%) | 209 |
0.512 (1.00) |
0.519 (1.00) |
0.558 (1.00) |
0.0319 (1.00) |
0.746 (1.00) |
0.86 (1.00) |
0.717 (1.00) |
1 (1.00) |
0.578 (1.00) |
1 (1.00) |
0.886 (1.00) |
| KLK2 | 3 (1%) | 220 |
0.451 (1.00) |
0.215 (1.00) |
0.554 (1.00) |
0.644 (1.00) |
1 (1.00) |
1 (1.00) |
1 (1.00) |
1 (1.00) |
0.377 (1.00) |
1 (1.00) |
0.838 (1.00) |
| TAPBP | 5 (2%) | 218 |
0.357 (1.00) |
0.286 (1.00) |
0.644 (1.00) |
0.29 (1.00) |
0.0174 (1.00) |
0.695 (1.00) |
1 (1.00) |
0.197 (1.00) |
0.562 (1.00) |
1 (1.00) |
0.294 (1.00) |
| ERBB2 | 9 (4%) | 214 |
0.478 (1.00) |
0.307 (1.00) |
0.462 (1.00) |
0.479 (1.00) |
0.345 (1.00) |
0.71 (1.00) |
1 (1.00) |
0.0367 (1.00) |
0.26 (1.00) |
1 (1.00) |
0.332 (1.00) |
| MORC2 | 5 (2%) | 218 |
0.416 (1.00) |
0.291 (1.00) |
0.644 (1.00) |
0.297 (1.00) |
0.158 (1.00) |
0.478 (1.00) |
1 (1.00) |
0.673 (1.00) |
0.831 (1.00) |
1 (1.00) |
0.914 (1.00) |
| ABCA8 | 12 (5%) | 211 |
0.725 (1.00) |
0.938 (1.00) |
1 (1.00) |
0.0466 (1.00) |
0.32 (1.00) |
0.101 (1.00) |
1 (1.00) |
0.558 (1.00) |
0.0252 (1.00) |
0.665 (1.00) |
0.315 (1.00) |
| SETD2 | 13 (6%) | 210 |
0.996 (1.00) |
0.975 (1.00) |
0.759 (1.00) |
0.555 (1.00) |
0.0951 (1.00) |
0.854 (1.00) |
0.717 (1.00) |
1 (1.00) |
0.894 (1.00) |
1 (1.00) |
0.436 (1.00) |
P value = 0.00024 (Fisher's exact test), Q value = 0.12
Table S1. Gene #2: 'TP53 MUTATION STATUS' versus Clinical Feature #9: 'HISTOLOGICAL.TYPE'
| nPatients | COLON ADENOCARCINOMA | COLON MUCINOUS ADENOCARCINOMA | RECTAL ADENOCARCINOMA | RECTAL MUCINOUS ADENOCARCINOMA |
|---|---|---|---|---|
| ALL | 130 | 22 | 57 | 8 |
| TP53 MUTATED | 67 | 4 | 40 | 4 |
| TP53 WILD-TYPE | 63 | 18 | 17 | 4 |
Figure S1. Get High-res Image Gene #2: 'TP53 MUTATION STATUS' versus Clinical Feature #9: 'HISTOLOGICAL.TYPE'
P value = 1e-05 (Fisher's exact test), Q value = 0.0051
Table S2. Gene #12: 'BRAF MUTATION STATUS' versus Clinical Feature #9: 'HISTOLOGICAL.TYPE'
| nPatients | COLON ADENOCARCINOMA | COLON MUCINOUS ADENOCARCINOMA | RECTAL ADENOCARCINOMA | RECTAL MUCINOUS ADENOCARCINOMA |
|---|---|---|---|---|
| ALL | 130 | 22 | 57 | 8 |
| BRAF MUTATED | 10 | 10 | 0 | 1 |
| BRAF WILD-TYPE | 120 | 12 | 57 | 7 |
Figure S2. Get High-res Image Gene #12: 'BRAF MUTATION STATUS' versus Clinical Feature #9: 'HISTOLOGICAL.TYPE'
P value = 1e-05 (Fisher's exact test), Q value = 0.0051
Table S3. Gene #20: 'PCDHA3 MUTATION STATUS' versus Clinical Feature #4: 'NEOPLASM.DISEASESTAGE'
| nPatients | STAGE I | STAGE II | STAGE IIA | STAGE IIB | STAGE III | STAGE IIIA | STAGE IIIB | STAGE IIIC | STAGE IV | STAGE IVA |
|---|---|---|---|---|---|---|---|---|---|---|
| ALL | 49 | 20 | 57 | 4 | 18 | 2 | 20 | 20 | 31 | 1 |
| PCDHA3 MUTATED | 0 | 2 | 0 | 4 | 2 | 0 | 0 | 1 | 2 | 0 |
| PCDHA3 WILD-TYPE | 49 | 18 | 57 | 0 | 16 | 2 | 20 | 19 | 29 | 1 |
Figure S3. Get High-res Image Gene #20: 'PCDHA3 MUTATION STATUS' versus Clinical Feature #4: 'NEOPLASM.DISEASESTAGE'
P value = 6e-05 (Fisher's exact test), Q value = 0.03
Table S4. Gene #46: 'ESR1 MUTATION STATUS' versus Clinical Feature #4: 'NEOPLASM.DISEASESTAGE'
| nPatients | STAGE I | STAGE II | STAGE IIA | STAGE IIB | STAGE III | STAGE IIIA | STAGE IIIB | STAGE IIIC | STAGE IV | STAGE IVA |
|---|---|---|---|---|---|---|---|---|---|---|
| ALL | 49 | 20 | 57 | 4 | 18 | 2 | 20 | 20 | 31 | 1 |
| ESR1 MUTATED | 1 | 2 | 0 | 3 | 0 | 0 | 3 | 1 | 0 | 0 |
| ESR1 WILD-TYPE | 48 | 18 | 57 | 1 | 18 | 2 | 17 | 19 | 31 | 1 |
Figure S4. Get High-res Image Gene #46: 'ESR1 MUTATION STATUS' versus Clinical Feature #4: 'NEOPLASM.DISEASESTAGE'
-
Mutation data file = transformed.cor.cli.txt
-
Clinical data file = COADREAD-TP.merged_data.txt
-
Number of patients = 223
-
Number of significantly mutated genes = 46
-
Number of selected clinical features = 11
-
Exclude genes that fewer than K tumors have mutations, K = 3
For survival clinical features, the Kaplan-Meier survival curves of tumors with and without gene mutations were plotted and the statistical significance P values were estimated by logrank test (Bland and Altman 2004) using the 'survdiff' function in R
For binary or multi-class clinical features (nominal or ordinal), two-tailed Fisher's exact tests (Fisher 1922) were used to estimate the P values using the 'fisher.test' function in R
For multiple hypothesis correction, Q value is the False Discovery Rate (FDR) analogue of the P value (Benjamini and Hochberg 1995), defined as the minimum FDR at which the test may be called significant. We used the 'Benjamini and Hochberg' method of 'p.adjust' function in R to convert P values into Q values.
In addition to the links below, the full results of the analysis summarized in this report can also be downloaded programmatically using firehose_get, or interactively from either the Broad GDAC website or TCGA Data Coordination Center Portal.