This pipeline computes the correlation between significant arm-level copy number variations (cnvs) and selected clinical features.
Testing the association between copy number variation 80 arm-level events and 8 clinical features across 565 patients, 11 significant findings detected with Q value < 0.25.
-
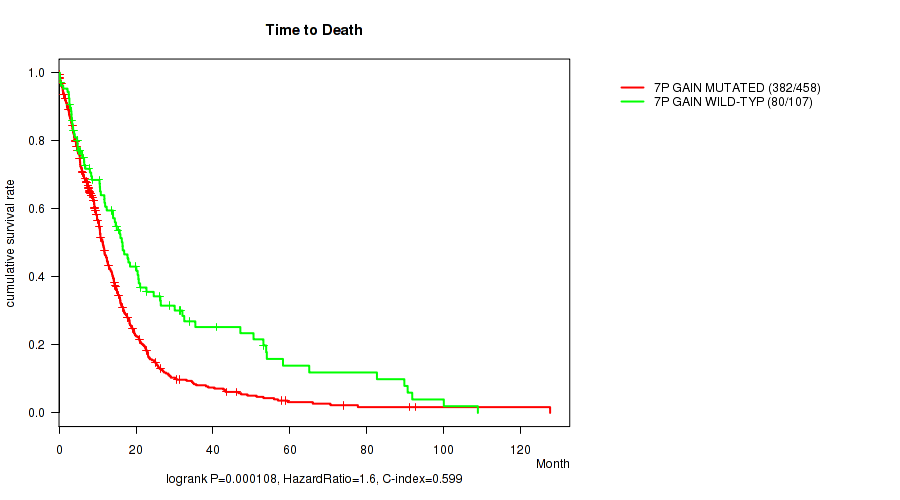
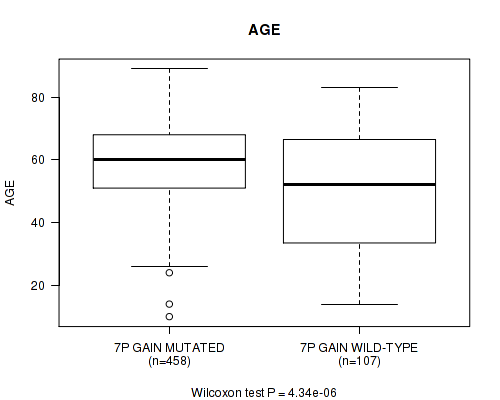
7p gain cnv correlated to 'Time to Death' and 'AGE'.
-
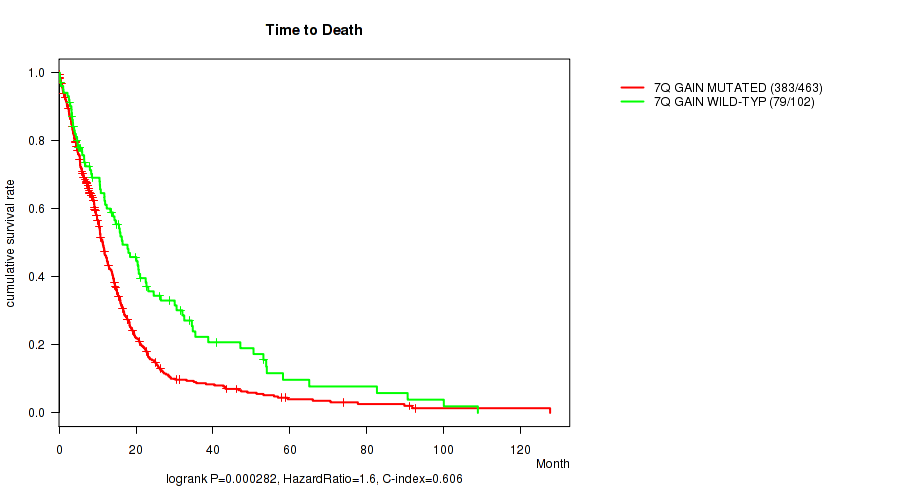
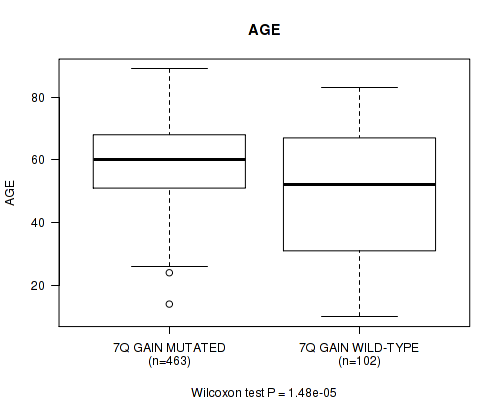
7q gain cnv correlated to 'Time to Death' and 'AGE'.
-
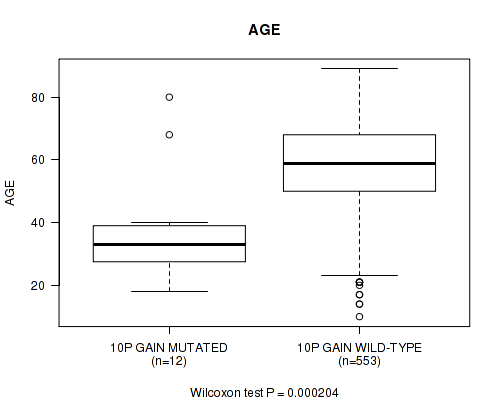
10p gain cnv correlated to 'AGE'.
-
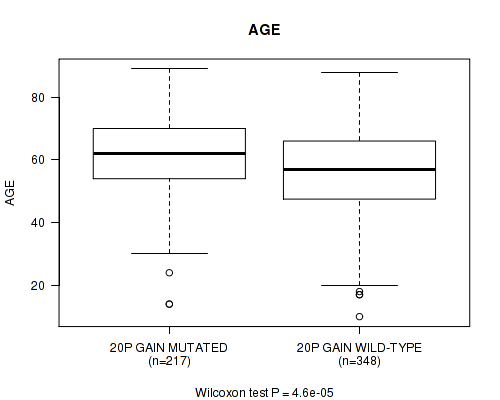
20p gain cnv correlated to 'AGE'.
-
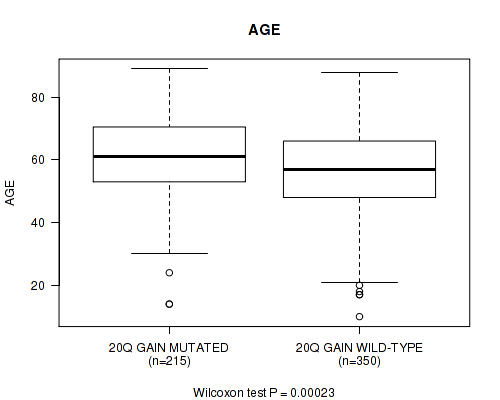
20q gain cnv correlated to 'AGE'.
-
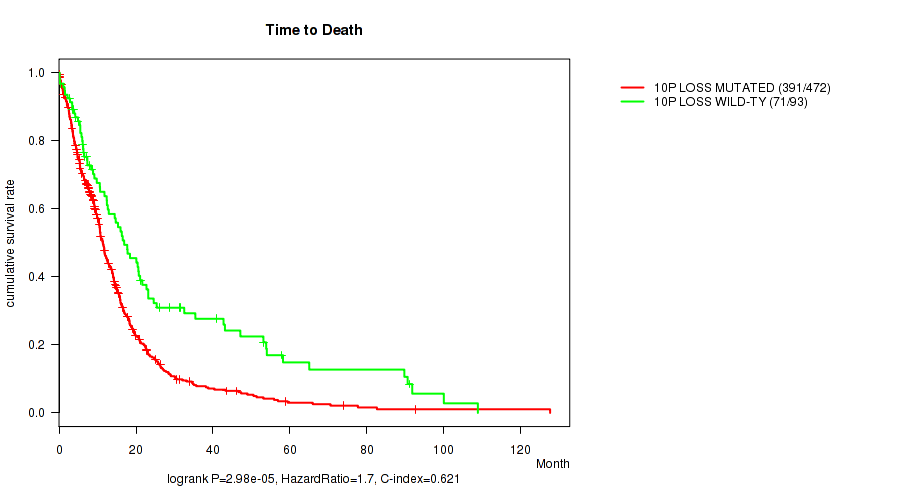
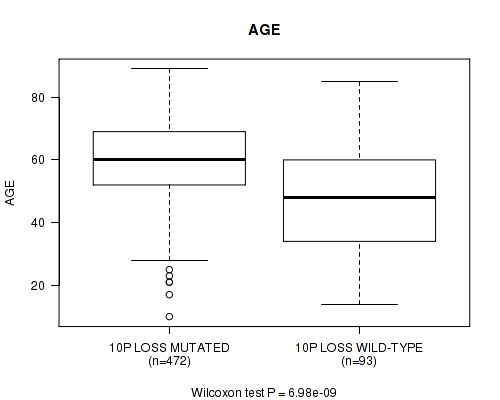
10p loss cnv correlated to 'Time to Death' and 'AGE'.
-
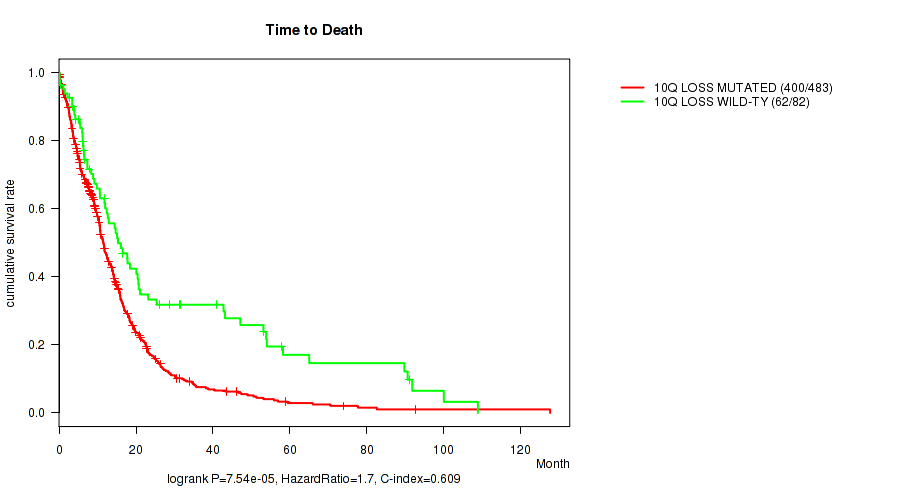
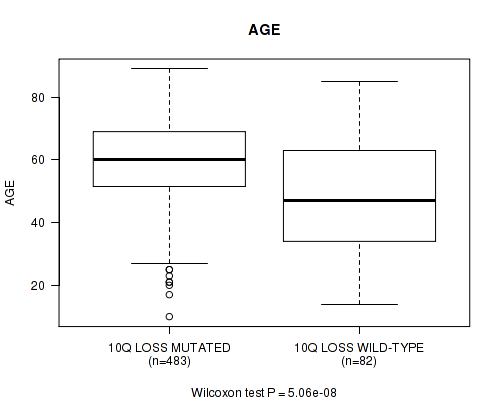
10q loss cnv correlated to 'Time to Death' and 'AGE'.
Table 1. Get Full Table Overview of the association between significant copy number variation of 80 arm-level events and 8 clinical features. Shown in the table are P values (Q values). Thresholded by Q value < 0.25, 11 significant findings detected.
|
Clinical Features |
Time to Death |
AGE | GENDER |
KARNOFSKY PERFORMANCE SCORE |
HISTOLOGICAL TYPE |
RADIATIONS RADIATION REGIMENINDICATION |
RACE | ETHNICITY | ||
| nCNV (%) | nWild-Type | logrank test | Wilcoxon-test | Fisher's exact test | Wilcoxon-test | Fisher's exact test | Fisher's exact test | Fisher's exact test | Fisher's exact test | |
| 7p gain | 458 (81%) | 107 |
0.000108 (0.0682) |
4.34e-06 (0.00276) |
0.827 (1.00) |
0.853 (1.00) |
0.0205 (1.00) |
0.136 (1.00) |
0.0536 (1.00) |
0.27 (1.00) |
| 7q gain | 463 (82%) | 102 |
0.000282 (0.177) |
1.48e-05 (0.00942) |
0.314 (1.00) |
0.96 (1.00) |
0.0301 (1.00) |
0.103 (1.00) |
0.0335 (1.00) |
0.249 (1.00) |
| 10p loss | 472 (84%) | 93 |
2.98e-05 (0.0189) |
6.98e-09 (4.46e-06) |
0.245 (1.00) |
0.165 (1.00) |
0.00488 (1.00) |
0.629 (1.00) |
0.105 (1.00) |
0.132 (1.00) |
| 10q loss | 483 (85%) | 82 |
7.54e-05 (0.0477) |
5.06e-08 (3.23e-05) |
0.541 (1.00) |
0.0142 (1.00) |
0.0411 (1.00) |
0.799 (1.00) |
0.0661 (1.00) |
0.0902 (1.00) |
| 10p gain | 12 (2%) | 553 |
0.00415 (1.00) |
0.000204 (0.129) |
0.0707 (1.00) |
0.633 (1.00) |
0.379 (1.00) |
1 (1.00) |
0.0292 (1.00) |
0.265 (1.00) |
| 20p gain | 217 (38%) | 348 |
0.486 (1.00) |
4.6e-05 (0.0292) |
0.33 (1.00) |
0.54 (1.00) |
0.353 (1.00) |
0.407 (1.00) |
0.025 (1.00) |
1 (1.00) |
| 20q gain | 215 (38%) | 350 |
0.669 (1.00) |
0.00023 (0.145) |
0.25 (1.00) |
0.722 (1.00) |
0.35 (1.00) |
0.518 (1.00) |
0.0376 (1.00) |
1 (1.00) |
| 1p gain | 81 (14%) | 484 |
0.219 (1.00) |
0.469 (1.00) |
0.624 (1.00) |
0.24 (1.00) |
0.0627 (1.00) |
0.306 (1.00) |
0.947 (1.00) |
0.667 (1.00) |
| 1q gain | 88 (16%) | 477 |
0.57 (1.00) |
0.618 (1.00) |
0.342 (1.00) |
0.335 (1.00) |
0.387 (1.00) |
0.389 (1.00) |
0.584 (1.00) |
0.691 (1.00) |
| 2p gain | 37 (7%) | 528 |
0.595 (1.00) |
0.788 (1.00) |
0.163 (1.00) |
0.544 (1.00) |
1 (1.00) |
0.72 (1.00) |
0.24 (1.00) |
1 (1.00) |
| 2q gain | 36 (6%) | 529 |
0.486 (1.00) |
0.313 (1.00) |
0.378 (1.00) |
0.383 (1.00) |
1 (1.00) |
1 (1.00) |
0.23 (1.00) |
1 (1.00) |
| 3p gain | 56 (10%) | 509 |
0.981 (1.00) |
0.0251 (1.00) |
0.391 (1.00) |
0.888 (1.00) |
0.264 (1.00) |
1 (1.00) |
0.922 (1.00) |
1 (1.00) |
| 3q gain | 62 (11%) | 503 |
0.734 (1.00) |
0.0702 (1.00) |
0.492 (1.00) |
0.811 (1.00) |
0.211 (1.00) |
0.569 (1.00) |
0.928 (1.00) |
1 (1.00) |
| 4p gain | 36 (6%) | 529 |
0.899 (1.00) |
0.49 (1.00) |
0.86 (1.00) |
0.0747 (1.00) |
1 (1.00) |
0.586 (1.00) |
0.549 (1.00) |
0.58 (1.00) |
| 4q gain | 33 (6%) | 532 |
0.968 (1.00) |
0.561 (1.00) |
0.467 (1.00) |
0.0712 (1.00) |
1 (1.00) |
0.343 (1.00) |
0.385 (1.00) |
1 (1.00) |
| 5p gain | 49 (9%) | 516 |
0.822 (1.00) |
0.681 (1.00) |
0.169 (1.00) |
0.207 (1.00) |
0.0568 (1.00) |
0.751 (1.00) |
1 (1.00) |
0.303 (1.00) |
| 5q gain | 41 (7%) | 524 |
0.657 (1.00) |
0.529 (1.00) |
0.134 (1.00) |
0.736 (1.00) |
0.0813 (1.00) |
0.605 (1.00) |
0.741 (1.00) |
0.612 (1.00) |
| 6p gain | 24 (4%) | 541 |
0.413 (1.00) |
0.494 (1.00) |
0.671 (1.00) |
0.766 (1.00) |
1 (1.00) |
0.268 (1.00) |
0.572 (1.00) |
1 (1.00) |
| 6q gain | 23 (4%) | 542 |
0.359 (1.00) |
0.248 (1.00) |
1 (1.00) |
0.73 (1.00) |
1 (1.00) |
0.651 (1.00) |
0.461 (1.00) |
1 (1.00) |
| 8p gain | 52 (9%) | 513 |
0.826 (1.00) |
0.808 (1.00) |
0.657 (1.00) |
0.595 (1.00) |
0.74 (1.00) |
0.757 (1.00) |
0.229 (1.00) |
1 (1.00) |
| 8q gain | 59 (10%) | 506 |
0.478 (1.00) |
0.368 (1.00) |
0.482 (1.00) |
0.699 (1.00) |
0.642 (1.00) |
1 (1.00) |
0.484 (1.00) |
1 (1.00) |
| 9p gain | 47 (8%) | 518 |
0.626 (1.00) |
0.646 (1.00) |
0.164 (1.00) |
0.875 (1.00) |
0.221 (1.00) |
0.871 (1.00) |
0.386 (1.00) |
0.245 (1.00) |
| 9q gain | 70 (12%) | 495 |
0.867 (1.00) |
0.931 (1.00) |
0.153 (1.00) |
0.814 (1.00) |
0.503 (1.00) |
0.892 (1.00) |
0.479 (1.00) |
0.646 (1.00) |
| 10q gain | 3 (1%) | 562 |
0.472 (1.00) |
0.66 (1.00) |
0.565 (1.00) |
1 (1.00) |
0.249 (1.00) |
1 (1.00) |
0.0734 (1.00) |
|
| 11p gain | 17 (3%) | 548 |
0.6 (1.00) |
0.955 (1.00) |
0.806 (1.00) |
0.374 (1.00) |
1 (1.00) |
0.6 (1.00) |
0.595 (1.00) |
0.338 (1.00) |
| 11q gain | 14 (2%) | 551 |
0.147 (1.00) |
0.116 (1.00) |
0.267 (1.00) |
0.164 (1.00) |
0.435 (1.00) |
0.162 (1.00) |
1 (1.00) |
0.302 (1.00) |
| 12p gain | 58 (10%) | 507 |
0.635 (1.00) |
0.416 (1.00) |
0.571 (1.00) |
0.789 (1.00) |
0.767 (1.00) |
0.461 (1.00) |
0.853 (1.00) |
1 (1.00) |
| 12q gain | 47 (8%) | 518 |
0.981 (1.00) |
0.786 (1.00) |
0.279 (1.00) |
0.936 (1.00) |
0.522 (1.00) |
0.518 (1.00) |
0.0955 (1.00) |
1 (1.00) |
| 13q gain | 10 (2%) | 555 |
0.537 (1.00) |
0.011 (1.00) |
0.202 (1.00) |
0.072 (1.00) |
0.52 (1.00) |
0.0859 (1.00) |
0.675 (1.00) |
1 (1.00) |
| 14q gain | 22 (4%) | 543 |
0.256 (1.00) |
0.0587 (1.00) |
0.513 (1.00) |
0.471 (1.00) |
0.0737 (1.00) |
0.817 (1.00) |
1 (1.00) |
1 (1.00) |
| 15q gain | 24 (4%) | 541 |
0.495 (1.00) |
0.883 (1.00) |
0.527 (1.00) |
0.0921 (1.00) |
0.66 (1.00) |
0.182 (1.00) |
0.84 (1.00) |
1 (1.00) |
| 16p gain | 38 (7%) | 527 |
0.0323 (1.00) |
0.851 (1.00) |
0.306 (1.00) |
0.957 (1.00) |
1 (1.00) |
0.0716 (1.00) |
0.315 (1.00) |
1 (1.00) |
| 16q gain | 37 (7%) | 528 |
0.121 (1.00) |
0.872 (1.00) |
0.606 (1.00) |
0.848 (1.00) |
1 (1.00) |
0.0714 (1.00) |
0.266 (1.00) |
1 (1.00) |
| 17p gain | 47 (8%) | 518 |
0.227 (1.00) |
0.0379 (1.00) |
0.212 (1.00) |
0.387 (1.00) |
0.639 (1.00) |
0.417 (1.00) |
0.521 (1.00) |
1 (1.00) |
| 17q gain | 58 (10%) | 507 |
0.0362 (1.00) |
0.0202 (1.00) |
0.48 (1.00) |
0.473 (1.00) |
0.638 (1.00) |
0.376 (1.00) |
0.593 (1.00) |
0.371 (1.00) |
| 18p gain | 57 (10%) | 508 |
0.757 (1.00) |
0.394 (1.00) |
0.669 (1.00) |
0.237 (1.00) |
0.086 (1.00) |
0.766 (1.00) |
0.292 (1.00) |
0.352 (1.00) |
| 18q gain | 57 (10%) | 508 |
0.909 (1.00) |
0.229 (1.00) |
0.2 (1.00) |
0.24 (1.00) |
0.0864 (1.00) |
0.551 (1.00) |
0.498 (1.00) |
1 (1.00) |
| 19p gain | 219 (39%) | 346 |
0.383 (1.00) |
0.806 (1.00) |
0.791 (1.00) |
0.979 (1.00) |
0.619 (1.00) |
0.854 (1.00) |
0.578 (1.00) |
0.55 (1.00) |
| 19q gain | 193 (34%) | 372 |
0.446 (1.00) |
0.588 (1.00) |
0.586 (1.00) |
0.884 (1.00) |
0.929 (1.00) |
0.571 (1.00) |
0.33 (1.00) |
0.355 (1.00) |
| 21q gain | 62 (11%) | 503 |
0.598 (1.00) |
0.106 (1.00) |
1 (1.00) |
0.125 (1.00) |
0.141 (1.00) |
1 (1.00) |
0.106 (1.00) |
0.376 (1.00) |
| 22q gain | 34 (6%) | 531 |
0.419 (1.00) |
0.576 (1.00) |
1 (1.00) |
0.322 (1.00) |
0.399 (1.00) |
1 (1.00) |
0.686 (1.00) |
0.151 (1.00) |
| xq gain | 16 (3%) | 549 |
0.846 (1.00) |
0.557 (1.00) |
1 (1.00) |
0.619 (1.00) |
0.313 (1.00) |
0.174 (1.00) |
0.733 (1.00) |
0.246 (1.00) |
| 1p loss | 15 (3%) | 550 |
0.281 (1.00) |
0.0518 (1.00) |
0.425 (1.00) |
0.819 (1.00) |
0.464 (1.00) |
0.58 (1.00) |
0.732 (1.00) |
1 (1.00) |
| 1q loss | 14 (2%) | 551 |
0.519 (1.00) |
0.0265 (1.00) |
1 (1.00) |
0.17 (1.00) |
1 (1.00) |
0.4 (1.00) |
0.712 (1.00) |
1 (1.00) |
| 2p loss | 31 (5%) | 534 |
0.819 (1.00) |
0.0829 (1.00) |
0.0877 (1.00) |
0.844 (1.00) |
1 (1.00) |
0.324 (1.00) |
0.671 (1.00) |
1 (1.00) |
| 2q loss | 31 (5%) | 534 |
0.996 (1.00) |
0.111 (1.00) |
0.185 (1.00) |
0.572 (1.00) |
0.52 (1.00) |
0.166 (1.00) |
0.673 (1.00) |
1 (1.00) |
| 3p loss | 40 (7%) | 525 |
0.291 (1.00) |
0.0681 (1.00) |
1 (1.00) |
0.998 (1.00) |
0.464 (1.00) |
0.0827 (1.00) |
0.583 (1.00) |
0.207 (1.00) |
| 3q loss | 34 (6%) | 531 |
0.766 (1.00) |
0.652 (1.00) |
0.589 (1.00) |
0.636 (1.00) |
0.745 (1.00) |
0.572 (1.00) |
0.697 (1.00) |
0.519 (1.00) |
| 4p loss | 53 (9%) | 512 |
0.752 (1.00) |
0.733 (1.00) |
0.184 (1.00) |
0.258 (1.00) |
0.416 (1.00) |
0.541 (1.00) |
0.577 (1.00) |
0.303 (1.00) |
| 4q loss | 54 (10%) | 511 |
0.214 (1.00) |
0.122 (1.00) |
0.771 (1.00) |
0.305 (1.00) |
1 (1.00) |
0.76 (1.00) |
0.587 (1.00) |
0.284 (1.00) |
| 5p loss | 42 (7%) | 523 |
0.056 (1.00) |
0.518 (1.00) |
1 (1.00) |
0.567 (1.00) |
0.48 (1.00) |
0.0252 (1.00) |
0.109 (1.00) |
0.207 (1.00) |
| 5q loss | 43 (8%) | 522 |
0.108 (1.00) |
0.568 (1.00) |
1 (1.00) |
0.757 (1.00) |
0.254 (1.00) |
0.126 (1.00) |
0.404 (1.00) |
0.0499 (1.00) |
| 6p loss | 86 (15%) | 479 |
0.00482 (1.00) |
0.388 (1.00) |
0.811 (1.00) |
0.496 (1.00) |
0.677 (1.00) |
0.619 (1.00) |
0.239 (1.00) |
0.701 (1.00) |
| 6q loss | 124 (22%) | 441 |
0.369 (1.00) |
0.761 (1.00) |
0.298 (1.00) |
0.691 (1.00) |
0.789 (1.00) |
1 (1.00) |
0.18 (1.00) |
0.478 (1.00) |
| 7p loss | 8 (1%) | 557 |
0.355 (1.00) |
0.0522 (1.00) |
1 (1.00) |
0.741 (1.00) |
1 (1.00) |
0.448 (1.00) |
0.592 (1.00) |
1 (1.00) |
| 7q loss | 6 (1%) | 559 |
0.528 (1.00) |
0.0236 (1.00) |
1 (1.00) |
0.303 (1.00) |
1 (1.00) |
0.669 (1.00) |
0.488 (1.00) |
1 (1.00) |
| 8p loss | 58 (10%) | 507 |
0.602 (1.00) |
0.175 (1.00) |
0.156 (1.00) |
0.39 (1.00) |
0.768 (1.00) |
0.461 (1.00) |
0.00535 (1.00) |
0.62 (1.00) |
| 8q loss | 42 (7%) | 523 |
0.201 (1.00) |
0.211 (1.00) |
0.416 (1.00) |
0.245 (1.00) |
1 (1.00) |
0.866 (1.00) |
0.304 (1.00) |
1 (1.00) |
| 9p loss | 197 (35%) | 368 |
0.71 (1.00) |
0.547 (1.00) |
0.652 (1.00) |
0.525 (1.00) |
0.81 (1.00) |
0.707 (1.00) |
0.437 (1.00) |
0.064 (1.00) |
| 9q loss | 92 (16%) | 473 |
0.578 (1.00) |
0.741 (1.00) |
0.414 (1.00) |
0.77 (1.00) |
0.211 (1.00) |
0.716 (1.00) |
0.226 (1.00) |
0.234 (1.00) |
| 11p loss | 98 (17%) | 467 |
0.184 (1.00) |
0.948 (1.00) |
0.111 (1.00) |
0.759 (1.00) |
0.449 (1.00) |
0.636 (1.00) |
0.652 (1.00) |
0.7 (1.00) |
| 11q loss | 93 (16%) | 472 |
0.904 (1.00) |
0.361 (1.00) |
0.419 (1.00) |
0.773 (1.00) |
1 (1.00) |
0.276 (1.00) |
1 (1.00) |
0.229 (1.00) |
| 12p loss | 58 (10%) | 507 |
0.999 (1.00) |
0.62 (1.00) |
0.48 (1.00) |
0.778 (1.00) |
0.835 (1.00) |
0.461 (1.00) |
0.298 (1.00) |
1 (1.00) |
| 12q loss | 57 (10%) | 508 |
0.96 (1.00) |
0.667 (1.00) |
0.568 (1.00) |
0.611 (1.00) |
0.518 (1.00) |
1 (1.00) |
0.291 (1.00) |
0.333 (1.00) |
| 13q loss | 183 (32%) | 382 |
0.75 (1.00) |
0.715 (1.00) |
1 (1.00) |
0.76 (1.00) |
0.594 (1.00) |
0.701 (1.00) |
0.5 (1.00) |
0.759 (1.00) |
| 14q loss | 144 (25%) | 421 |
0.976 (1.00) |
0.689 (1.00) |
0.429 (1.00) |
0.881 (1.00) |
0.546 (1.00) |
0.758 (1.00) |
0.199 (1.00) |
0.311 (1.00) |
| 15q loss | 102 (18%) | 463 |
0.712 (1.00) |
0.0527 (1.00) |
0.576 (1.00) |
0.982 (1.00) |
0.719 (1.00) |
0.0799 (1.00) |
0.516 (1.00) |
0.249 (1.00) |
| 16p loss | 63 (11%) | 502 |
0.042 (1.00) |
0.312 (1.00) |
0.683 (1.00) |
0.862 (1.00) |
0.279 (1.00) |
0.045 (1.00) |
1 (1.00) |
1 (1.00) |
| 16q loss | 82 (15%) | 483 |
0.015 (1.00) |
0.83 (1.00) |
1 (1.00) |
0.599 (1.00) |
0.59 (1.00) |
0.0216 (1.00) |
0.481 (1.00) |
0.699 (1.00) |
| 17p loss | 62 (11%) | 503 |
0.658 (1.00) |
0.579 (1.00) |
0.336 (1.00) |
0.947 (1.00) |
0.919 (1.00) |
0.196 (1.00) |
0.933 (1.00) |
1 (1.00) |
| 17q loss | 40 (7%) | 525 |
0.978 (1.00) |
0.472 (1.00) |
0.503 (1.00) |
0.69 (1.00) |
1 (1.00) |
0.0527 (1.00) |
0.591 (1.00) |
0.591 (1.00) |
| 18p loss | 69 (12%) | 496 |
0.129 (1.00) |
0.73 (1.00) |
0.602 (1.00) |
0.601 (1.00) |
0.682 (1.00) |
1 (1.00) |
0.325 (1.00) |
0.646 (1.00) |
| 18q loss | 61 (11%) | 504 |
0.3 (1.00) |
0.682 (1.00) |
0.89 (1.00) |
0.278 (1.00) |
0.777 (1.00) |
0.248 (1.00) |
0.199 (1.00) |
0.143 (1.00) |
| 19p loss | 27 (5%) | 538 |
0.548 (1.00) |
0.948 (1.00) |
1 (1.00) |
0.749 (1.00) |
0.843 (1.00) |
0.835 (1.00) |
1 (1.00) |
1 (1.00) |
| 19q loss | 35 (6%) | 530 |
0.661 (1.00) |
0.877 (1.00) |
1 (1.00) |
0.766 (1.00) |
0.335 (1.00) |
1 (1.00) |
0.794 (1.00) |
1 (1.00) |
| 20p loss | 18 (3%) | 547 |
0.857 (1.00) |
0.382 (1.00) |
0.219 (1.00) |
0.92 (1.00) |
1 (1.00) |
1 (1.00) |
0.287 (1.00) |
0.338 (1.00) |
| 20q loss | 16 (3%) | 549 |
0.765 (1.00) |
0.715 (1.00) |
0.196 (1.00) |
0.988 (1.00) |
1 (1.00) |
0.787 (1.00) |
0.754 (1.00) |
1 (1.00) |
| 21q loss | 41 (7%) | 524 |
0.968 (1.00) |
0.852 (1.00) |
0.619 (1.00) |
0.321 (1.00) |
1 (1.00) |
0.388 (1.00) |
0.821 (1.00) |
0.235 (1.00) |
| 22q loss | 180 (32%) | 385 |
0.482 (1.00) |
0.11 (1.00) |
0.926 (1.00) |
0.437 (1.00) |
0.569 (1.00) |
0.847 (1.00) |
0.78 (1.00) |
1 (1.00) |
| xq loss | 104 (18%) | 461 |
0.364 (1.00) |
0.729 (1.00) |
0.375 (1.00) |
0.394 (1.00) |
0.852 (1.00) |
0.729 (1.00) |
0.193 (1.00) |
0.468 (1.00) |
P value = 0.000108 (logrank test), Q value = 0.068
Table S1. Gene #13: '7p gain' versus Clinical Feature #1: 'Time to Death'
| nPatients | nDeath | Duration Range (Median), Month | |
|---|---|---|---|
| ALL | 565 | 462 | 0.1 - 127.6 (10.0) |
| 7P GAIN MUTATED | 458 | 382 | 0.1 - 127.6 (9.7) |
| 7P GAIN WILD-TYPE | 107 | 80 | 0.2 - 108.8 (12.4) |
Figure S1. Get High-res Image Gene #13: '7p gain' versus Clinical Feature #1: 'Time to Death'
P value = 4.34e-06 (Wilcoxon-test), Q value = 0.0028
Table S2. Gene #13: '7p gain' versus Clinical Feature #2: 'AGE'
| nPatients | Mean (Std.Dev) | |
|---|---|---|
| ALL | 565 | 57.8 (14.5) |
| 7P GAIN MUTATED | 458 | 59.6 (12.4) |
| 7P GAIN WILD-TYPE | 107 | 49.8 (19.4) |
Figure S2. Get High-res Image Gene #13: '7p gain' versus Clinical Feature #2: 'AGE'
P value = 0.000282 (logrank test), Q value = 0.18
Table S3. Gene #14: '7q gain' versus Clinical Feature #1: 'Time to Death'
| nPatients | nDeath | Duration Range (Median), Month | |
|---|---|---|---|
| ALL | 565 | 462 | 0.1 - 127.6 (10.0) |
| 7Q GAIN MUTATED | 463 | 383 | 0.1 - 127.6 (9.6) |
| 7Q GAIN WILD-TYPE | 102 | 79 | 0.2 - 108.8 (13.8) |
Figure S3. Get High-res Image Gene #14: '7q gain' versus Clinical Feature #1: 'Time to Death'
P value = 1.48e-05 (Wilcoxon-test), Q value = 0.0094
Table S4. Gene #14: '7q gain' versus Clinical Feature #2: 'AGE'
| nPatients | Mean (Std.Dev) | |
|---|---|---|
| ALL | 565 | 57.8 (14.5) |
| 7Q GAIN MUTATED | 463 | 59.6 (12.3) |
| 7Q GAIN WILD-TYPE | 102 | 49.6 (20.1) |
Figure S4. Get High-res Image Gene #14: '7q gain' versus Clinical Feature #2: 'AGE'
P value = 0.000204 (Wilcoxon-test), Q value = 0.13
Table S5. Gene #19: '10p gain' versus Clinical Feature #2: 'AGE'
| nPatients | Mean (Std.Dev) | |
|---|---|---|
| ALL | 565 | 57.8 (14.5) |
| 10P GAIN MUTATED | 12 | 38.1 (18.1) |
| 10P GAIN WILD-TYPE | 553 | 58.2 (14.1) |
Figure S5. Get High-res Image Gene #19: '10p gain' versus Clinical Feature #2: 'AGE'
P value = 4.6e-05 (Wilcoxon-test), Q value = 0.029
Table S6. Gene #36: '20p gain' versus Clinical Feature #2: 'AGE'
| nPatients | Mean (Std.Dev) | |
|---|---|---|
| ALL | 565 | 57.8 (14.5) |
| 20P GAIN MUTATED | 217 | 60.9 (13.0) |
| 20P GAIN WILD-TYPE | 348 | 55.8 (15.0) |
Figure S6. Get High-res Image Gene #36: '20p gain' versus Clinical Feature #2: 'AGE'
P value = 0.00023 (Wilcoxon-test), Q value = 0.14
Table S7. Gene #37: '20q gain' versus Clinical Feature #2: 'AGE'
| nPatients | Mean (Std.Dev) | |
|---|---|---|
| ALL | 565 | 57.8 (14.5) |
| 20Q GAIN MUTATED | 215 | 60.7 (13.3) |
| 20Q GAIN WILD-TYPE | 350 | 56.0 (14.9) |
Figure S7. Get High-res Image Gene #37: '20q gain' versus Clinical Feature #2: 'AGE'
P value = 2.98e-05 (logrank test), Q value = 0.019
Table S8. Gene #59: '10p loss' versus Clinical Feature #1: 'Time to Death'
| nPatients | nDeath | Duration Range (Median), Month | |
|---|---|---|---|
| ALL | 565 | 462 | 0.1 - 127.6 (10.0) |
| 10P LOSS MUTATED | 472 | 391 | 0.1 - 127.6 (9.8) |
| 10P LOSS WILD-TYPE | 93 | 71 | 0.2 - 108.8 (12.7) |
Figure S8. Get High-res Image Gene #59: '10p loss' versus Clinical Feature #1: 'Time to Death'
P value = 6.98e-09 (Wilcoxon-test), Q value = 4.5e-06
Table S9. Gene #59: '10p loss' versus Clinical Feature #2: 'AGE'
| nPatients | Mean (Std.Dev) | |
|---|---|---|
| ALL | 565 | 57.8 (14.5) |
| 10P LOSS MUTATED | 472 | 59.6 (12.7) |
| 10P LOSS WILD-TYPE | 93 | 48.1 (18.8) |
Figure S9. Get High-res Image Gene #59: '10p loss' versus Clinical Feature #2: 'AGE'
P value = 7.54e-05 (logrank test), Q value = 0.048
Table S10. Gene #60: '10q loss' versus Clinical Feature #1: 'Time to Death'
| nPatients | nDeath | Duration Range (Median), Month | |
|---|---|---|---|
| ALL | 565 | 462 | 0.1 - 127.6 (10.0) |
| 10Q LOSS MUTATED | 483 | 400 | 0.1 - 127.6 (9.9) |
| 10Q LOSS WILD-TYPE | 82 | 62 | 0.2 - 108.8 (12.2) |
Figure S10. Get High-res Image Gene #60: '10q loss' versus Clinical Feature #1: 'Time to Death'
P value = 5.06e-08 (Wilcoxon-test), Q value = 3.2e-05
Table S11. Gene #60: '10q loss' versus Clinical Feature #2: 'AGE'
| nPatients | Mean (Std.Dev) | |
|---|---|---|
| ALL | 565 | 57.8 (14.5) |
| 10Q LOSS MUTATED | 483 | 59.4 (13.0) |
| 10Q LOSS WILD-TYPE | 82 | 48.1 (18.5) |
Figure S11. Get High-res Image Gene #60: '10q loss' versus Clinical Feature #2: 'AGE'
-
Copy number data file = transformed.cor.cli.txt
-
Clinical data file = GBM-TP.merged_data.txt
-
Number of patients = 565
-
Number of significantly arm-level cnvs = 80
-
Number of selected clinical features = 8
-
Exclude regions that fewer than K tumors have mutations, K = 3
For survival clinical features, the Kaplan-Meier survival curves of tumors with and without gene mutations were plotted and the statistical significance P values were estimated by logrank test (Bland and Altman 2004) using the 'survdiff' function in R
For binary or multi-class clinical features (nominal or ordinal), two-tailed Fisher's exact tests (Fisher 1922) were used to estimate the P values using the 'fisher.test' function in R
For multiple hypothesis correction, Q value is the False Discovery Rate (FDR) analogue of the P value (Benjamini and Hochberg 1995), defined as the minimum FDR at which the test may be called significant. We used the 'Benjamini and Hochberg' method of 'p.adjust' function in R to convert P values into Q values.
In addition to the links below, the full results of the analysis summarized in this report can also be downloaded programmatically using firehose_get, or interactively from either the Broad GDAC website or TCGA Data Coordination Center Portal.