This pipeline computes the correlation between significant copy number variation (cnv focal) genes and selected clinical features.
Testing the association between copy number variation 71 focal events and 8 clinical features across 565 patients, 15 significant findings detected with Q value < 0.25.
-
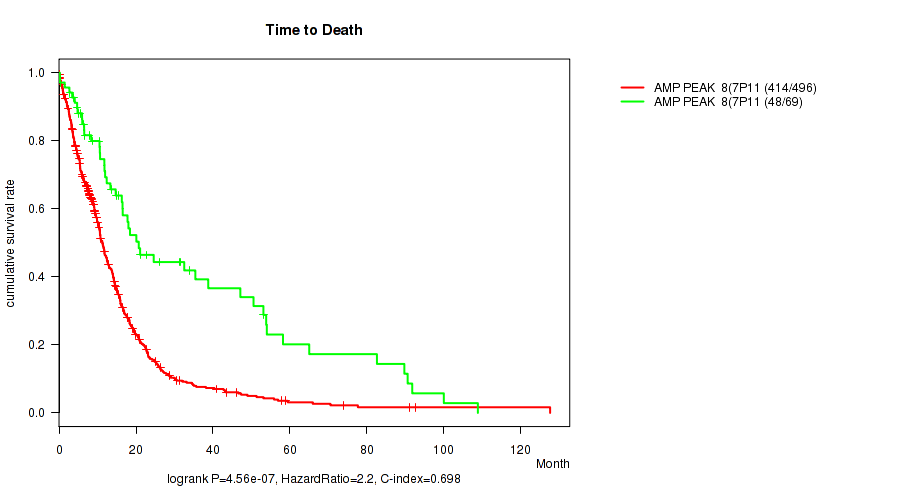
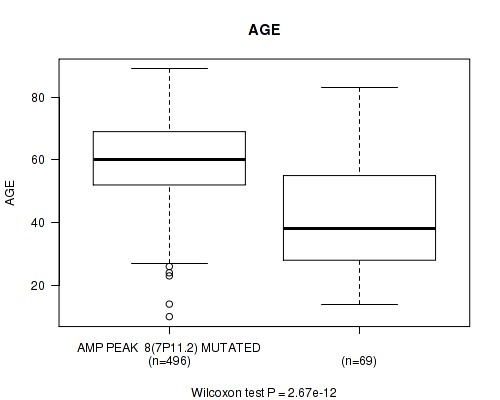
amp_7p11.2 cnv correlated to 'Time to Death' and 'AGE'.
-
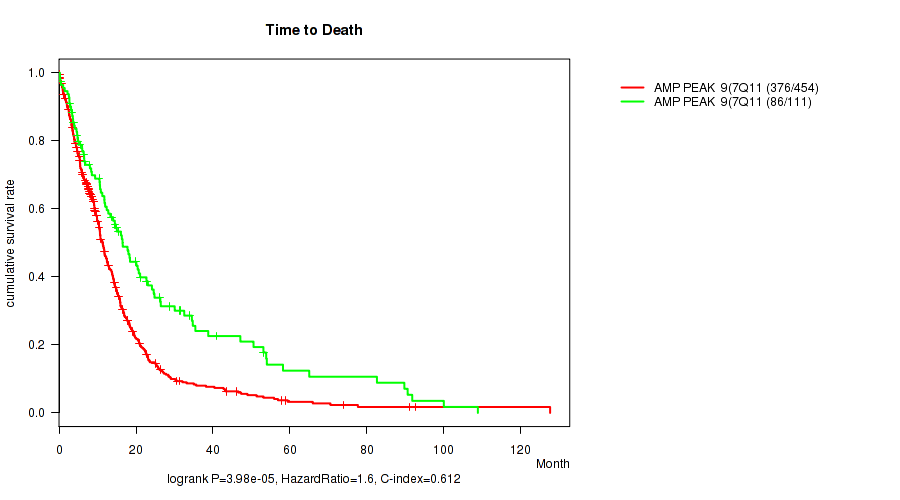
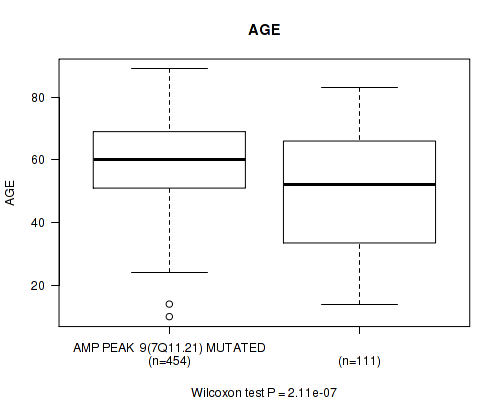
amp_7q11.21 cnv correlated to 'Time to Death' and 'AGE'.
-
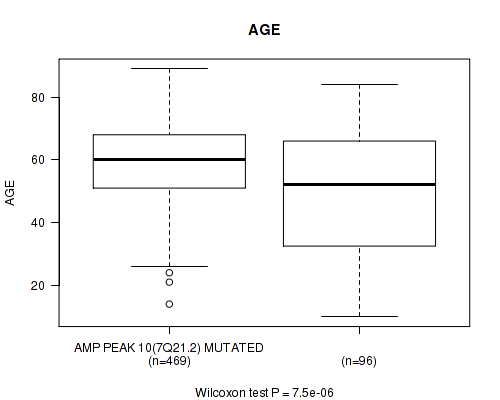
amp_7q21.2 cnv correlated to 'AGE'.
-
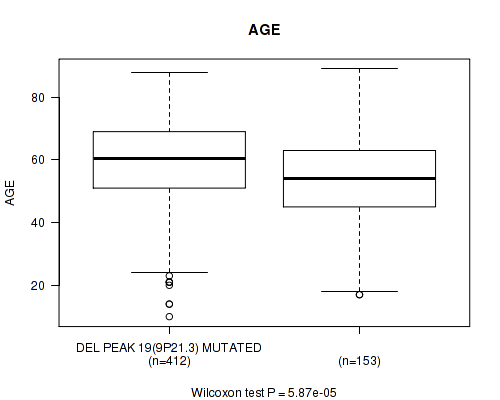
del_9p21.3 cnv correlated to 'AGE'.
-
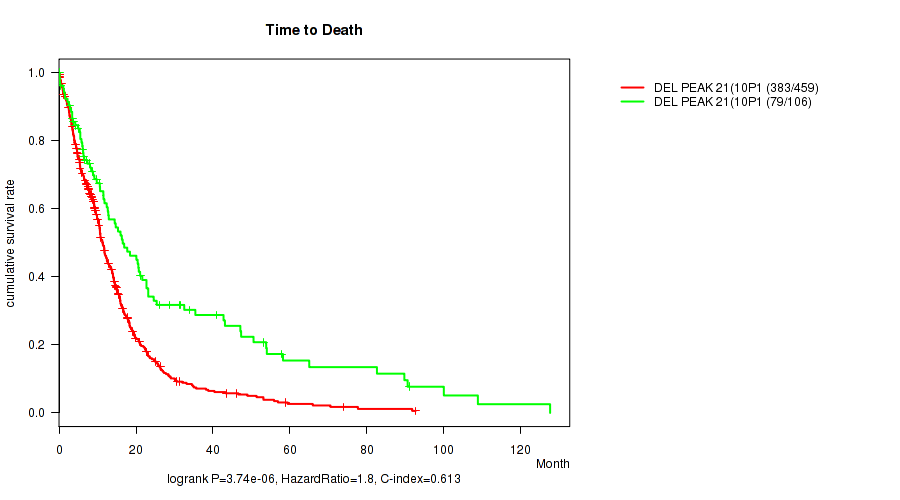
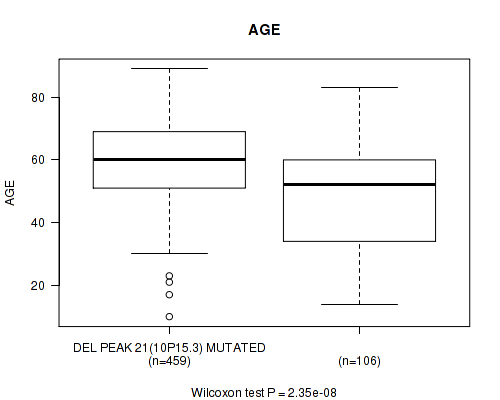
del_10p15.3 cnv correlated to 'Time to Death' and 'AGE'.
-
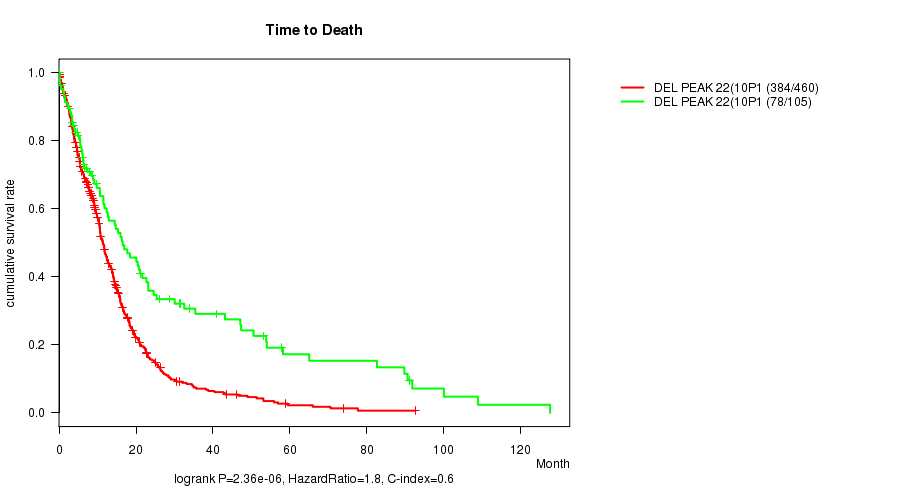
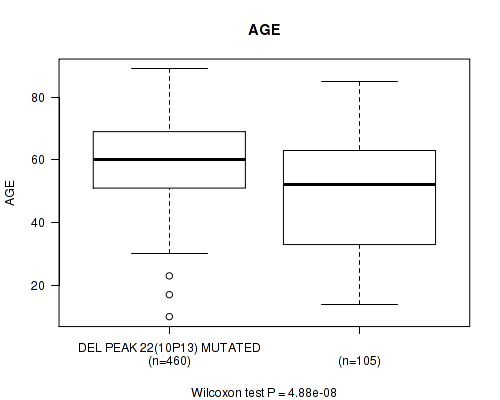
del_10p13 cnv correlated to 'Time to Death' and 'AGE'.
-
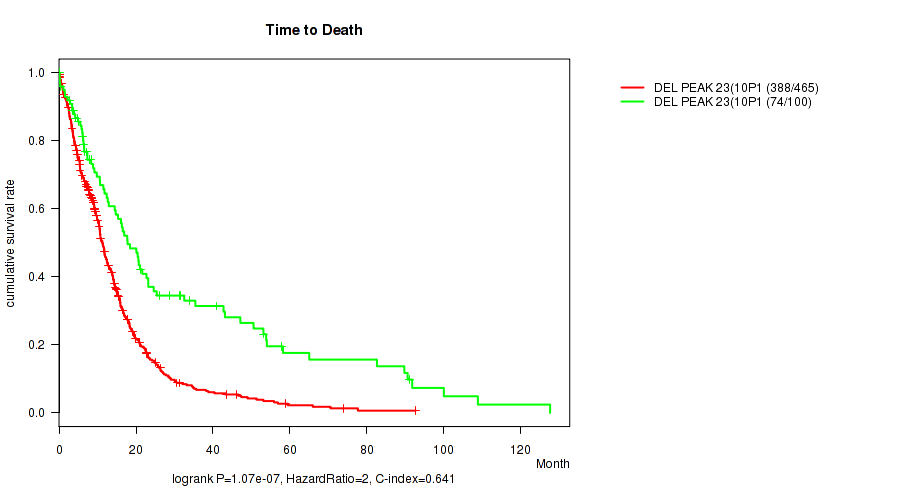
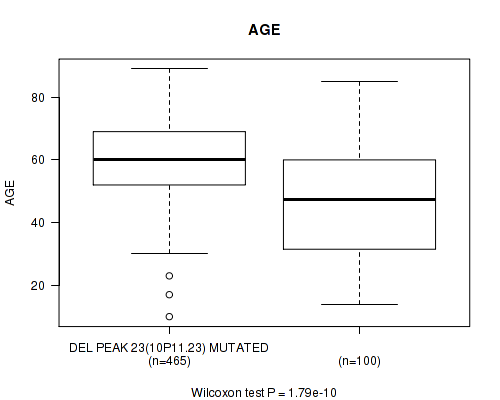
del_10p11.23 cnv correlated to 'Time to Death' and 'AGE'.
-
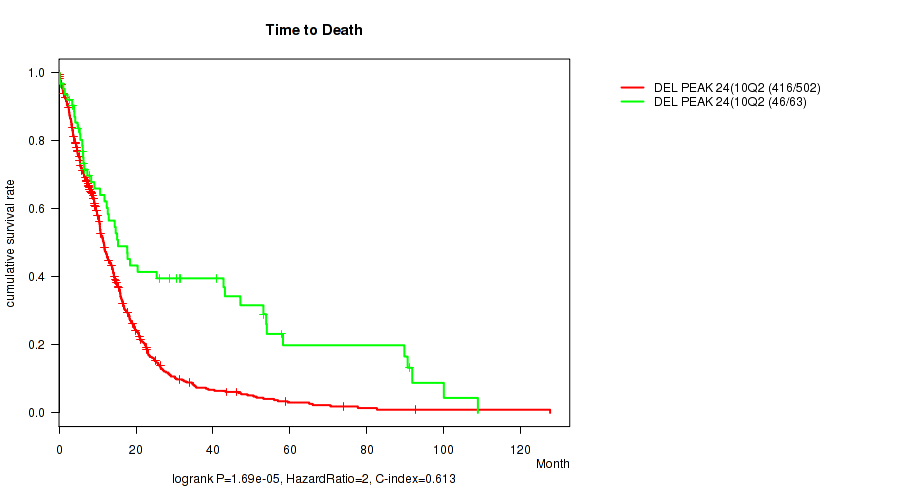
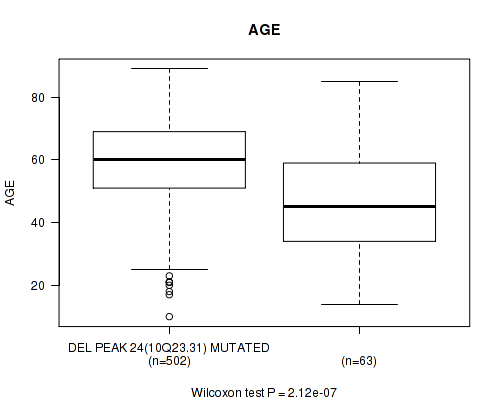
del_10q23.31 cnv correlated to 'Time to Death' and 'AGE'.
-
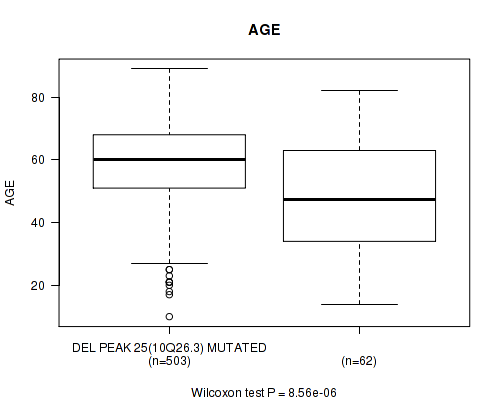
del_10q26.3 cnv correlated to 'AGE'.
Table 1. Get Full Table Overview of the association between significant copy number variation of 71 focal events and 8 clinical features. Shown in the table are P values (Q values). Thresholded by Q value < 0.25, 15 significant findings detected.
|
Clinical Features |
Time to Death |
AGE | GENDER |
KARNOFSKY PERFORMANCE SCORE |
HISTOLOGICAL TYPE |
RADIATIONS RADIATION REGIMENINDICATION |
RACE | ETHNICITY | ||
| nCNV (%) | nWild-Type | logrank test | Wilcoxon-test | Fisher's exact test | Wilcoxon-test | Fisher's exact test | Fisher's exact test | Fisher's exact test | Fisher's exact test | |
| amp 7p11 2 | 496 (88%) | 69 |
4.56e-07 (0.000256) |
2.67e-12 (1.52e-09) |
0.357 (1.00) |
0.0692 (1.00) |
0.0557 (1.00) |
0.0992 (1.00) |
0.44 (1.00) |
0.0595 (1.00) |
| amp 7q11 21 | 454 (80%) | 111 |
3.98e-05 (0.0221) |
2.11e-07 (0.000119) |
0.278 (1.00) |
0.503 (1.00) |
0.00869 (1.00) |
0.115 (1.00) |
0.269 (1.00) |
0.14 (1.00) |
| del 10p15 3 | 459 (81%) | 106 |
3.74e-06 (0.00209) |
2.35e-08 (1.33e-05) |
0.185 (1.00) |
0.512 (1.00) |
0.0179 (1.00) |
0.646 (1.00) |
0.176 (1.00) |
0.274 (1.00) |
| del 10p13 | 460 (81%) | 105 |
2.36e-06 (0.00132) |
4.88e-08 (2.76e-05) |
0.0599 (1.00) |
0.847 (1.00) |
0.00668 (1.00) |
0.908 (1.00) |
0.119 (1.00) |
0.27 (1.00) |
| del 10p11 23 | 465 (82%) | 100 |
1.07e-07 (6.05e-05) |
1.79e-10 (1.02e-07) |
0.143 (1.00) |
0.128 (1.00) |
0.00255 (1.00) |
0.814 (1.00) |
0.152 (1.00) |
0.251 (1.00) |
| del 10q23 31 | 502 (89%) | 63 |
1.69e-05 (0.00941) |
2.12e-07 (0.000119) |
0.785 (1.00) |
0.0807 (1.00) |
0.0099 (1.00) |
1 (1.00) |
0.345 (1.00) |
0.637 (1.00) |
| amp 7q21 2 | 469 (83%) | 96 |
0.000455 (0.252) |
7.5e-06 (0.00418) |
0.492 (1.00) |
0.4 (1.00) |
0.0992 (1.00) |
0.152 (1.00) |
0.0389 (1.00) |
0.0442 (1.00) |
| del 9p21 3 | 412 (73%) | 153 |
0.0175 (1.00) |
5.87e-05 (0.0325) |
0.44 (1.00) |
0.15 (1.00) |
0.584 (1.00) |
0.364 (1.00) |
0.784 (1.00) |
0.746 (1.00) |
| del 10q26 3 | 503 (89%) | 62 |
0.0011 (0.605) |
8.56e-06 (0.00477) |
0.68 (1.00) |
0.082 (1.00) |
0.0337 (1.00) |
1 (1.00) |
0.095 (1.00) |
0.634 (1.00) |
| amp 1p36 21 | 91 (16%) | 474 |
0.0549 (1.00) |
0.275 (1.00) |
0.483 (1.00) |
0.193 (1.00) |
0.0314 (1.00) |
0.716 (1.00) |
0.125 (1.00) |
0.402 (1.00) |
| amp 1q32 1 | 156 (28%) | 409 |
0.415 (1.00) |
0.187 (1.00) |
0.923 (1.00) |
0.382 (1.00) |
0.923 (1.00) |
0.764 (1.00) |
0.934 (1.00) |
0.527 (1.00) |
| amp 1q44 | 98 (17%) | 467 |
0.331 (1.00) |
0.958 (1.00) |
0.213 (1.00) |
0.535 (1.00) |
0.262 (1.00) |
0.554 (1.00) |
0.784 (1.00) |
0.428 (1.00) |
| amp 2p24 3 | 49 (9%) | 516 |
0.207 (1.00) |
0.271 (1.00) |
0.445 (1.00) |
0.934 (1.00) |
1 (1.00) |
0.874 (1.00) |
0.397 (1.00) |
0.612 (1.00) |
| amp 3q26 33 | 108 (19%) | 457 |
0.254 (1.00) |
0.0324 (1.00) |
0.662 (1.00) |
0.728 (1.00) |
0.00208 (1.00) |
1 (1.00) |
0.206 (1.00) |
0.701 (1.00) |
| amp 4p16 3 | 48 (8%) | 517 |
0.817 (1.00) |
0.843 (1.00) |
0.356 (1.00) |
0.368 (1.00) |
0.902 (1.00) |
0.748 (1.00) |
0.835 (1.00) |
1 (1.00) |
| amp 4q12 | 106 (19%) | 459 |
0.391 (1.00) |
0.186 (1.00) |
0.323 (1.00) |
0.815 (1.00) |
0.399 (1.00) |
0.303 (1.00) |
0.667 (1.00) |
1 (1.00) |
| amp 7q31 2 | 462 (82%) | 103 |
0.00727 (1.00) |
0.00159 (0.878) |
0.318 (1.00) |
0.999 (1.00) |
0.249 (1.00) |
0.0487 (1.00) |
0.0489 (1.00) |
0.0552 (1.00) |
| amp 8q24 21 | 70 (12%) | 495 |
0.278 (1.00) |
0.434 (1.00) |
0.516 (1.00) |
0.948 (1.00) |
1 (1.00) |
0.786 (1.00) |
0.119 (1.00) |
1 (1.00) |
| amp 11p13 | 30 (5%) | 535 |
0.963 (1.00) |
0.274 (1.00) |
1 (1.00) |
0.583 (1.00) |
0.496 (1.00) |
1 (1.00) |
0.762 (1.00) |
0.519 (1.00) |
| amp 12p13 32 | 83 (15%) | 482 |
0.878 (1.00) |
0.232 (1.00) |
0.904 (1.00) |
0.697 (1.00) |
0.877 (1.00) |
0.526 (1.00) |
0.506 (1.00) |
0.687 (1.00) |
| amp 12q14 1 | 132 (23%) | 433 |
0.303 (1.00) |
0.662 (1.00) |
0.417 (1.00) |
0.93 (1.00) |
0.506 (1.00) |
0.75 (1.00) |
0.762 (1.00) |
0.31 (1.00) |
| amp 12q15 | 92 (16%) | 473 |
0.76 (1.00) |
0.57 (1.00) |
0.353 (1.00) |
0.993 (1.00) |
0.942 (1.00) |
0.467 (1.00) |
0.632 (1.00) |
0.23 (1.00) |
| amp 13q34 | 32 (6%) | 533 |
0.854 (1.00) |
0.682 (1.00) |
0.36 (1.00) |
0.545 (1.00) |
0.36 (1.00) |
0.699 (1.00) |
0.885 (1.00) |
1 (1.00) |
| amp 13q34 | 30 (5%) | 535 |
0.852 (1.00) |
0.409 (1.00) |
0.568 (1.00) |
0.399 (1.00) |
0.5 (1.00) |
0.843 (1.00) |
0.39 (1.00) |
1 (1.00) |
| amp 14q32 33 | 36 (6%) | 529 |
0.451 (1.00) |
0.00547 (1.00) |
0.486 (1.00) |
0.316 (1.00) |
0.351 (1.00) |
0.856 (1.00) |
0.902 (1.00) |
1 (1.00) |
| amp 17p13 2 | 50 (9%) | 515 |
0.552 (1.00) |
0.61 (1.00) |
0.175 (1.00) |
0.939 (1.00) |
0.656 (1.00) |
0.636 (1.00) |
0.769 (1.00) |
1 (1.00) |
| amp 17q25 1 | 82 (15%) | 483 |
0.0314 (1.00) |
0.0122 (1.00) |
0.143 (1.00) |
0.46 (1.00) |
0.821 (1.00) |
0.61 (1.00) |
0.159 (1.00) |
0.691 (1.00) |
| amp 19p13 3 | 238 (42%) | 327 |
0.215 (1.00) |
0.61 (1.00) |
0.931 (1.00) |
0.151 (1.00) |
0.531 (1.00) |
1 (1.00) |
0.393 (1.00) |
0.571 (1.00) |
| amp 19p13 2 | 243 (43%) | 322 |
0.143 (1.00) |
0.948 (1.00) |
1 (1.00) |
0.516 (1.00) |
0.464 (1.00) |
0.928 (1.00) |
0.737 (1.00) |
0.77 (1.00) |
| amp 19q12 | 210 (37%) | 355 |
0.428 (1.00) |
0.612 (1.00) |
0.534 (1.00) |
0.939 (1.00) |
0.757 (1.00) |
0.853 (1.00) |
0.791 (1.00) |
0.383 (1.00) |
| amp 21q21 1 | 68 (12%) | 497 |
0.674 (1.00) |
0.0136 (1.00) |
1 (1.00) |
0.368 (1.00) |
0.24 (1.00) |
0.49 (1.00) |
0.0776 (1.00) |
0.377 (1.00) |
| del 1p36 32 | 96 (17%) | 469 |
0.977 (1.00) |
0.625 (1.00) |
0.0292 (1.00) |
0.64 (1.00) |
0.223 (1.00) |
0.812 (1.00) |
0.116 (1.00) |
0.7 (1.00) |
| del 1p36 23 | 129 (23%) | 436 |
0.507 (1.00) |
0.173 (1.00) |
0.0102 (1.00) |
0.0601 (1.00) |
0.077 (1.00) |
0.336 (1.00) |
0.126 (1.00) |
0.313 (1.00) |
| del 1p32 3 | 60 (11%) | 505 |
0.557 (1.00) |
0.0559 (1.00) |
0.126 (1.00) |
0.62 (1.00) |
0.711 (1.00) |
0.144 (1.00) |
0.296 (1.00) |
1 (1.00) |
| del 1p22 1 | 47 (8%) | 518 |
0.542 (1.00) |
0.362 (1.00) |
1 (1.00) |
0.353 (1.00) |
0.0909 (1.00) |
0.518 (1.00) |
0.912 (1.00) |
1 (1.00) |
| del 1q42 11 | 48 (8%) | 517 |
0.1 (1.00) |
0.372 (1.00) |
0.878 (1.00) |
0.0457 (1.00) |
1 (1.00) |
0.197 (1.00) |
0.508 (1.00) |
0.245 (1.00) |
| del 1q44 | 34 (6%) | 531 |
0.5 (1.00) |
0.324 (1.00) |
1 (1.00) |
0.309 (1.00) |
0.746 (1.00) |
0.71 (1.00) |
0.872 (1.00) |
0.478 (1.00) |
| del 2q22 1 | 46 (8%) | 519 |
0.352 (1.00) |
0.0953 (1.00) |
0.431 (1.00) |
0.593 (1.00) |
0.118 (1.00) |
0.0696 (1.00) |
0.284 (1.00) |
0.611 (1.00) |
| del 2q37 1 | 54 (10%) | 511 |
0.988 (1.00) |
0.743 (1.00) |
0.187 (1.00) |
0.632 (1.00) |
1 (1.00) |
0.29 (1.00) |
0.535 (1.00) |
1 (1.00) |
| del 3p21 1 | 52 (9%) | 513 |
0.0205 (1.00) |
0.025 (1.00) |
0.882 (1.00) |
0.78 (1.00) |
0.18 (1.00) |
0.0305 (1.00) |
0.613 (1.00) |
0.333 (1.00) |
| del 3q13 31 | 56 (10%) | 509 |
0.654 (1.00) |
0.394 (1.00) |
0.567 (1.00) |
0.239 (1.00) |
0.625 (1.00) |
0.231 (1.00) |
0.431 (1.00) |
0.352 (1.00) |
| del 3q22 1 | 58 (10%) | 507 |
0.657 (1.00) |
0.382 (1.00) |
1 (1.00) |
0.439 (1.00) |
0.637 (1.00) |
0.658 (1.00) |
0.252 (1.00) |
0.371 (1.00) |
| del 3q29 | 65 (12%) | 500 |
0.343 (1.00) |
0.563 (1.00) |
1 (1.00) |
0.325 (1.00) |
0.854 (1.00) |
0.263 (1.00) |
1 (1.00) |
1 (1.00) |
| del 4p16 3 | 76 (13%) | 489 |
0.489 (1.00) |
0.0892 (1.00) |
0.256 (1.00) |
0.358 (1.00) |
0.365 (1.00) |
0.0872 (1.00) |
0.573 (1.00) |
0.66 (1.00) |
| del 4q34 3 | 91 (16%) | 474 |
0.183 (1.00) |
0.112 (1.00) |
0.0462 (1.00) |
0.714 (1.00) |
0.835 (1.00) |
0.181 (1.00) |
0.167 (1.00) |
1 (1.00) |
| del 5q34 | 66 (12%) | 499 |
0.0433 (1.00) |
0.386 (1.00) |
0.182 (1.00) |
0.727 (1.00) |
0.787 (1.00) |
0.577 (1.00) |
0.15 (1.00) |
0.155 (1.00) |
| del 6q22 31 | 157 (28%) | 408 |
0.0561 (1.00) |
0.223 (1.00) |
0.0835 (1.00) |
0.546 (1.00) |
0.503 (1.00) |
1 (1.00) |
0.365 (1.00) |
0.193 (1.00) |
| del 6q26 | 178 (32%) | 387 |
0.101 (1.00) |
0.898 (1.00) |
0.196 (1.00) |
0.982 (1.00) |
0.23 (1.00) |
0.772 (1.00) |
0.749 (1.00) |
0.354 (1.00) |
| del 8p23 2 | 66 (12%) | 499 |
0.231 (1.00) |
0.0416 (1.00) |
0.286 (1.00) |
0.312 (1.00) |
0.785 (1.00) |
0.78 (1.00) |
0.0248 (1.00) |
0.376 (1.00) |
| del 9q34 2 | 76 (13%) | 489 |
0.998 (1.00) |
0.953 (1.00) |
1 (1.00) |
0.7 (1.00) |
0.315 (1.00) |
0.793 (1.00) |
0.623 (1.00) |
0.231 (1.00) |
| del 11p15 5 | 128 (23%) | 437 |
0.0222 (1.00) |
0.00886 (1.00) |
0.258 (1.00) |
0.204 (1.00) |
0.498 (1.00) |
0.749 (1.00) |
1 (1.00) |
1 (1.00) |
| del 11p11 2 | 104 (18%) | 461 |
0.0789 (1.00) |
0.794 (1.00) |
0.268 (1.00) |
0.624 (1.00) |
0.264 (1.00) |
0.817 (1.00) |
0.696 (1.00) |
1 (1.00) |
| del 11q14 1 | 96 (17%) | 469 |
0.97 (1.00) |
0.539 (1.00) |
0.359 (1.00) |
0.785 (1.00) |
0.44 (1.00) |
0.12 (1.00) |
1 (1.00) |
0.7 (1.00) |
| del 12p13 1 | 71 (13%) | 494 |
0.111 (1.00) |
0.991 (1.00) |
0.437 (1.00) |
0.405 (1.00) |
0.469 (1.00) |
0.282 (1.00) |
0.188 (1.00) |
1 (1.00) |
| del 12q12 | 74 (13%) | 491 |
0.475 (1.00) |
0.621 (1.00) |
0.8 (1.00) |
0.999 (1.00) |
0.595 (1.00) |
0.598 (1.00) |
0.308 (1.00) |
0.653 (1.00) |
| del 12q15 | 77 (14%) | 488 |
0.648 (1.00) |
0.521 (1.00) |
0.531 (1.00) |
0.292 (1.00) |
0.867 (1.00) |
0.299 (1.00) |
0.309 (1.00) |
0.207 (1.00) |
| del 13q14 2 | 237 (42%) | 328 |
0.936 (1.00) |
0.667 (1.00) |
0.601 (1.00) |
0.783 (1.00) |
0.514 (1.00) |
0.649 (1.00) |
0.461 (1.00) |
1 (1.00) |
| del 13q22 1 | 225 (40%) | 340 |
0.898 (1.00) |
0.873 (1.00) |
1 (1.00) |
0.252 (1.00) |
0.443 (1.00) |
0.41 (1.00) |
0.869 (1.00) |
0.378 (1.00) |
| del 14q13 1 | 174 (31%) | 391 |
0.563 (1.00) |
0.481 (1.00) |
0.113 (1.00) |
0.528 (1.00) |
0.449 (1.00) |
0.497 (1.00) |
0.265 (1.00) |
0.119 (1.00) |
| del 14q24 2 | 170 (30%) | 395 |
0.787 (1.00) |
0.597 (1.00) |
0.26 (1.00) |
0.834 (1.00) |
0.334 (1.00) |
0.434 (1.00) |
0.632 (1.00) |
1 (1.00) |
| del 15q14 | 148 (26%) | 417 |
0.287 (1.00) |
0.0242 (1.00) |
0.696 (1.00) |
0.969 (1.00) |
0.686 (1.00) |
0.475 (1.00) |
0.165 (1.00) |
0.323 (1.00) |
| del 16p12 2 | 92 (16%) | 473 |
0.0534 (1.00) |
0.211 (1.00) |
0.353 (1.00) |
0.527 (1.00) |
0.517 (1.00) |
0.333 (1.00) |
0.668 (1.00) |
1 (1.00) |
| del 16q23 1 | 99 (18%) | 466 |
0.0103 (1.00) |
0.746 (1.00) |
0.821 (1.00) |
0.151 (1.00) |
0.844 (1.00) |
0.0248 (1.00) |
0.421 (1.00) |
0.703 (1.00) |
| del 17p13 2 | 84 (15%) | 481 |
0.831 (1.00) |
0.656 (1.00) |
0.229 (1.00) |
0.309 (1.00) |
1 (1.00) |
0.706 (1.00) |
0.766 (1.00) |
1 (1.00) |
| del 17p13 1 | 94 (17%) | 471 |
0.373 (1.00) |
0.128 (1.00) |
0.0652 (1.00) |
0.995 (1.00) |
0.744 (1.00) |
0.228 (1.00) |
0.952 (1.00) |
1 (1.00) |
| del 17q11 2 | 69 (12%) | 496 |
0.322 (1.00) |
0.616 (1.00) |
0.794 (1.00) |
0.388 (1.00) |
1 (1.00) |
0.0764 (1.00) |
0.77 (1.00) |
1 (1.00) |
| del 18q22 3 | 81 (14%) | 484 |
0.587 (1.00) |
0.59 (1.00) |
0.902 (1.00) |
0.17 (1.00) |
0.818 (1.00) |
0.702 (1.00) |
0.405 (1.00) |
0.399 (1.00) |
| del 19q13 41 | 99 (18%) | 466 |
0.0399 (1.00) |
0.469 (1.00) |
0.821 (1.00) |
0.574 (1.00) |
0.757 (1.00) |
0.723 (1.00) |
0.383 (1.00) |
1 (1.00) |
| del 21q21 1 | 55 (10%) | 510 |
0.92 (1.00) |
0.537 (1.00) |
1 (1.00) |
0.573 (1.00) |
1 (1.00) |
0.228 (1.00) |
0.854 (1.00) |
0.362 (1.00) |
| del 22q13 32 | 211 (37%) | 354 |
0.971 (1.00) |
0.185 (1.00) |
0.859 (1.00) |
0.466 (1.00) |
0.903 (1.00) |
0.711 (1.00) |
0.294 (1.00) |
1 (1.00) |
| del xp22 2 | 116 (21%) | 449 |
0.32 (1.00) |
0.591 (1.00) |
0.916 (1.00) |
0.372 (1.00) |
0.952 (1.00) |
0.912 (1.00) |
0.605 (1.00) |
0.474 (1.00) |
P value = 4.56e-07 (logrank test), Q value = 0.00026
Table S1. Gene #8: 'amp_7p11.2' versus Clinical Feature #1: 'Time to Death'
| nPatients | nDeath | Duration Range (Median), Month | |
|---|---|---|---|
| ALL | 565 | 462 | 0.1 - 127.6 (10.0) |
| AMP PEAK 8(7P11.2) MUTATED | 496 | 414 | 0.1 - 127.6 (9.5) |
| AMP PEAK 8(7P11.2) WILD-TYPE | 69 | 48 | 0.2 - 108.8 (14.9) |
Figure S1. Get High-res Image Gene #8: 'amp_7p11.2' versus Clinical Feature #1: 'Time to Death'
P value = 2.67e-12 (Wilcoxon-test), Q value = 1.5e-09
Table S2. Gene #8: 'amp_7p11.2' versus Clinical Feature #2: 'AGE'
| nPatients | Mean (Std.Dev) | |
|---|---|---|
| ALL | 565 | 57.8 (14.5) |
| AMP PEAK 8(7P11.2) MUTATED | 496 | 59.8 (12.5) |
| AMP PEAK 8(7P11.2) WILD-TYPE | 69 | 43.2 (18.9) |
Figure S2. Get High-res Image Gene #8: 'amp_7p11.2' versus Clinical Feature #2: 'AGE'
P value = 3.98e-05 (logrank test), Q value = 0.022
Table S3. Gene #9: 'amp_7q11.21' versus Clinical Feature #1: 'Time to Death'
| nPatients | nDeath | Duration Range (Median), Month | |
|---|---|---|---|
| ALL | 565 | 462 | 0.1 - 127.6 (10.0) |
| AMP PEAK 9(7Q11.21) MUTATED | 454 | 376 | 0.1 - 127.6 (9.4) |
| AMP PEAK 9(7Q11.21) WILD-TYPE | 111 | 86 | 0.2 - 108.8 (13.6) |
Figure S3. Get High-res Image Gene #9: 'amp_7q11.21' versus Clinical Feature #1: 'Time to Death'
P value = 2.11e-07 (Wilcoxon-test), Q value = 0.00012
Table S4. Gene #9: 'amp_7q11.21' versus Clinical Feature #2: 'AGE'
| nPatients | Mean (Std.Dev) | |
|---|---|---|
| ALL | 565 | 57.8 (14.5) |
| AMP PEAK 9(7Q11.21) MUTATED | 454 | 59.8 (12.5) |
| AMP PEAK 9(7Q11.21) WILD-TYPE | 111 | 49.3 (18.7) |
Figure S4. Get High-res Image Gene #9: 'amp_7q11.21' versus Clinical Feature #2: 'AGE'
P value = 7.5e-06 (Wilcoxon-test), Q value = 0.0042
Table S5. Gene #10: 'amp_7q21.2' versus Clinical Feature #2: 'AGE'
| nPatients | Mean (Std.Dev) | |
|---|---|---|
| ALL | 565 | 57.8 (14.5) |
| AMP PEAK 10(7Q21.2) MUTATED | 469 | 59.5 (12.5) |
| AMP PEAK 10(7Q21.2) WILD-TYPE | 96 | 49.4 (19.9) |
Figure S5. Get High-res Image Gene #10: 'amp_7q21.2' versus Clinical Feature #2: 'AGE'
P value = 5.87e-05 (Wilcoxon-test), Q value = 0.033
Table S6. Gene #44: 'del_9p21.3' versus Clinical Feature #2: 'AGE'
| nPatients | Mean (Std.Dev) | |
|---|---|---|
| ALL | 565 | 57.8 (14.5) |
| DEL PEAK 19(9P21.3) MUTATED | 412 | 59.2 (13.8) |
| DEL PEAK 19(9P21.3) WILD-TYPE | 153 | 53.9 (15.7) |
Figure S6. Get High-res Image Gene #44: 'del_9p21.3' versus Clinical Feature #2: 'AGE'
P value = 3.74e-06 (logrank test), Q value = 0.0021
Table S7. Gene #46: 'del_10p15.3' versus Clinical Feature #1: 'Time to Death'
| nPatients | nDeath | Duration Range (Median), Month | |
|---|---|---|---|
| ALL | 565 | 462 | 0.1 - 127.6 (10.0) |
| DEL PEAK 21(10P15.3) MUTATED | 459 | 383 | 0.1 - 92.7 (9.9) |
| DEL PEAK 21(10P15.3) WILD-TYPE | 106 | 79 | 0.1 - 127.6 (11.7) |
Figure S7. Get High-res Image Gene #46: 'del_10p15.3' versus Clinical Feature #1: 'Time to Death'
P value = 2.35e-08 (Wilcoxon-test), Q value = 1.3e-05
Table S8. Gene #46: 'del_10p15.3' versus Clinical Feature #2: 'AGE'
| nPatients | Mean (Std.Dev) | |
|---|---|---|
| ALL | 565 | 57.8 (14.5) |
| DEL PEAK 21(10P15.3) MUTATED | 459 | 59.8 (12.6) |
| DEL PEAK 21(10P15.3) WILD-TYPE | 106 | 49.0 (18.5) |
Figure S8. Get High-res Image Gene #46: 'del_10p15.3' versus Clinical Feature #2: 'AGE'
P value = 2.36e-06 (logrank test), Q value = 0.0013
Table S9. Gene #47: 'del_10p13' versus Clinical Feature #1: 'Time to Death'
| nPatients | nDeath | Duration Range (Median), Month | |
|---|---|---|---|
| ALL | 565 | 462 | 0.1 - 127.6 (10.0) |
| DEL PEAK 22(10P13) MUTATED | 460 | 384 | 0.1 - 92.7 (9.9) |
| DEL PEAK 22(10P13) WILD-TYPE | 105 | 78 | 0.1 - 127.6 (11.5) |
Figure S9. Get High-res Image Gene #47: 'del_10p13' versus Clinical Feature #1: 'Time to Death'
P value = 4.88e-08 (Wilcoxon-test), Q value = 2.8e-05
Table S10. Gene #47: 'del_10p13' versus Clinical Feature #2: 'AGE'
| nPatients | Mean (Std.Dev) | |
|---|---|---|
| ALL | 565 | 57.8 (14.5) |
| DEL PEAK 22(10P13) MUTATED | 460 | 59.8 (12.4) |
| DEL PEAK 22(10P13) WILD-TYPE | 105 | 48.9 (19.1) |
Figure S10. Get High-res Image Gene #47: 'del_10p13' versus Clinical Feature #2: 'AGE'
P value = 1.07e-07 (logrank test), Q value = 6.1e-05
Table S11. Gene #48: 'del_10p11.23' versus Clinical Feature #1: 'Time to Death'
| nPatients | nDeath | Duration Range (Median), Month | |
|---|---|---|---|
| ALL | 565 | 462 | 0.1 - 127.6 (10.0) |
| DEL PEAK 23(10P11.23) MUTATED | 465 | 388 | 0.1 - 92.7 (9.7) |
| DEL PEAK 23(10P11.23) WILD-TYPE | 100 | 74 | 0.1 - 127.6 (12.8) |
Figure S11. Get High-res Image Gene #48: 'del_10p11.23' versus Clinical Feature #1: 'Time to Death'
P value = 1.79e-10 (Wilcoxon-test), Q value = 1e-07
Table S12. Gene #48: 'del_10p11.23' versus Clinical Feature #2: 'AGE'
| nPatients | Mean (Std.Dev) | |
|---|---|---|
| ALL | 565 | 57.8 (14.5) |
| DEL PEAK 23(10P11.23) MUTATED | 465 | 60.0 (12.3) |
| DEL PEAK 23(10P11.23) WILD-TYPE | 100 | 47.5 (18.8) |
Figure S12. Get High-res Image Gene #48: 'del_10p11.23' versus Clinical Feature #2: 'AGE'
P value = 1.69e-05 (logrank test), Q value = 0.0094
Table S13. Gene #49: 'del_10q23.31' versus Clinical Feature #1: 'Time to Death'
| nPatients | nDeath | Duration Range (Median), Month | |
|---|---|---|---|
| ALL | 565 | 462 | 0.1 - 127.6 (10.0) |
| DEL PEAK 24(10Q23.31) MUTATED | 502 | 416 | 0.1 - 127.6 (9.9) |
| DEL PEAK 24(10Q23.31) WILD-TYPE | 63 | 46 | 0.2 - 108.8 (12.7) |
Figure S13. Get High-res Image Gene #49: 'del_10q23.31' versus Clinical Feature #1: 'Time to Death'
P value = 2.12e-07 (Wilcoxon-test), Q value = 0.00012
Table S14. Gene #49: 'del_10q23.31' versus Clinical Feature #2: 'AGE'
| nPatients | Mean (Std.Dev) | |
|---|---|---|
| ALL | 565 | 57.8 (14.5) |
| DEL PEAK 24(10Q23.31) MUTATED | 502 | 59.1 (13.3) |
| DEL PEAK 24(10Q23.31) WILD-TYPE | 63 | 47.2 (18.6) |
Figure S14. Get High-res Image Gene #49: 'del_10q23.31' versus Clinical Feature #2: 'AGE'
P value = 8.56e-06 (Wilcoxon-test), Q value = 0.0048
Table S15. Gene #50: 'del_10q26.3' versus Clinical Feature #2: 'AGE'
| nPatients | Mean (Std.Dev) | |
|---|---|---|
| ALL | 565 | 57.8 (14.5) |
| DEL PEAK 25(10Q26.3) MUTATED | 503 | 58.9 (13.5) |
| DEL PEAK 25(10Q26.3) WILD-TYPE | 62 | 48.3 (18.7) |
Figure S15. Get High-res Image Gene #50: 'del_10q26.3' versus Clinical Feature #2: 'AGE'
-
Copy number data file = transformed.cor.cli.txt
-
Clinical data file = GBM-TP.merged_data.txt
-
Number of patients = 565
-
Number of significantly focal cnvs = 71
-
Number of selected clinical features = 8
-
Exclude genes that fewer than K tumors have mutations, K = 3
For survival clinical features, the Kaplan-Meier survival curves of tumors with and without gene mutations were plotted and the statistical significance P values were estimated by logrank test (Bland and Altman 2004) using the 'survdiff' function in R
For binary or multi-class clinical features (nominal or ordinal), two-tailed Fisher's exact tests (Fisher 1922) were used to estimate the P values using the 'fisher.test' function in R
For multiple hypothesis correction, Q value is the False Discovery Rate (FDR) analogue of the P value (Benjamini and Hochberg 1995), defined as the minimum FDR at which the test may be called significant. We used the 'Benjamini and Hochberg' method of 'p.adjust' function in R to convert P values into Q values.
In addition to the links below, the full results of the analysis summarized in this report can also be downloaded programmatically using firehose_get, or interactively from either the Broad GDAC website or TCGA Data Coordination Center Portal.