This report serves to describe the mutational landscape and properties of a given individual set, as well as rank genes and genesets according to mutational significance. MutSig v1.5 was used to generate the results found in this report.
-
Working with individual set: LAML-TB
-
Number of patients in set: 197
The input for this pipeline is a set of individuals with the following files associated for each:
-
An annotated .maf file describing the mutations called for the respective individual, and their properties.
-
A .wig file that contains information about the coverage of the sample.
-
MAF used for this analysis:LAML-TB.final_analysis_set.maf
-
Blacklist used for this analysis: pancan_mutation_blacklist.v14.hg19.txt
-
Significantly mutated genes (q ≤ 0.1): 28
-
Mutations seen in COSMIC: 238
-
Significantly mutated genes in COSMIC territory: 19
-
Significantly mutated genesets: 64
-
Significantly mutated genesets: (excluding sig. mutated genes):0
-
Read 197 MAFs of type "WashU"
-
Total number of mutations in input MAFs: 2585
-
After removing 41 mutations outside chr1-24: 2544
-
After removing 1 blacklisted mutations: 2543
-
After removing 104 noncoding mutations: 2439
-
Number of mutations before filtering: 2439
-
After removing 204 mutations outside gene set: 2235
-
After removing 14 mutations outside category set: 2221
-
After removing 1 "impossible" mutations in
-
gene-patient-category bins of zero coverage: 2002
Table 1. Get Full Table Table representing breakdown of mutations by type.
| type | count |
|---|---|
| Frame_Shift_Del | 51 |
| Frame_Shift_Ins | 110 |
| In_Frame_Del | 8 |
| In_Frame_Ins | 43 |
| Missense_Mutation | 1400 |
| Nonsense_Mutation | 108 |
| Silent | 451 |
| Splice_Site | 50 |
| Total | 2221 |
Table 2. Get Full Table A breakdown of mutation rates per category discovered for this individual set.
| category | n | N | rate | rate_per_mb | relative_rate | exp_ns_s_ratio |
|---|---|---|---|---|---|---|
| *CpG->T | 508 | 272168305 | 1.9e-06 | 1.9 | 5.8 | 2.2 |
| *Cp(A/C/T)->T | 312 | 2466260336 | 1.3e-07 | 0.13 | 0.39 | 1.7 |
| A->G | 182 | 2743656430 | 6.6e-08 | 0.066 | 0.21 | 2.3 |
| transver | 398 | 5482085071 | 7.3e-08 | 0.073 | 0.22 | 5.1 |
| indel+null | 357 | 5482085071 | 6.5e-08 | 0.065 | 0.2 | NaN |
| double_null | 13 | 5482085071 | 2.4e-09 | 0.0024 | 0.0073 | NaN |
| Total | 1770 | 5482085071 | 3.2e-07 | 0.32 | 1 | 3.5 |
The x axis represents the samples. The y axis represents the exons, one row per exon, and they are sorted by average coverage across samples. For exons with exactly the same average coverage, they are sorted next by the %GC of the exon. (The secondary sort is especially useful for the zero-coverage exons at the bottom). If the figure is unpopulated, then full coverage is assumed (e.g. MutSig CV doesn't use WIGs and assumes full coverage).
Figure 1.
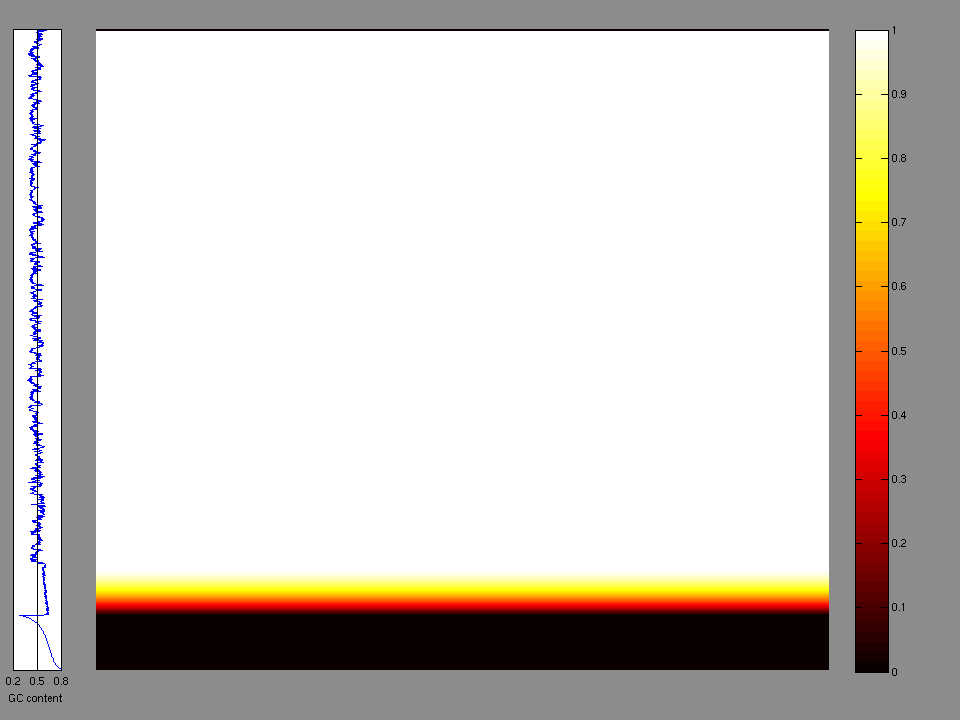
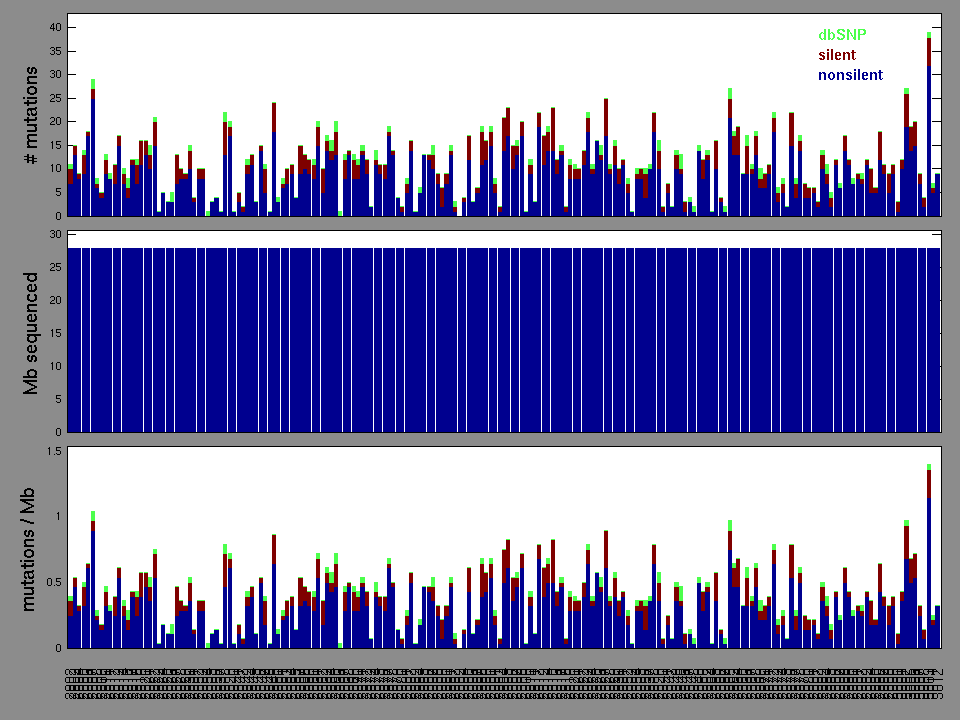
Figure 2. Patients counts and rates file used to generate this plot: LAML-TB.patients.counts_and_rates.txt
The mutation spectrum is depicted in the lego plots below in which the 96 possible mutation types are subdivided into six large blocks, color-coded to reflect the base substitution type. Each large block is further subdivided into the 16 possible pairs of 5' and 3' neighbors, as listed in the 4x4 trinucleotide context legend. The height of each block corresponds to the mutation frequency for that kind of mutation (counts of mutations normalized by the base coverage in a given bin). The shape of the spectrum is a signature for dominant mutational mechanisms in different tumor types.
Figure 3. Get High-res Image SNV Mutation rate lego plot for entire set. Each bin is normalized by base coverage for that bin. Colors represent the six SNV types on the upper right. The three-base context for each mutation is labeled in the 4x4 legend on the lower right. The fractional breakdown of SNV counts is shown in the pie chart on the upper left. If this figure is blank, not enough information was provided in the MAF to generate it.
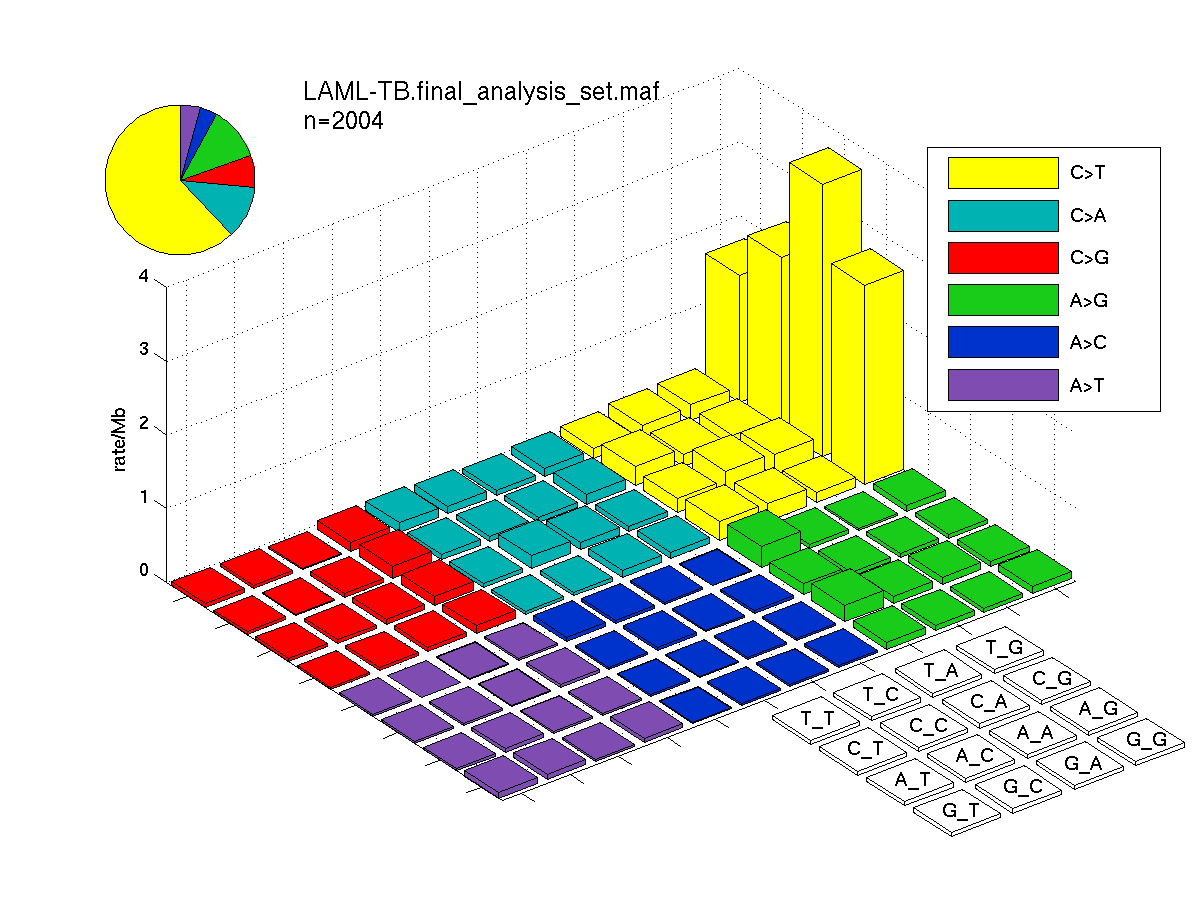
Figure 4. Get High-res Image SNV Mutation rate lego plots for 4 slices of mutation allele fraction (0<=AF<0.1, 0.1<=AF<0.25, 0.25<=AF<0.5, & 0.5<=AF) . The color code and three-base context legends are the same as the previous figure. If this figure is blank, not enough information was provided in the MAF to generate it.

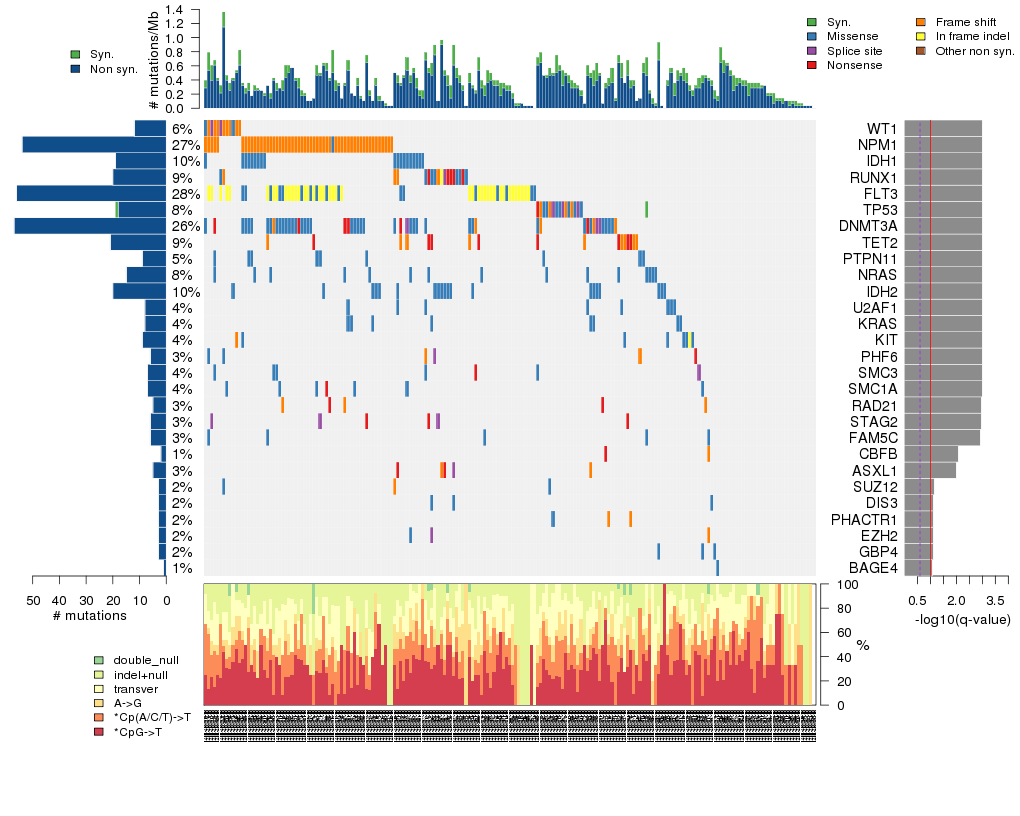
Figure 5. Get High-res Image The matrix in the center of the figure represents individual mutations in patient samples, color-coded by type of mutation, for the significantly mutated genes. The rate of synonymous and non-synonymous mutations is displayed at the top of the matrix. The barplot on the left of the matrix shows the number of mutations in each gene. The percentages represent the fraction of tumors with at least one mutation in the specified gene. The barplot to the right of the matrix displays the q-values for the most significantly mutated genes. The purple boxplots below the matrix (only displayed if required columns are present in the provided MAF) represent the distributions of allelic fractions observed in each sample. The plot at the bottom represents the base substitution distribution of individual samples, using the same categories that were used to calculate significance.
Column Descriptions:
-
N = number of sequenced bases in this gene across the individual set
-
n = number of (nonsilent) mutations in this gene across the individual set
-
npat = number of patients (individuals) with at least one nonsilent mutation
-
nsite = number of unique sites having a non-silent mutation
-
nsil = number of silent mutations in this gene across the individual set
-
n1 = number of nonsilent mutations of type: *CpG->T
-
n2 = number of nonsilent mutations of type: *Cp(A/C/T)->T
-
n3 = number of nonsilent mutations of type: A->G
-
n4 = number of nonsilent mutations of type: transver
-
n5 = number of nonsilent mutations of type: indel+null
-
n6 = number of nonsilent mutations of type: double_null
-
p_ns_s = p-value for the observed nonsilent/silent ratio being elevated in this gene
-
p = p-value (overall)
-
q = q-value, False Discovery Rate (Benjamini-Hochberg procedure)
Table 3. Get Full Table A Ranked List of Significantly Mutated Genes. Number of significant genes found: 28. Number of genes displayed: 35. Click on a gene name to display its stick figure depicting the distribution of mutations and mutation types across the chosen gene (this feature may not be available for all significant genes).
| rank | gene | description | N | n | npat | nsite | nsil | n1 | n2 | n3 | n4 | n5 | n6 | p_ns_s | p | q |
|---|---|---|---|---|---|---|---|---|---|---|---|---|---|---|---|---|
| 1 | WT1 | Wilms tumor 1 | 164692 | 12 | 12 | 10 | 0 | 1 | 1 | 0 | 0 | 9 | 1 | 0.23 | <1.00e-15 | <8.32e-12 |
| 2 | NPM1 | nucleophosmin (nucleolar phosphoprotein B23, numatrin) | 183407 | 54 | 54 | 7 | 0 | 0 | 0 | 1 | 0 | 52 | 1 | 0.63 | 1.11e-15 | 8.32e-12 |
| 3 | IDH1 | isocitrate dehydrogenase 1 (NADP+), soluble | 251569 | 19 | 19 | 2 | 0 | 17 | 0 | 0 | 2 | 0 | 0 | 0.0015 | 1.44e-15 | 8.32e-12 |
| 4 | RUNX1 | runt-related transcription factor 1 (acute myeloid leukemia 1; aml1 oncogene) | 145189 | 20 | 18 | 16 | 0 | 2 | 3 | 2 | 2 | 10 | 1 | 0.0061 | 2.55e-15 | 9.61e-12 |
| 5 | FLT3 | fms-related tyrosine kinase 3 | 597107 | 56 | 56 | 30 | 0 | 0 | 0 | 1 | 16 | 39 | 0 | 0.053 | 3.22e-15 | 9.61e-12 |
| 6 | TP53 | tumor protein p53 | 258267 | 18 | 15 | 18 | 1 | 3 | 2 | 3 | 2 | 8 | 0 | 0.032 | 3.33e-15 | 9.61e-12 |
| 7 | DNMT3A | DNA (cytosine-5-)-methyltransferase 3 alpha | 512791 | 57 | 51 | 29 | 0 | 34 | 2 | 3 | 4 | 14 | 0 | 6e-09 | 4.11e-15 | 1.02e-11 |
| 8 | TET2 | tet oncogene family member 2 | 689894 | 21 | 17 | 20 | 0 | 0 | 2 | 0 | 2 | 11 | 6 | 0.02 | 7.33e-15 | 1.43e-11 |
| 9 | PTPN11 | protein tyrosine phosphatase, non-receptor type 11 (Noonan syndrome 1) | 359328 | 9 | 9 | 9 | 0 | 0 | 3 | 2 | 4 | 0 | 0 | 0.075 | 7.44e-15 | 1.43e-11 |
| 10 | NRAS | neuroblastoma RAS viral (v-ras) oncogene homolog | 115442 | 15 | 15 | 6 | 0 | 0 | 8 | 1 | 6 | 0 | 0 | 0.0096 | 9.33e-15 | 1.61e-11 |
| 11 | IDH2 | isocitrate dehydrogenase 2 (NADP+), mitochondrial | 230293 | 20 | 20 | 2 | 0 | 16 | 3 | 0 | 1 | 0 | 0 | 0.00013 | 1.03e-14 | 1.62e-11 |
| 12 | U2AF1 | U2 small nuclear RNA auxiliary factor 1 | 153266 | 8 | 8 | 2 | 0 | 0 | 5 | 0 | 3 | 0 | 0 | 0.054 | 1.25e-14 | 1.81e-11 |
| 13 | KRAS | v-Ki-ras2 Kirsten rat sarcoma viral oncogene homolog | 139279 | 8 | 8 | 6 | 0 | 0 | 4 | 1 | 3 | 0 | 0 | 0.12 | 1.84e-14 | 2.45e-11 |
| 14 | KIT | v-kit Hardy-Zuckerman 4 feline sarcoma viral oncogene homolog | 585287 | 9 | 8 | 5 | 0 | 1 | 0 | 0 | 6 | 1 | 1 | 0.22 | 1.02e-11 | 1.26e-08 |
| 15 | PHF6 | PHD finger protein 6 | 244083 | 6 | 6 | 6 | 0 | 0 | 1 | 0 | 1 | 4 | 0 | 0.49 | 4.19e-11 | 4.83e-08 |
| 16 | SMC3 | structural maintenance of chromosomes 3 | 738947 | 7 | 7 | 7 | 0 | 1 | 1 | 1 | 2 | 2 | 0 | 0.17 | 1.54e-09 | 1.67e-06 |
| 17 | SMC1A | structural maintenance of chromosomes 1A | 744857 | 7 | 7 | 7 | 0 | 3 | 0 | 1 | 2 | 1 | 0 | 0.32 | 4.86e-09 | 4.95e-06 |
| 18 | RAD21 | RAD21 homolog (S. pombe) | 383756 | 5 | 5 | 5 | 0 | 0 | 0 | 0 | 0 | 5 | 0 | 0.74 | 6.36e-08 | 6.12e-05 |
| 19 | STAG2 | stromal antigen 2 | 775983 | 6 | 6 | 6 | 0 | 0 | 0 | 0 | 0 | 6 | 0 | 0.19 | 8.05e-08 | 7.33e-05 |
| 20 | FAM5C | family with sequence similarity 5, member C | 458813 | 6 | 5 | 6 | 0 | 4 | 1 | 0 | 1 | 0 | 0 | 0.18 | 2.24e-07 | 0.000194 |
| 21 | CBFB | core-binding factor, beta subunit | 87862 | 2 | 2 | 2 | 0 | 0 | 0 | 0 | 0 | 2 | 0 | 0.85 | 8.69e-06 | 0.00716 |
| 22 | ASXL1 | additional sex combs like 1 (Drosophila) | 903245 | 5 | 5 | 5 | 0 | 0 | 0 | 0 | 0 | 5 | 0 | 0.38 | 1.14e-05 | 0.00897 |
| 23 | SUZ12 | suppressor of zeste 12 homolog (Drosophila) | 395182 | 3 | 3 | 3 | 0 | 1 | 1 | 0 | 0 | 1 | 0 | 0.62 | 8.86e-05 | 0.0667 |
| 24 | DIS3 | DIS3 mitotic control homolog (S. cerevisiae) | 537613 | 3 | 3 | 3 | 0 | 1 | 1 | 1 | 0 | 0 | 0 | 0.36 | 0.000104 | 0.0745 |
| 25 | PHACTR1 | phosphatase and actin regulator 1 | 323868 | 3 | 3 | 2 | 0 | 0 | 0 | 0 | 1 | 2 | 0 | 0.84 | 0.000111 | 0.0745 |
| 26 | EZH2 | enhancer of zeste homolog 2 (Drosophila) | 459010 | 3 | 3 | 3 | 0 | 1 | 0 | 0 | 0 | 1 | 1 | 0.53 | 0.000114 | 0.0745 |
| 27 | GBP4 | guanylate binding protein 4 | 387499 | 3 | 3 | 3 | 0 | 0 | 2 | 0 | 1 | 0 | 0 | 0.31 | 0.000116 | 0.0745 |
| 28 | BAGE4 | B melanoma antigen family, member 4 | 24822 | 1 | 1 | 1 | 0 | 1 | 0 | 0 | 0 | 0 | 0 | 0.5 | 0.000133 | 0.0823 |
| 29 | CALR | calreticulin | 218670 | 2 | 2 | 2 | 0 | 0 | 0 | 0 | 0 | 2 | 0 | 1 | 0.000187 | 0.111 |
| 30 | CLEC18B | C-type lectin domain family 18, member B | 209805 | 2 | 2 | 1 | 0 | 0 | 0 | 2 | 0 | 0 | 0 | 0.66 | 0.000232 | 0.134 |
| 31 | FAM57B | family with sequence similarity 57, member B | 77618 | 2 | 2 | 2 | 0 | 1 | 0 | 0 | 0 | 1 | 0 | 0.35 | 0.000248 | 0.139 |
| 32 | ABTB1 | ankyrin repeat and BTB (POZ) domain containing 1 | 176512 | 2 | 2 | 1 | 0 | 0 | 0 | 0 | 0 | 2 | 0 | 1 | 0.000301 | 0.156 |
| 33 | KCNK13 | potassium channel, subfamily K, member 13 | 176709 | 2 | 2 | 2 | 0 | 0 | 0 | 0 | 1 | 1 | 0 | 0.83 | 0.000304 | 0.156 |
| 34 | GRIK2 | glutamate receptor, ionotropic, kainate 2 | 560071 | 3 | 3 | 3 | 0 | 1 | 1 | 1 | 0 | 0 | 0 | 0.33 | 0.000307 | 0.156 |
| 35 | MTA2 | metastasis associated 1 family, member 2 | 403259 | 2 | 2 | 2 | 0 | 0 | 0 | 2 | 0 | 0 | 0 | 0.49 | 0.000345 | 0.171 |
In this analysis, COSMIC is used as a filter to increase power by restricting the territory of each gene. Cosmic version: v48.
Table 4. Get Full Table Significantly mutated genes (COSMIC territory only). To access the database please go to: COSMIC. Number of significant genes found: 19. Number of genes displayed: 10
| rank | gene | description | n | cos | n_cos | N_cos | cos_ev | p | q |
|---|---|---|---|---|---|---|---|---|---|
| 1 | TP53 | tumor protein p53 | 18 | 824 | 16 | 162328 | 3427 | 0 | 0 |
| 2 | IDH1 | isocitrate dehydrogenase 1 (NADP+), soluble | 19 | 5 | 19 | 985 | 28348 | 3.7e-14 | 6.4e-11 |
| 3 | IDH2 | isocitrate dehydrogenase 2 (NADP+), mitochondrial | 20 | 6 | 20 | 1182 | 2000 | 4.4e-14 | 6.4e-11 |
| 4 | PTPN11 | protein tyrosine phosphatase, non-receptor type 11 (Noonan syndrome 1) | 9 | 32 | 8 | 6304 | 216 | 2.3e-13 | 2.1e-10 |
| 5 | NRAS | neuroblastoma RAS viral (v-ras) oncogene homolog | 15 | 33 | 15 | 6501 | 11840 | 2.4e-13 | 2.1e-10 |
| 6 | NPM1 | nucleophosmin (nucleolar phosphoprotein B23, numatrin) | 54 | 41 | 53 | 8077 | 112668 | 3e-13 | 2.2e-10 |
| 7 | KRAS | v-Ki-ras2 Kirsten rat sarcoma viral oncogene homolog | 8 | 52 | 7 | 10244 | 46308 | 3.8e-13 | 2.4e-10 |
| 8 | FLT3 | fms-related tyrosine kinase 3 | 56 | 124 | 52 | 24428 | 6301 | 9e-13 | 4.9e-10 |
| 9 | RUNX1 | runt-related transcription factor 1 (acute myeloid leukemia 1; aml1 oncogene) | 20 | 178 | 18 | 35066 | 93 | 1.3e-12 | 5.9e-10 |
| 10 | WT1 | Wilms tumor 1 | 12 | 185 | 9 | 36445 | 444 | 1.3e-12 | 5.9e-10 |
Note:
n - number of (nonsilent) mutations in this gene across the individual set.
cos = number of unique mutated sites in this gene in COSMIC
n_cos = overlap between n and cos.
N_cos = number of individuals times cos.
cos_ev = total evidence: number of reports in COSMIC for mutations seen in this gene.
p = p-value for seeing the observed amount of overlap in this gene)
q = q-value, False Discovery Rate (Benjamini-Hochberg procedure)
Table 5. Get Full Table A Ranked List of Significantly Mutated Genesets. (Source: MSigDB GSEA Cannonical Pathway Set).Number of significant genesets found: 64. Number of genesets displayed: 10
| rank | geneset | description | genes | N_genes | mut_tally | N | n | npat | nsite | nsil | n1 | n2 | n3 | n4 | n5 | n6 | p_ns_s | p | q |
|---|---|---|---|---|---|---|---|---|---|---|---|---|---|---|---|---|---|---|---|
| 1 | GLUTATHIONE_METABOLISM | ANPEP, G6PD, GCLC, GCLM, GGT1, GPX1, GPX2, GPX3, GPX4, GPX5, GSS, GSTA1, GSTA2, GSTA3, GSTA4, GSTM1, GSTM2, GSTM3, GSTM4, GSTM5, GSTO2, GSTP1, GSTT1, GSTT2, GSTZ1, IDH1, IDH2, MGST1, MGST2, MGST3, PGD | 29 | GCLM(1), GPX2(1), GSTM3(1), IDH1(19), IDH2(20) | 5170462 | 42 | 40 | 7 | 0 | 33 | 4 | 0 | 5 | 0 | 0 | 1.7e-07 | 2e-15 | 3.1e-13 | |
| 2 | ERYTHPATHWAY | Erythropoietin selectively stimulates erythrocyte differentiation from CFU-GEMM cells in bone marrow. | CCL3, CSF2, CSF3, EPO, FLT3, IGF1, IL11, IL1A, IL3, IL6, IL9, KITLG, TGFB1, TGFB2, TGFB3 | 14 | FLT3(56) | 2377790 | 56 | 56 | 30 | 0 | 0 | 0 | 1 | 16 | 39 | 0 | 0.048 | 2.2e-15 | 3.1e-13 |
| 3 | HSA00271_METHIONINE_METABOLISM | Genes involved in methionine metabolism | AHCY, AMD1, BHMT, CBS, CTH, DNMT1, DNMT3A, DNMT3B, KIAA0828, MARS, MARS2, MAT1A, MAT2B, MTAP, MTFMT, MTR, SRM, TAT | 17 | DNMT1(1), DNMT3A(57), DNMT3B(1), MAT1A(1) | 5703150 | 60 | 53 | 32 | 0 | 36 | 2 | 3 | 5 | 14 | 0 | 1.2e-09 | 2.8e-15 | 3.1e-13 |
| 4 | HSA04640_HEMATOPOIETIC_CELL_LINEAGE | Genes involved in hematopoietic cell lineage | ANPEP, CD14, CD19, CD1A, CD1B, CD1C, CD1D, CD1E, CD2, CD22, CD24, CD33, CD34, CD36, CD37, CD38, CD3D, CD3E, CD3G, CD4, CD44, CD5, CD55, CD59, CD7, CD8A, CD8B, CD9, CR1, CR2, CSF1, CSF1R, CSF2, CSF2RA, CSF3, CSF3R, DNTT, EPO, EPOR, FCER2, FCGR1A, FLT3, FLT3LG, GP1BA, GP1BB, GP5, GP9, GYPA, HLA-DRA, HLA-DRB1, HLA-DRB3, HLA-DRB4, HLA-DRB5, IL11, IL11RA, IL1A, IL1B, IL1R1, IL1R2, IL2RA, IL3, IL3RA, IL4, IL4R, IL5, IL5RA, IL6, IL6R, IL7, IL7R, IL9R, ITGA1, ITGA2, ITGA2B, ITGA3, ITGA4, ITGA5, ITGA6, ITGAM, ITGB3, KIT, KITLG, MME, MS4A1, TFRC, THPO, TNF, TPO | 82 | CR1(1), CSF3R(1), FLT3(56), HLA-DRB1(1), IL1R1(1), KIT(9), TPO(1) | 23610450 | 70 | 68 | 40 | 1 | 2 | 2 | 1 | 24 | 40 | 1 | 0.0088 | 3.8e-15 | 3.1e-13 |
| 5 | HSA00480_GLUTATHIONE_METABOLISM | Genes involved in glutathione metabolism | ANPEP, G6PD, GCLC, GCLM, GGT1, GGTL3, GGTL4, GPX1, GPX2, GPX3, GPX4, GPX5, GPX6, GPX7, GSR, GSS, GSTA1, GSTA2, GSTA3, GSTA4, GSTA5, GSTK1, GSTM1, GSTM2, GSTM3, GSTM4, GSTM5, GSTO2, GSTP1, GSTT1, GSTT2, GSTZ1, IDH1, IDH2, MGST1, MGST2, MGST3, OPLAH, TXNDC12 | 34 | GCLM(1), GPX2(1), GSTK1(2), GSTM3(1), IDH1(19), IDH2(20) | 5770918 | 44 | 42 | 9 | 0 | 34 | 4 | 0 | 6 | 0 | 0 | 1e-07 | 3.9e-15 | 3.1e-13 |
| 6 | NUCLEAR_RECEPTORS | ALK, AR, ESR1, ESR2, ESRRA, HNF4A, NPM1, NR0B1, NR1D2, NR1H2, NR1H3, NR1I2, NR1I3, NR2C2, NR2E1, NR2F1, NR2F2, NR2F6, NR3C1, NR4A1, NR4A2, NR5A1, NR5A2, PGR, PPARA, PPARD, PPARG, RARA, RARB, RARG, ROR1, RORA, RORC, RXRA, RXRB, RXRG, THRA, THRA, NR1D1, THRB, VDR | 38 | NPM1(54), NR2E1(2), THRB(1) | 11589707 | 57 | 56 | 10 | 0 | 1 | 1 | 1 | 1 | 52 | 1 | 0.25 | 4.1e-15 | 3.1e-13 | |
| 7 | HSA00020_CITRATE_CYCLE | Genes involved in citrate cycle (TCA cycle) | ACLY, ACO1, ACO2, CLYBL, CS, DLD, DLST, FH, IDH1, IDH2, IDH3A, IDH3B, IDH3G, LOC283398, LOC441996, MDH1, MDH2, OGDH, OGDHL, PC, PCK1, PCK2, SDHA, SDHB, SDHC, SDHD, SUCLA2, SUCLG1, SUCLG2 | 27 | DLD(1), IDH1(19), IDH2(20) | 8626236 | 40 | 39 | 5 | 2 | 33 | 4 | 0 | 3 | 0 | 0 | 0.000017 | 4.7e-15 | 3.1e-13 |
| 8 | CITRATE_CYCLE_TCA_CYCLE | ACO1, ACO2, CS, DLD, DLST, DLSTP, FH, IDH1, IDH2, IDH3A, IDH3B, IDH3G, MDH1, MDH2, PC, PCK1, SDHA, SDHA, SDHAL2, SDHB, SUCLA2, SUCLG1, SUCLG2 | 20 | DLD(1), IDH1(19), IDH2(20) | 5929109 | 40 | 39 | 5 | 1 | 33 | 4 | 0 | 3 | 0 | 0 | 1.5e-06 | 5.3e-15 | 3.1e-13 | |
| 9 | REDUCTIVE_CARBOXYLATE_CYCLE_CO2_FIXATION | ACO1, ACO2, FH, IDH1, IDH2, MDH1, MDH2, SDHB, SUCLA2 | 9 | IDH1(19), IDH2(20) | 2582079 | 39 | 38 | 4 | 0 | 33 | 3 | 0 | 3 | 0 | 0 | 2.8e-07 | 5.3e-15 | 3.1e-13 | |
| 10 | KREBPATHWAY | The Krebs (citric acid) cycle takes place in mitochondria, where it extracts energy in the form of electron carriers NADH and FADH2, which drive the electron transport chain. | ACO2, CS, FH, IDH2, MDH1, OGDH, SDHA, SUCLA2 | 8 | IDH2(20) | 2741649 | 20 | 20 | 2 | 0 | 16 | 3 | 0 | 1 | 0 | 0 | 0.00031 | 6.1e-15 | 3.1e-13 |
Table 6. Get Full Table A Ranked List of Significantly Mutated Genesets (Excluding Significantly Mutated Genes). Number of significant genesets found: 0. Number of genesets displayed: 10
| rank | geneset | description | genes | N_genes | mut_tally | N | n | npat | nsite | nsil | n1 | n2 | n3 | n4 | n5 | n6 | p_ns_s | p | q |
|---|---|---|---|---|---|---|---|---|---|---|---|---|---|---|---|---|---|---|---|
| 1 | ERKPATHWAY | Cell growth is promoted by Ras activation of the anti-apoptotic p44/42 MAP kinase pathway. | DPM2, EGFR, ELK1, GNAS, GNB1, GNGT1, GRB2, HRAS, IGF1R, ITGB1, KLK2, MAP2K1, MAP2K2, MAPK1, MAPK3, MKNK1, MKNK2, MYC, NGFB, NGFR, PDGFRA, PPP2CA, PTPRR, RAF1, RPS6KA1, RPS6KA5, SHC1, SOS1, SRC, STAT3 | 29 | EGFR(2), GNB1(1), MAPK1(1), MYC(1), PDGFRA(1), SHC1(1), SOS1(1) | 9119524 | 8 | 8 | 8 | 1 | 3 | 1 | 0 | 3 | 1 | 0 | 0.37 | 0.0059 | 1 |
| 2 | EOSINOPHILSPATHWAY | Recruitment of eosinophils in the inflammatory response observed in asthma occurs via the chemoattractant eotaxin binding to the CCR3 receptor. | CCL11, CCL5, CCR3, CSF2, HLA-DRA, HLA-DRB1, IL3, IL5 | 8 | CCL11(1), HLA-DRB1(1) | 893001 | 2 | 2 | 2 | 0 | 0 | 1 | 0 | 1 | 0 | 0 | 0.47 | 0.015 | 1 |
| 3 | HSA00480_GLUTATHIONE_METABOLISM | Genes involved in glutathione metabolism | ANPEP, G6PD, GCLC, GCLM, GGT1, GGTL3, GGTL4, GPX1, GPX2, GPX3, GPX4, GPX5, GPX6, GPX7, GSR, GSS, GSTA1, GSTA2, GSTA3, GSTA4, GSTA5, GSTK1, GSTM1, GSTM2, GSTM3, GSTM4, GSTM5, GSTO2, GSTP1, GSTT1, GSTT2, GSTZ1, IDH1, IDH2, MGST1, MGST2, MGST3, OPLAH, TXNDC12 | 32 | GCLM(1), GPX2(1), GSTK1(2), GSTM3(1) | 5289056 | 5 | 5 | 5 | 0 | 1 | 1 | 0 | 3 | 0 | 0 | 0.23 | 0.018 | 1 |
| 4 | CBLPATHWAY | Activated EGF receptors undergo endocytosis into clathrin-coated vesicles, where they are recycled to the membrane or ubiquitinated by Cbl. | CBL, CSF1R, EGF, EGFR, GRB2, MET, PDGFRA, PRKCA, PRKCB1, SH3GLB1, SH3GLB2, SH3KBP1, SRC | 12 | CBL(2), EGFR(2), PDGFRA(1) | 5655476 | 5 | 5 | 5 | 1 | 1 | 0 | 1 | 2 | 1 | 0 | 0.55 | 0.026 | 1 |
| 5 | CLASSICPATHWAY | The classic complement pathway is initiated by antibodies and promotes phagocytosis and lysis of foreign cells as well as activating the inflammatory response. | C1QA, C1QB, C1QG, C1R, C1S, C2, C3, C4A, C4B, C5, C6, C7, C8A, C9 | 11 | C2(1), C3(1), C5(1), C7(1) | 5092056 | 4 | 4 | 4 | 1 | 2 | 0 | 0 | 1 | 1 | 0 | 0.76 | 0.026 | 1 |
| 6 | ALTERNATIVEPATHWAY | The alternative complement pathway is an antibody-independent mechanism of immune activation that results in cell lysis via the membrane attack complex. | BF, C3, C5, C6, C7, C8A, C9, DF, PFC | 6 | C3(1), C5(1), C7(1) | 3564715 | 3 | 3 | 3 | 1 | 1 | 0 | 0 | 1 | 1 | 0 | 0.89 | 0.027 | 1 |
| 7 | SPRYPATHWAY | Four members of the Sprouty protein family block proliferative EGF signals by binding Grb-2, preventing Ras and MAP kinase activation. | CBL, EGF, EGFR, GRB2, HRAS, MAP2K1, MAPK1, MAPK3, PTPRB, RAF1, RASA1, SHC1, SOS1, SPRY1, SPRY2, SPRY3, SPRY4, SRC | 18 | CBL(2), EGFR(2), MAPK1(1), SHC1(1), SOS1(1) | 7219656 | 7 | 7 | 7 | 2 | 2 | 1 | 1 | 1 | 2 | 0 | 0.67 | 0.029 | 1 |
| 8 | LAIRPATHWAY | The local acute inflammatory response is mediated by activated macrophages and mast cells or by complement activation. | BDK, C3, C5, C6, C7, ICAM1, IL1A, IL6, IL8, ITGA4, ITGAL, ITGB1, ITGB2, SELP, SELPLG, TNF, VCAM1 | 16 | C3(1), C5(1), C7(1), SELPLG(1), VCAM1(1) | 6976558 | 5 | 5 | 5 | 1 | 2 | 0 | 0 | 2 | 1 | 0 | 0.66 | 0.03 | 1 |
| 9 | STAT3PATHWAY | The STAT transcription factors are phosphorylated and activated by JAK kinases in response to cytokine signaling. | FRAP1, JAK1, JAK2, JAK3, MAPK1, MAPK3, STAT3, TYK2 | 7 | JAK2(1), JAK3(1), MAPK1(1) | 3335407 | 3 | 3 | 3 | 0 | 1 | 1 | 0 | 1 | 0 | 0 | 0.35 | 0.031 | 1 |
| 10 | BIOPEPTIDESPATHWAY | Extracellular signaling peptides exert biological effects via G-protein coupled receptors (GPCRs), which activate intracellular GTPases. | AGT, AGTR2, BDK, CALM1, CALM2, CALM3, CAMK2A, CAMK2B, CAMK2D, CAMK2G, CDK5, F2, FYN, GNA11, GNAI1, GNB1, GNGT1, GRB2, HRAS, JAK2, MAP2K1, MAP2K2, MAPK1, MAPK14, MAPK3, MAPK8, MAPT, MYLK, PLCG1, PRKCA, PRKCB1, PTK2B, RAF1, SHC1, SOS1, STAT1, STAT3, STAT5A, SYT1 | 37 | GNB1(1), JAK2(1), MAPK1(1), MYLK(1), SHC1(1), SOS1(1), SYT1(1) | 11743170 | 7 | 7 | 7 | 1 | 2 | 1 | 0 | 3 | 1 | 0 | 0.48 | 0.039 | 1 |
In brief, we tabulate the number of mutations and the number of covered bases for each gene. The counts are broken down by mutation context category: four context categories that are discovered by MutSig, and one for indel and 'null' mutations, which include indels, nonsense mutations, splice-site mutations, and non-stop (read-through) mutations. For each gene, we calculate the probability of seeing the observed constellation of mutations, i.e. the product P1 x P2 x ... x Pm, or a more extreme one, given the background mutation rates calculated across the dataset. [1]
In addition to the links below, the full results of the analysis summarized in this report can also be downloaded programmatically using firehose_get, or interactively from either the Broad GDAC website or TCGA Data Coordination Center Portal.