This pipeline computes the correlation between significant copy number variation (cnv focal) genes and selected clinical features.
Testing the association between copy number variation 52 focal events and 8 clinical features across 430 patients, 31 significant findings detected with Q value < 0.25.
-
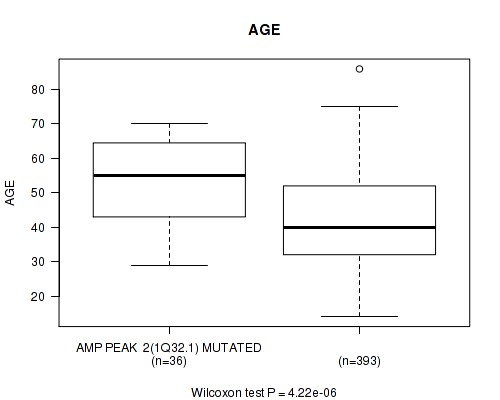
amp_1q32.1 cnv correlated to 'AGE'.
-
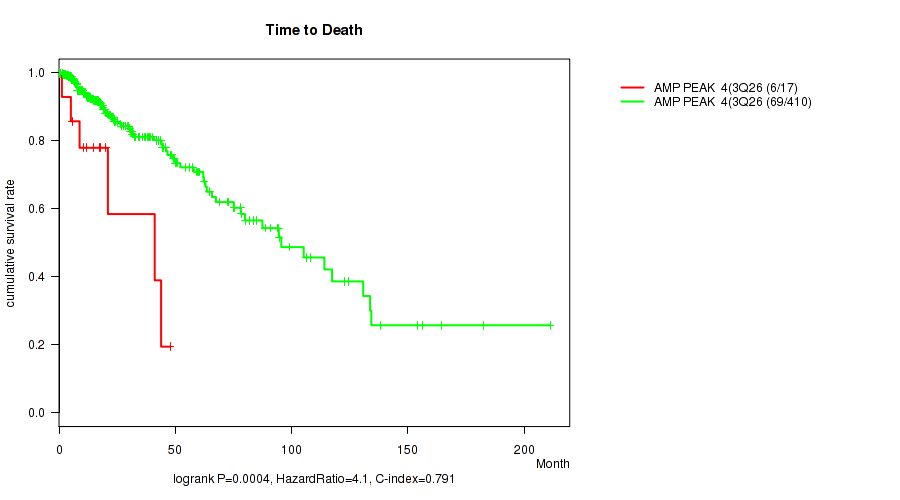
amp_3q26.33 cnv correlated to 'Time to Death'.
-
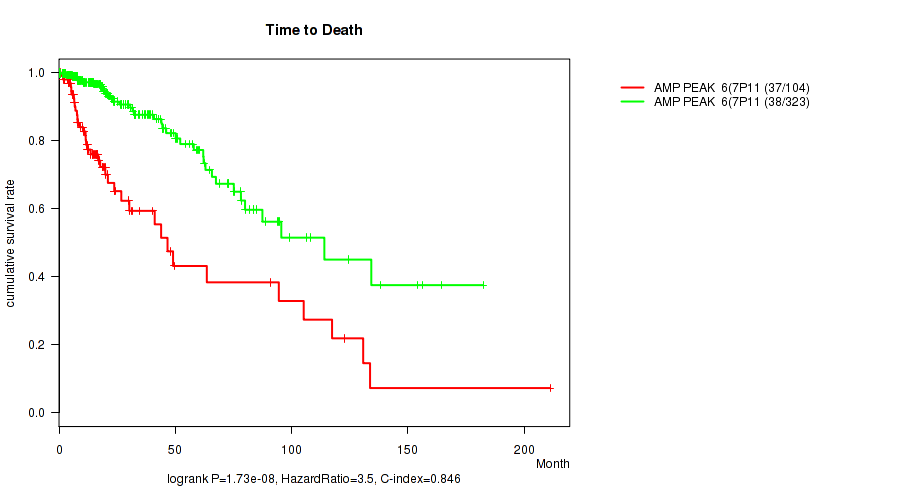
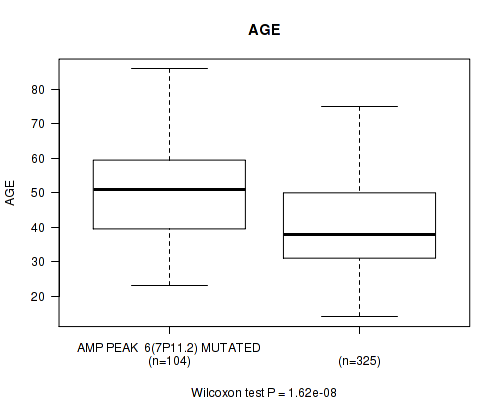
amp_7p11.2 cnv correlated to 'Time to Death' and 'AGE'.
-
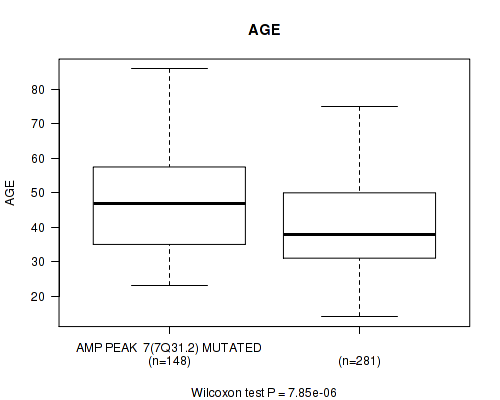
amp_7q31.2 cnv correlated to 'AGE'.
-
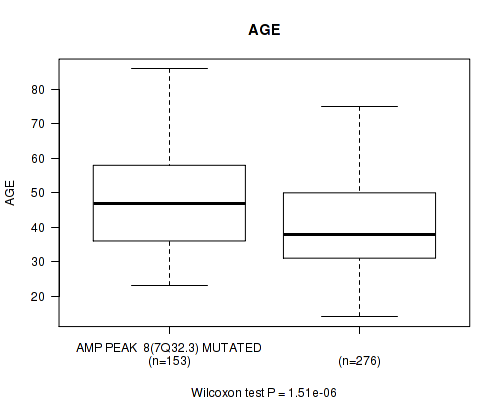
amp_7q32.3 cnv correlated to 'AGE'.
-
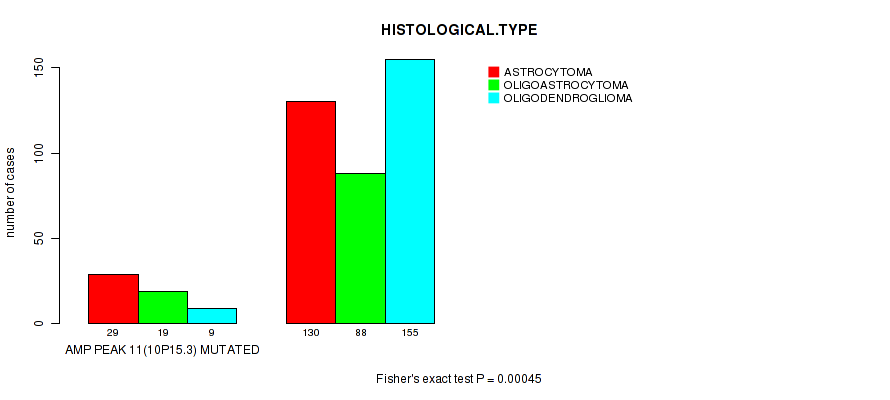
amp_10p15.3 cnv correlated to 'HISTOLOGICAL.TYPE'.
-
amp_12q14.1 cnv correlated to 'Time to Death'.
-
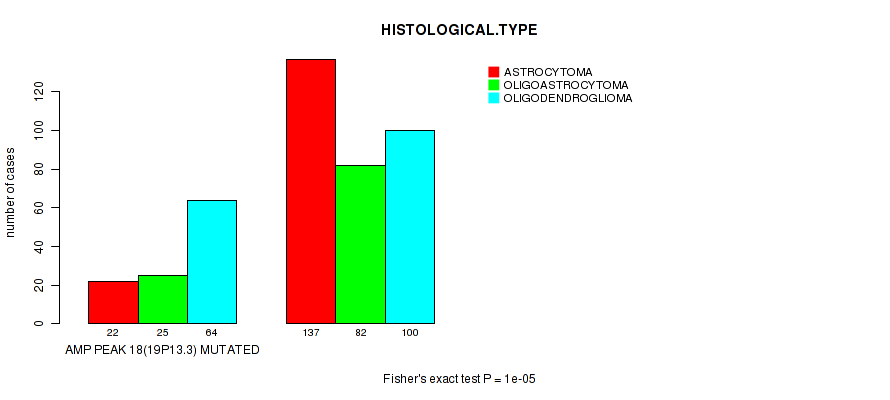
amp_19p13.3 cnv correlated to 'HISTOLOGICAL.TYPE'.
-
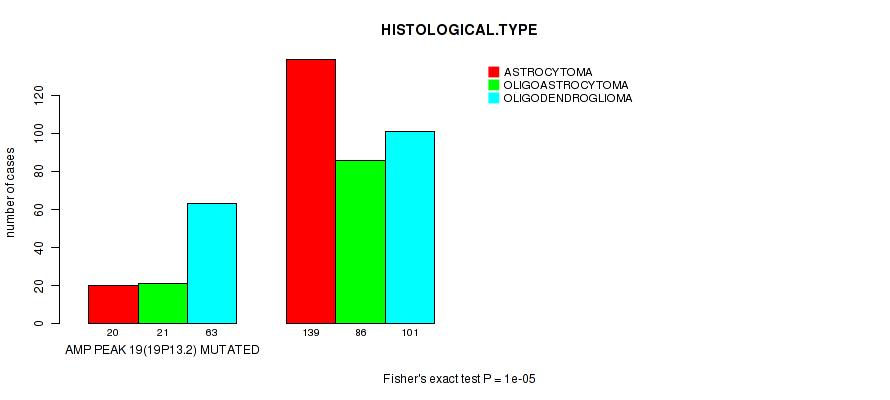
amp_19p13.2 cnv correlated to 'HISTOLOGICAL.TYPE'.
-
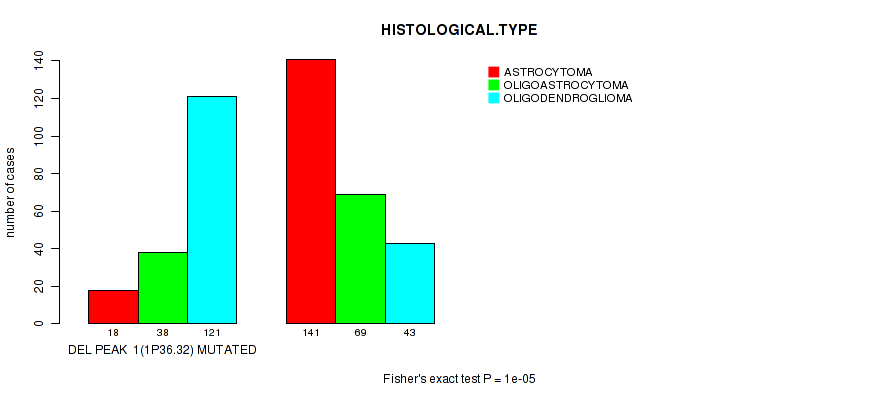
del_1p36.32 cnv correlated to 'AGE' and 'HISTOLOGICAL.TYPE'.
-
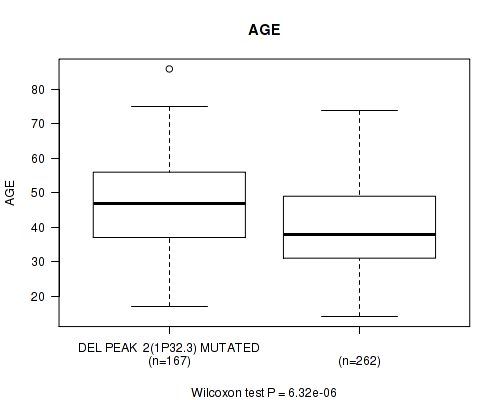
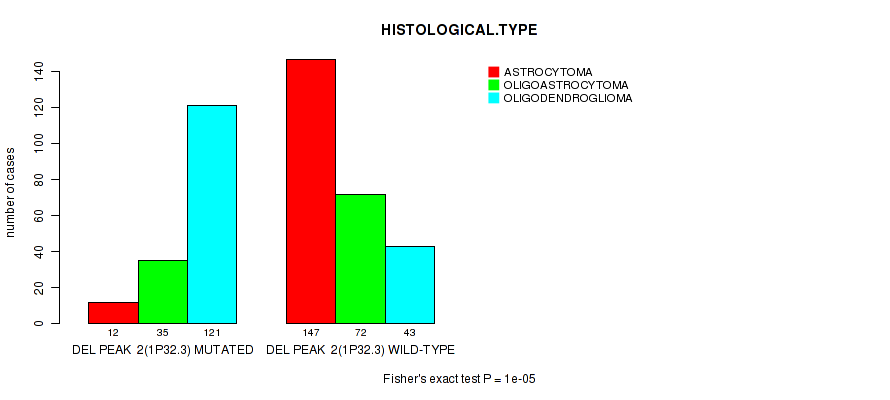
del_1p32.3 cnv correlated to 'AGE' and 'HISTOLOGICAL.TYPE'.
-
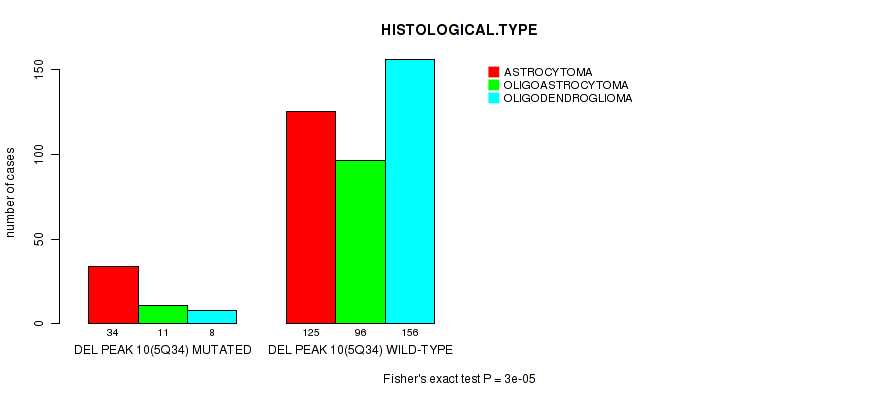
del_5q34 cnv correlated to 'HISTOLOGICAL.TYPE'.
-
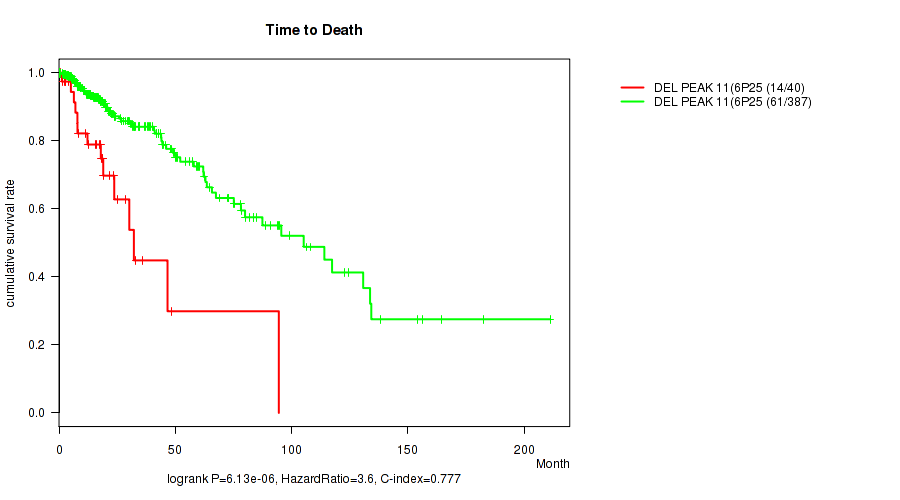
del_6p25.3 cnv correlated to 'Time to Death'.
-
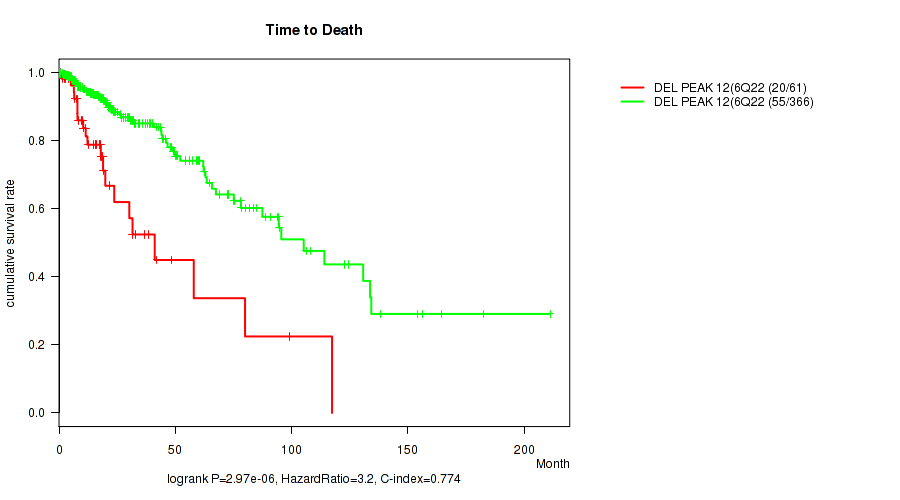
del_6q22.31 cnv correlated to 'Time to Death' and 'HISTOLOGICAL.TYPE'.
-
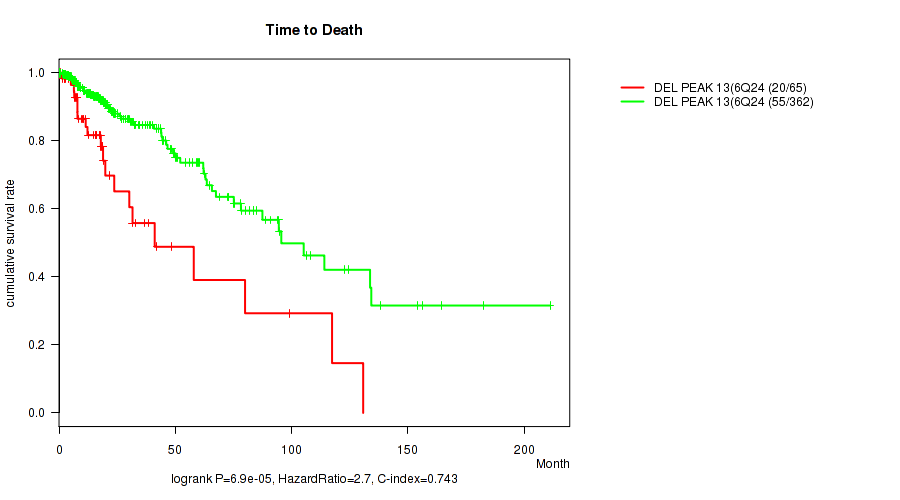
del_6q24.3 cnv correlated to 'Time to Death' and 'HISTOLOGICAL.TYPE'.
-
del_9p23 cnv correlated to 'Time to Death'.
-
del_9p21.3 cnv correlated to 'Time to Death' and 'AGE'.
-
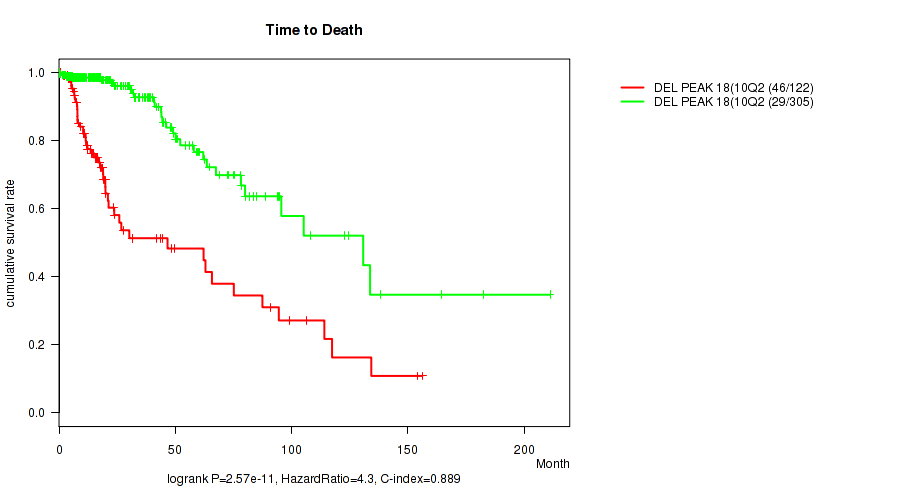
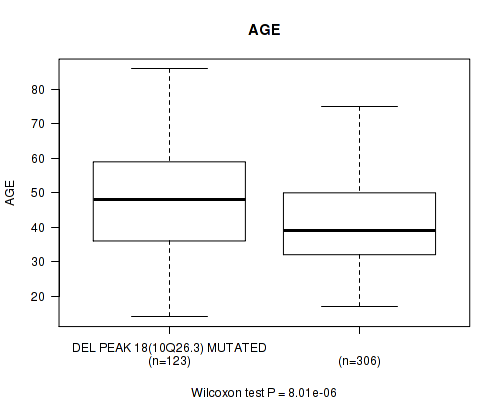
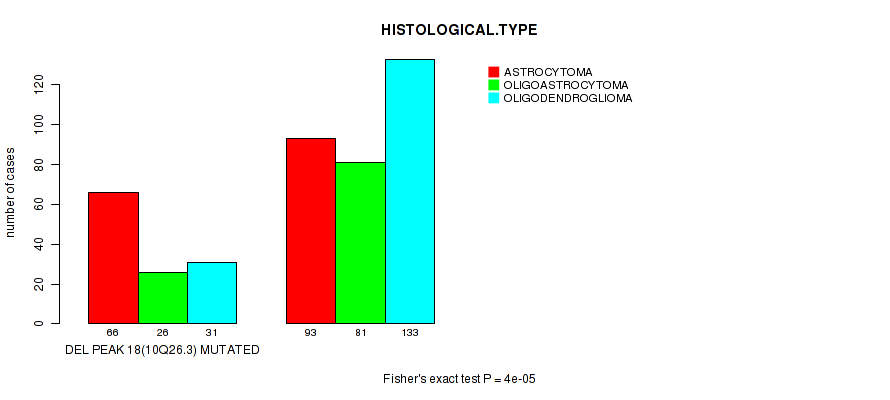
del_10q26.3 cnv correlated to 'Time to Death', 'AGE', and 'HISTOLOGICAL.TYPE'.
-
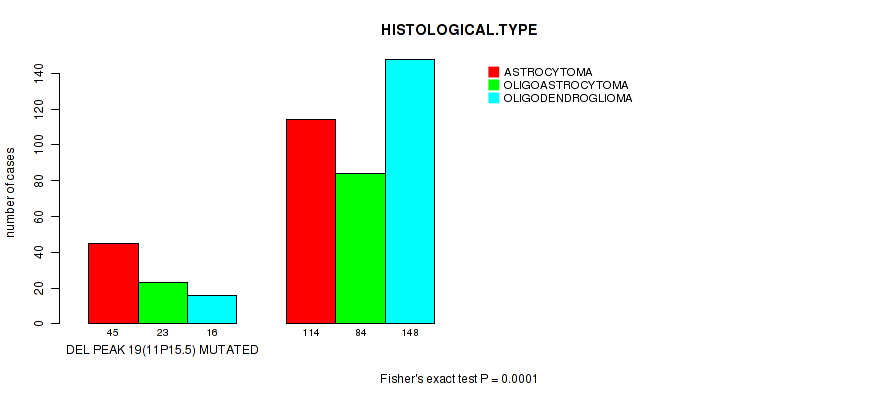
del_11p15.5 cnv correlated to 'HISTOLOGICAL.TYPE'.
-
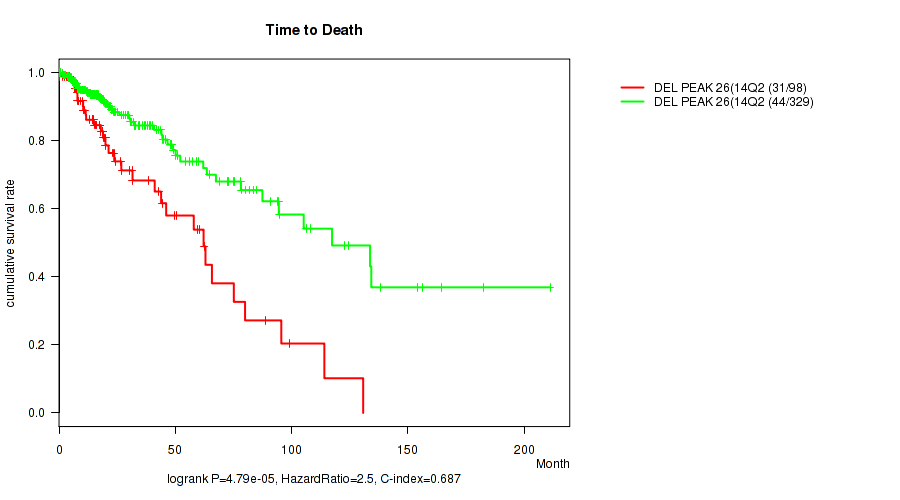
del_14q24.3 cnv correlated to 'Time to Death'.
-
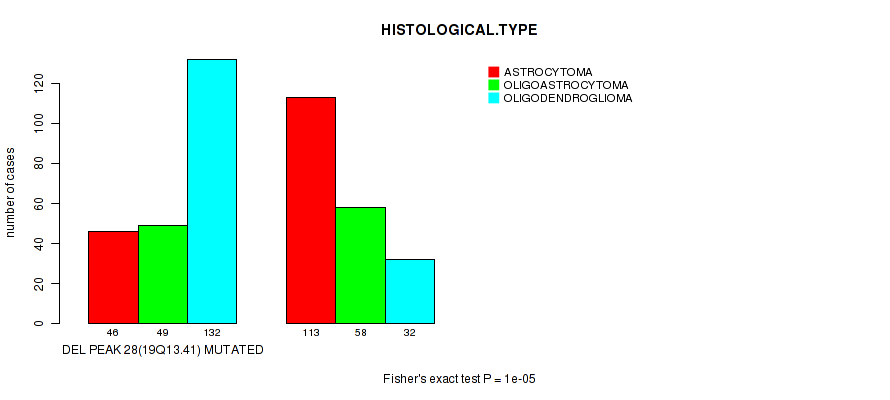
del_19q13.41 cnv correlated to 'HISTOLOGICAL.TYPE'.
-
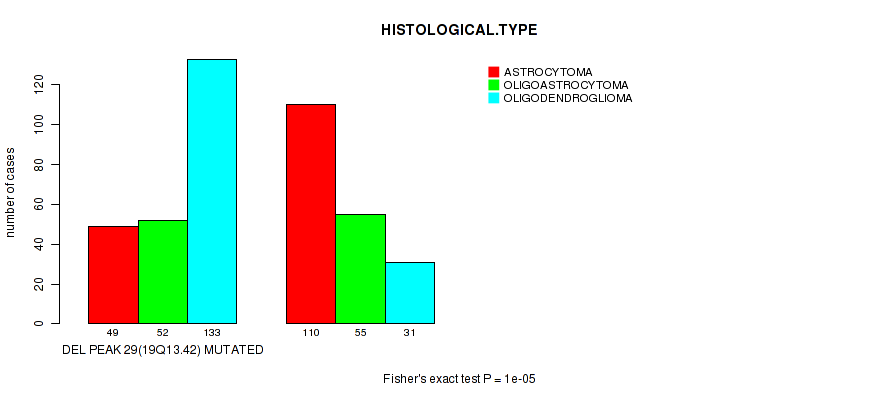
del_19q13.42 cnv correlated to 'HISTOLOGICAL.TYPE'.
-
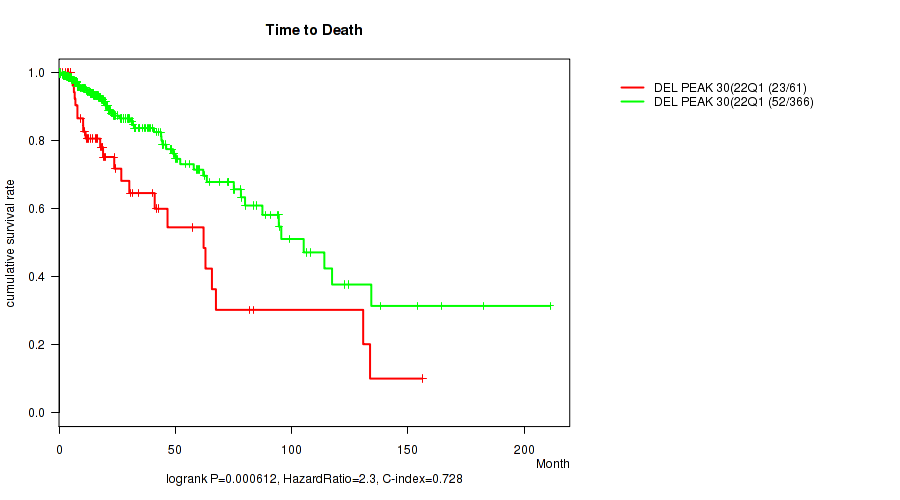
del_22q13.31 cnv correlated to 'Time to Death'.
Table 1. Get Full Table Overview of the association between significant copy number variation of 52 focal events and 8 clinical features. Shown in the table are P values (Q values). Thresholded by Q value < 0.25, 31 significant findings detected.
|
Clinical Features |
Time to Death |
AGE | GENDER |
KARNOFSKY PERFORMANCE SCORE |
HISTOLOGICAL TYPE |
RADIATIONS RADIATION REGIMENINDICATION |
RACE | ETHNICITY | ||
| nCNV (%) | nWild-Type | logrank test | Wilcoxon-test | Fisher's exact test | Wilcoxon-test | Fisher's exact test | Fisher's exact test | Fisher's exact test | Fisher's exact test | |
| del 10q26 3 | 123 (29%) | 307 |
2.57e-11 (1.07e-08) |
8.01e-06 (0.00323) |
0.0416 (1.00) |
0.158 (1.00) |
4e-05 (0.0157) |
0.896 (1.00) |
0.223 (1.00) |
0.787 (1.00) |
| amp 7p11 2 | 104 (24%) | 326 |
1.73e-08 (7.14e-06) |
1.62e-08 (6.71e-06) |
0.259 (1.00) |
0.115 (1.00) |
0.0212 (1.00) |
0.334 (1.00) |
0.111 (1.00) |
1 (1.00) |
| del 1p36 32 | 177 (41%) | 253 |
0.0987 (1.00) |
2.33e-06 (0.000955) |
0.622 (1.00) |
0.691 (1.00) |
1e-05 (0.00402) |
0.0401 (1.00) |
0.3 (1.00) |
1 (1.00) |
| del 1p32 3 | 168 (39%) | 262 |
0.00802 (1.00) |
6.32e-06 (0.00256) |
0.766 (1.00) |
0.559 (1.00) |
1e-05 (0.00402) |
0.00484 (1.00) |
0.491 (1.00) |
1 (1.00) |
| del 6q22 31 | 62 (14%) | 368 |
2.97e-06 (0.00121) |
0.138 (1.00) |
0.68 (1.00) |
0.0681 (1.00) |
1e-05 (0.00402) |
0.309 (1.00) |
0.141 (1.00) |
1 (1.00) |
| del 6q24 3 | 66 (15%) | 364 |
6.9e-05 (0.027) |
0.461 (1.00) |
0.346 (1.00) |
0.0681 (1.00) |
2e-05 (0.0079) |
0.321 (1.00) |
0.146 (1.00) |
0.719 (1.00) |
| del 9p21 3 | 145 (34%) | 285 |
3.99e-10 (1.65e-07) |
2.82e-06 (0.00115) |
0.355 (1.00) |
0.00322 (1.00) |
0.0026 (0.972) |
0.0164 (1.00) |
0.727 (1.00) |
1 (1.00) |
| amp 1q32 1 | 36 (8%) | 394 |
0.00395 (1.00) |
4.22e-06 (0.00172) |
1 (1.00) |
0.0561 (1.00) |
0.226 (1.00) |
0.284 (1.00) |
0.312 (1.00) |
0.381 (1.00) |
| amp 3q26 33 | 18 (4%) | 412 |
0.0004 (0.155) |
0.141 (1.00) |
0.342 (1.00) |
0.157 (1.00) |
0.00817 (1.00) |
0.229 (1.00) |
0.0645 (1.00) |
1 (1.00) |
| amp 7q31 2 | 148 (34%) | 282 |
0.00151 (0.572) |
7.85e-06 (0.00317) |
0.0832 (1.00) |
0.469 (1.00) |
0.0377 (1.00) |
0.616 (1.00) |
0.0967 (1.00) |
0.796 (1.00) |
| amp 7q32 3 | 153 (36%) | 277 |
0.00395 (1.00) |
1.51e-06 (0.000621) |
0.0678 (1.00) |
0.608 (1.00) |
0.0476 (1.00) |
0.456 (1.00) |
0.133 (1.00) |
0.794 (1.00) |
| amp 10p15 3 | 57 (13%) | 373 |
0.819 (1.00) |
0.00144 (0.548) |
0.153 (1.00) |
0.111 (1.00) |
0.00045 (0.175) |
0.0354 (1.00) |
1 (1.00) |
0.249 (1.00) |
| amp 12q14 1 | 29 (7%) | 401 |
4.72e-08 (1.94e-05) |
0.00123 (0.472) |
0.701 (1.00) |
0.49 (1.00) |
0.0211 (1.00) |
0.477 (1.00) |
0.228 (1.00) |
1 (1.00) |
| amp 19p13 3 | 111 (26%) | 319 |
0.572 (1.00) |
0.0434 (1.00) |
0.825 (1.00) |
0.677 (1.00) |
1e-05 (0.00402) |
0.684 (1.00) |
0.826 (1.00) |
0.772 (1.00) |
| amp 19p13 2 | 104 (24%) | 326 |
0.947 (1.00) |
0.0115 (1.00) |
0.428 (1.00) |
0.476 (1.00) |
1e-05 (0.00402) |
1 (1.00) |
0.762 (1.00) |
0.555 (1.00) |
| del 5q34 | 53 (12%) | 377 |
0.033 (1.00) |
0.462 (1.00) |
0.883 (1.00) |
0.316 (1.00) |
3e-05 (0.0118) |
0.0727 (1.00) |
0.442 (1.00) |
0.706 (1.00) |
| del 6p25 3 | 41 (10%) | 389 |
6.13e-06 (0.00249) |
0.24 (1.00) |
1 (1.00) |
0.046 (1.00) |
0.159 (1.00) |
0.84 (1.00) |
0.0933 (1.00) |
0.655 (1.00) |
| del 9p23 | 122 (28%) | 308 |
0.000463 (0.179) |
0.00476 (1.00) |
0.668 (1.00) |
0.035 (1.00) |
0.014 (1.00) |
0.0248 (1.00) |
0.675 (1.00) |
1 (1.00) |
| del 11p15 5 | 84 (20%) | 346 |
0.25 (1.00) |
0.0627 (1.00) |
0.0659 (1.00) |
0.104 (1.00) |
0.0001 (0.039) |
0.454 (1.00) |
0.729 (1.00) |
1 (1.00) |
| del 14q24 3 | 100 (23%) | 330 |
4.79e-05 (0.0188) |
0.0269 (1.00) |
0.206 (1.00) |
0.222 (1.00) |
0.105 (1.00) |
0.778 (1.00) |
0.241 (1.00) |
1 (1.00) |
| del 19q13 41 | 227 (53%) | 203 |
0.029 (1.00) |
0.0186 (1.00) |
0.771 (1.00) |
0.66 (1.00) |
1e-05 (0.00402) |
0.721 (1.00) |
0.79 (1.00) |
0.611 (1.00) |
| del 19q13 42 | 234 (54%) | 196 |
0.00143 (0.547) |
0.114 (1.00) |
1 (1.00) |
0.786 (1.00) |
1e-05 (0.00402) |
1 (1.00) |
0.759 (1.00) |
0.449 (1.00) |
| del 22q13 31 | 61 (14%) | 369 |
0.000612 (0.236) |
0.00351 (1.00) |
0.487 (1.00) |
0.0985 (1.00) |
0.00347 (1.00) |
0.612 (1.00) |
0.176 (1.00) |
0.71 (1.00) |
| amp 1q22 | 37 (9%) | 393 |
0.133 (1.00) |
0.00149 (0.564) |
0.864 (1.00) |
0.328 (1.00) |
0.438 (1.00) |
0.394 (1.00) |
0.527 (1.00) |
0.38 (1.00) |
| amp 2p24 3 | 19 (4%) | 411 |
0.393 (1.00) |
0.508 (1.00) |
0.485 (1.00) |
0.632 (1.00) |
0.0868 (1.00) |
0.775 (1.00) |
1 (1.00) |
0.128 (1.00) |
| amp 4q12 | 25 (6%) | 405 |
0.0682 (1.00) |
0.427 (1.00) |
1 (1.00) |
0.515 (1.00) |
0.00222 (0.832) |
0.799 (1.00) |
0.731 (1.00) |
1 (1.00) |
| amp 8q24 13 | 83 (19%) | 347 |
0.707 (1.00) |
0.111 (1.00) |
0.391 (1.00) |
0.301 (1.00) |
0.00154 (0.582) |
0.88 (1.00) |
0.779 (1.00) |
1 (1.00) |
| amp 9q34 3 | 40 (9%) | 390 |
0.61 (1.00) |
0.894 (1.00) |
0.0941 (1.00) |
0.149 (1.00) |
0.0382 (1.00) |
0.538 (1.00) |
0.0757 (1.00) |
0.184 (1.00) |
| amp 11q24 1 | 73 (17%) | 357 |
0.791 (1.00) |
0.2 (1.00) |
0.366 (1.00) |
0.989 (1.00) |
0.495 (1.00) |
0.634 (1.00) |
0.677 (1.00) |
0.326 (1.00) |
| amp 12p13 32 | 57 (13%) | 373 |
0.371 (1.00) |
0.0659 (1.00) |
0.0863 (1.00) |
0.557 (1.00) |
0.236 (1.00) |
0.0354 (1.00) |
0.893 (1.00) |
0.708 (1.00) |
| amp 13q34 | 21 (5%) | 409 |
0.396 (1.00) |
0.748 (1.00) |
0.656 (1.00) |
0.113 (1.00) |
0.557 (1.00) |
1 (1.00) |
0.651 (1.00) |
0.564 (1.00) |
| amp 15q26 3 | 14 (3%) | 416 |
0.0043 (1.00) |
0.827 (1.00) |
1 (1.00) |
0.119 (1.00) |
0.0743 (1.00) |
0.501 (1.00) |
1 (1.00) |
0.414 (1.00) |
| amp 17q25 1 | 35 (8%) | 395 |
0.0161 (1.00) |
0.0926 (1.00) |
1 (1.00) |
0.699 (1.00) |
0.189 (1.00) |
0.67 (1.00) |
0.158 (1.00) |
0.368 (1.00) |
| amp xp11 22 | 35 (8%) | 395 |
0.853 (1.00) |
0.216 (1.00) |
1 (1.00) |
0.905 (1.00) |
0.0352 (1.00) |
0.126 (1.00) |
0.201 (1.00) |
1 (1.00) |
| amp xp11 22 | 50 (12%) | 380 |
0.543 (1.00) |
0.526 (1.00) |
0.289 (1.00) |
0.601 (1.00) |
0.00091 (0.35) |
0.353 (1.00) |
0.752 (1.00) |
1 (1.00) |
| del 1q43 | 23 (5%) | 407 |
0.964 (1.00) |
0.544 (1.00) |
0.519 (1.00) |
0.964 (1.00) |
0.302 (1.00) |
1 (1.00) |
0.339 (1.00) |
1 (1.00) |
| del 2q37 3 | 61 (14%) | 369 |
0.693 (1.00) |
0.0823 (1.00) |
0.33 (1.00) |
0.834 (1.00) |
0.026 (1.00) |
0.399 (1.00) |
0.485 (1.00) |
0.717 (1.00) |
| del 3p21 31 | 36 (8%) | 394 |
0.214 (1.00) |
0.992 (1.00) |
1 (1.00) |
0.00207 (0.779) |
0.599 (1.00) |
0.135 (1.00) |
0.799 (1.00) |
0.153 (1.00) |
| del 3q13 31 | 29 (7%) | 401 |
0.00317 (1.00) |
0.58 (1.00) |
0.0319 (1.00) |
0.452 (1.00) |
0.693 (1.00) |
0.159 (1.00) |
1 (1.00) |
0.307 (1.00) |
| del 3q29 | 35 (8%) | 395 |
0.0204 (1.00) |
0.542 (1.00) |
0.287 (1.00) |
0.247 (1.00) |
0.188 (1.00) |
0.513 (1.00) |
0.63 (1.00) |
0.631 (1.00) |
| del 4q34 3 | 114 (27%) | 316 |
0.701 (1.00) |
0.127 (1.00) |
0.51 (1.00) |
0.512 (1.00) |
0.841 (1.00) |
0.177 (1.00) |
0.662 (1.00) |
1 (1.00) |
| del 5p15 33 | 39 (9%) | 391 |
0.925 (1.00) |
0.202 (1.00) |
0.313 (1.00) |
0.0446 (1.00) |
0.00464 (1.00) |
0.00675 (1.00) |
0.69 (1.00) |
1 (1.00) |
| del 7p22 3 | 19 (4%) | 411 |
0.192 (1.00) |
0.943 (1.00) |
1 (1.00) |
0.751 (1.00) |
0.916 (1.00) |
1 (1.00) |
0.37 (1.00) |
1 (1.00) |
| del 8q24 3 | 23 (5%) | 407 |
0.597 (1.00) |
0.695 (1.00) |
0.83 (1.00) |
0.732 (1.00) |
0.229 (1.00) |
0.595 (1.00) |
0.447 (1.00) |
0.0498 (1.00) |
| del 11p15 1 | 60 (14%) | 370 |
0.0671 (1.00) |
0.305 (1.00) |
0.161 (1.00) |
0.0249 (1.00) |
0.00106 (0.407) |
0.392 (1.00) |
0.708 (1.00) |
1 (1.00) |
| del 12p13 1 | 33 (8%) | 397 |
0.0148 (1.00) |
0.71 (1.00) |
0.858 (1.00) |
0.469 (1.00) |
0.0596 (1.00) |
0.37 (1.00) |
0.777 (1.00) |
0.621 (1.00) |
| del 12q12 | 59 (14%) | 371 |
0.787 (1.00) |
0.683 (1.00) |
0.323 (1.00) |
0.539 (1.00) |
0.00194 (0.731) |
1 (1.00) |
0.467 (1.00) |
0.143 (1.00) |
| del 13q14 2 | 120 (28%) | 310 |
0.0135 (1.00) |
0.74 (1.00) |
0.196 (1.00) |
0.0092 (1.00) |
0.0967 (1.00) |
0.112 (1.00) |
0.378 (1.00) |
0.573 (1.00) |
| del 13q14 2 | 122 (28%) | 308 |
0.0193 (1.00) |
0.751 (1.00) |
0.236 (1.00) |
0.00949 (1.00) |
0.0763 (1.00) |
0.147 (1.00) |
0.385 (1.00) |
0.574 (1.00) |
| del 13q34 | 90 (21%) | 340 |
0.0222 (1.00) |
0.379 (1.00) |
0.404 (1.00) |
0.207 (1.00) |
0.942 (1.00) |
0.241 (1.00) |
0.4 (1.00) |
1 (1.00) |
| del 18q23 | 66 (15%) | 364 |
0.725 (1.00) |
0.0255 (1.00) |
0.283 (1.00) |
0.899 (1.00) |
0.545 (1.00) |
0.624 (1.00) |
0.181 (1.00) |
0.717 (1.00) |
| del xq21 1 | 58 (13%) | 372 |
0.0625 (1.00) |
0.0541 (1.00) |
1 (1.00) |
0.928 (1.00) |
0.656 (1.00) |
1 (1.00) |
0.42 (1.00) |
0.707 (1.00) |
P value = 4.22e-06 (Wilcoxon-test), Q value = 0.0017
Table S1. Gene #2: 'amp_1q32.1' versus Clinical Feature #2: 'AGE'
| nPatients | Mean (Std.Dev) | |
|---|---|---|
| ALL | 429 | 43.0 (13.2) |
| AMP PEAK 2(1Q32.1) MUTATED | 36 | 53.1 (12.7) |
| AMP PEAK 2(1Q32.1) WILD-TYPE | 393 | 42.1 (12.9) |
Figure S1. Get High-res Image Gene #2: 'amp_1q32.1' versus Clinical Feature #2: 'AGE'
P value = 4e-04 (logrank test), Q value = 0.16
Table S2. Gene #4: 'amp_3q26.33' versus Clinical Feature #1: 'Time to Death'
| nPatients | nDeath | Duration Range (Median), Month | |
|---|---|---|---|
| ALL | 427 | 75 | 0.0 - 211.2 (15.9) |
| AMP PEAK 4(3Q26.33) MUTATED | 17 | 6 | 0.1 - 47.8 (12.0) |
| AMP PEAK 4(3Q26.33) WILD-TYPE | 410 | 69 | 0.0 - 211.2 (16.0) |
Figure S2. Get High-res Image Gene #4: 'amp_3q26.33' versus Clinical Feature #1: 'Time to Death'
P value = 1.73e-08 (logrank test), Q value = 7.1e-06
Table S3. Gene #6: 'amp_7p11.2' versus Clinical Feature #1: 'Time to Death'
| nPatients | nDeath | Duration Range (Median), Month | |
|---|---|---|---|
| ALL | 427 | 75 | 0.0 - 211.2 (15.9) |
| AMP PEAK 6(7P11.2) MUTATED | 104 | 37 | 0.1 - 211.2 (14.0) |
| AMP PEAK 6(7P11.2) WILD-TYPE | 323 | 38 | 0.0 - 182.3 (16.4) |
Figure S3. Get High-res Image Gene #6: 'amp_7p11.2' versus Clinical Feature #1: 'Time to Death'
P value = 1.62e-08 (Wilcoxon-test), Q value = 6.7e-06
Table S4. Gene #6: 'amp_7p11.2' versus Clinical Feature #2: 'AGE'
| nPatients | Mean (Std.Dev) | |
|---|---|---|
| ALL | 429 | 43.0 (13.2) |
| AMP PEAK 6(7P11.2) MUTATED | 104 | 49.6 (13.5) |
| AMP PEAK 6(7P11.2) WILD-TYPE | 325 | 40.9 (12.5) |
Figure S4. Get High-res Image Gene #6: 'amp_7p11.2' versus Clinical Feature #2: 'AGE'
P value = 7.85e-06 (Wilcoxon-test), Q value = 0.0032
Table S5. Gene #7: 'amp_7q31.2' versus Clinical Feature #2: 'AGE'
| nPatients | Mean (Std.Dev) | |
|---|---|---|
| ALL | 429 | 43.0 (13.2) |
| AMP PEAK 7(7Q31.2) MUTATED | 148 | 47.0 (13.3) |
| AMP PEAK 7(7Q31.2) WILD-TYPE | 281 | 40.9 (12.8) |
Figure S5. Get High-res Image Gene #7: 'amp_7q31.2' versus Clinical Feature #2: 'AGE'
P value = 1.51e-06 (Wilcoxon-test), Q value = 0.00062
Table S6. Gene #8: 'amp_7q32.3' versus Clinical Feature #2: 'AGE'
| nPatients | Mean (Std.Dev) | |
|---|---|---|
| ALL | 429 | 43.0 (13.2) |
| AMP PEAK 8(7Q32.3) MUTATED | 153 | 47.1 (13.1) |
| AMP PEAK 8(7Q32.3) WILD-TYPE | 276 | 40.7 (12.8) |
Figure S6. Get High-res Image Gene #8: 'amp_7q32.3' versus Clinical Feature #2: 'AGE'
P value = 0.00045 (Fisher's exact test), Q value = 0.17
Table S7. Gene #11: 'amp_10p15.3' versus Clinical Feature #5: 'HISTOLOGICAL.TYPE'
| nPatients | ASTROCYTOMA | OLIGOASTROCYTOMA | OLIGODENDROGLIOMA |
|---|---|---|---|
| ALL | 159 | 107 | 164 |
| AMP PEAK 11(10P15.3) MUTATED | 29 | 19 | 9 |
| AMP PEAK 11(10P15.3) WILD-TYPE | 130 | 88 | 155 |
Figure S7. Get High-res Image Gene #11: 'amp_10p15.3' versus Clinical Feature #5: 'HISTOLOGICAL.TYPE'
P value = 4.72e-08 (logrank test), Q value = 1.9e-05
Table S8. Gene #14: 'amp_12q14.1' versus Clinical Feature #1: 'Time to Death'
| nPatients | nDeath | Duration Range (Median), Month | |
|---|---|---|---|
| ALL | 427 | 75 | 0.0 - 211.2 (15.9) |
| AMP PEAK 14(12Q14.1) MUTATED | 29 | 13 | 1.2 - 80.0 (12.2) |
| AMP PEAK 14(12Q14.1) WILD-TYPE | 398 | 62 | 0.0 - 211.2 (16.2) |
Figure S8. Get High-res Image Gene #14: 'amp_12q14.1' versus Clinical Feature #1: 'Time to Death'

P value = 1e-05 (Fisher's exact test), Q value = 0.004
Table S9. Gene #18: 'amp_19p13.3' versus Clinical Feature #5: 'HISTOLOGICAL.TYPE'
| nPatients | ASTROCYTOMA | OLIGOASTROCYTOMA | OLIGODENDROGLIOMA |
|---|---|---|---|
| ALL | 159 | 107 | 164 |
| AMP PEAK 18(19P13.3) MUTATED | 22 | 25 | 64 |
| AMP PEAK 18(19P13.3) WILD-TYPE | 137 | 82 | 100 |
Figure S9. Get High-res Image Gene #18: 'amp_19p13.3' versus Clinical Feature #5: 'HISTOLOGICAL.TYPE'
P value = 1e-05 (Fisher's exact test), Q value = 0.004
Table S10. Gene #19: 'amp_19p13.2' versus Clinical Feature #5: 'HISTOLOGICAL.TYPE'
| nPatients | ASTROCYTOMA | OLIGOASTROCYTOMA | OLIGODENDROGLIOMA |
|---|---|---|---|
| ALL | 159 | 107 | 164 |
| AMP PEAK 19(19P13.2) MUTATED | 20 | 21 | 63 |
| AMP PEAK 19(19P13.2) WILD-TYPE | 139 | 86 | 101 |
Figure S10. Get High-res Image Gene #19: 'amp_19p13.2' versus Clinical Feature #5: 'HISTOLOGICAL.TYPE'
P value = 2.33e-06 (Wilcoxon-test), Q value = 0.00095
Table S11. Gene #22: 'del_1p36.32' versus Clinical Feature #2: 'AGE'
| nPatients | Mean (Std.Dev) | |
|---|---|---|
| ALL | 429 | 43.0 (13.2) |
| DEL PEAK 1(1P36.32) MUTATED | 176 | 46.4 (12.5) |
| DEL PEAK 1(1P36.32) WILD-TYPE | 253 | 40.6 (13.3) |
Figure S11. Get High-res Image Gene #22: 'del_1p36.32' versus Clinical Feature #2: 'AGE'

P value = 1e-05 (Fisher's exact test), Q value = 0.004
Table S12. Gene #22: 'del_1p36.32' versus Clinical Feature #5: 'HISTOLOGICAL.TYPE'
| nPatients | ASTROCYTOMA | OLIGOASTROCYTOMA | OLIGODENDROGLIOMA |
|---|---|---|---|
| ALL | 159 | 107 | 164 |
| DEL PEAK 1(1P36.32) MUTATED | 18 | 38 | 121 |
| DEL PEAK 1(1P36.32) WILD-TYPE | 141 | 69 | 43 |
Figure S12. Get High-res Image Gene #22: 'del_1p36.32' versus Clinical Feature #5: 'HISTOLOGICAL.TYPE'
P value = 6.32e-06 (Wilcoxon-test), Q value = 0.0026
Table S13. Gene #23: 'del_1p32.3' versus Clinical Feature #2: 'AGE'
| nPatients | Mean (Std.Dev) | |
|---|---|---|
| ALL | 429 | 43.0 (13.2) |
| DEL PEAK 2(1P32.3) MUTATED | 167 | 46.5 (12.9) |
| DEL PEAK 2(1P32.3) WILD-TYPE | 262 | 40.7 (13.0) |
Figure S13. Get High-res Image Gene #23: 'del_1p32.3' versus Clinical Feature #2: 'AGE'
P value = 1e-05 (Fisher's exact test), Q value = 0.004
Table S14. Gene #23: 'del_1p32.3' versus Clinical Feature #5: 'HISTOLOGICAL.TYPE'
| nPatients | ASTROCYTOMA | OLIGOASTROCYTOMA | OLIGODENDROGLIOMA |
|---|---|---|---|
| ALL | 159 | 107 | 164 |
| DEL PEAK 2(1P32.3) MUTATED | 12 | 35 | 121 |
| DEL PEAK 2(1P32.3) WILD-TYPE | 147 | 72 | 43 |
Figure S14. Get High-res Image Gene #23: 'del_1p32.3' versus Clinical Feature #5: 'HISTOLOGICAL.TYPE'
P value = 3e-05 (Fisher's exact test), Q value = 0.012
Table S15. Gene #31: 'del_5q34' versus Clinical Feature #5: 'HISTOLOGICAL.TYPE'
| nPatients | ASTROCYTOMA | OLIGOASTROCYTOMA | OLIGODENDROGLIOMA |
|---|---|---|---|
| ALL | 159 | 107 | 164 |
| DEL PEAK 10(5Q34) MUTATED | 34 | 11 | 8 |
| DEL PEAK 10(5Q34) WILD-TYPE | 125 | 96 | 156 |
Figure S15. Get High-res Image Gene #31: 'del_5q34' versus Clinical Feature #5: 'HISTOLOGICAL.TYPE'
P value = 6.13e-06 (logrank test), Q value = 0.0025
Table S16. Gene #32: 'del_6p25.3' versus Clinical Feature #1: 'Time to Death'
| nPatients | nDeath | Duration Range (Median), Month | |
|---|---|---|---|
| ALL | 427 | 75 | 0.0 - 211.2 (15.9) |
| DEL PEAK 11(6P25.3) MUTATED | 40 | 14 | 0.2 - 94.5 (17.5) |
| DEL PEAK 11(6P25.3) WILD-TYPE | 387 | 61 | 0.0 - 211.2 (15.5) |
Figure S16. Get High-res Image Gene #32: 'del_6p25.3' versus Clinical Feature #1: 'Time to Death'
P value = 2.97e-06 (logrank test), Q value = 0.0012
Table S17. Gene #33: 'del_6q22.31' versus Clinical Feature #1: 'Time to Death'
| nPatients | nDeath | Duration Range (Median), Month | |
|---|---|---|---|
| ALL | 427 | 75 | 0.0 - 211.2 (15.9) |
| DEL PEAK 12(6Q22.31) MUTATED | 61 | 20 | 0.1 - 117.4 (15.0) |
| DEL PEAK 12(6Q22.31) WILD-TYPE | 366 | 55 | 0.0 - 211.2 (16.1) |
Figure S17. Get High-res Image Gene #33: 'del_6q22.31' versus Clinical Feature #1: 'Time to Death'
P value = 1e-05 (Fisher's exact test), Q value = 0.004
Table S18. Gene #33: 'del_6q22.31' versus Clinical Feature #5: 'HISTOLOGICAL.TYPE'
| nPatients | ASTROCYTOMA | OLIGOASTROCYTOMA | OLIGODENDROGLIOMA |
|---|---|---|---|
| ALL | 159 | 107 | 164 |
| DEL PEAK 12(6Q22.31) MUTATED | 40 | 11 | 11 |
| DEL PEAK 12(6Q22.31) WILD-TYPE | 119 | 96 | 153 |
Figure S18. Get High-res Image Gene #33: 'del_6q22.31' versus Clinical Feature #5: 'HISTOLOGICAL.TYPE'

P value = 6.9e-05 (logrank test), Q value = 0.027
Table S19. Gene #34: 'del_6q24.3' versus Clinical Feature #1: 'Time to Death'
| nPatients | nDeath | Duration Range (Median), Month | |
|---|---|---|---|
| ALL | 427 | 75 | 0.0 - 211.2 (15.9) |
| DEL PEAK 13(6Q24.3) MUTATED | 65 | 20 | 0.0 - 130.8 (15.0) |
| DEL PEAK 13(6Q24.3) WILD-TYPE | 362 | 55 | 0.1 - 211.2 (16.2) |
Figure S19. Get High-res Image Gene #34: 'del_6q24.3' versus Clinical Feature #1: 'Time to Death'
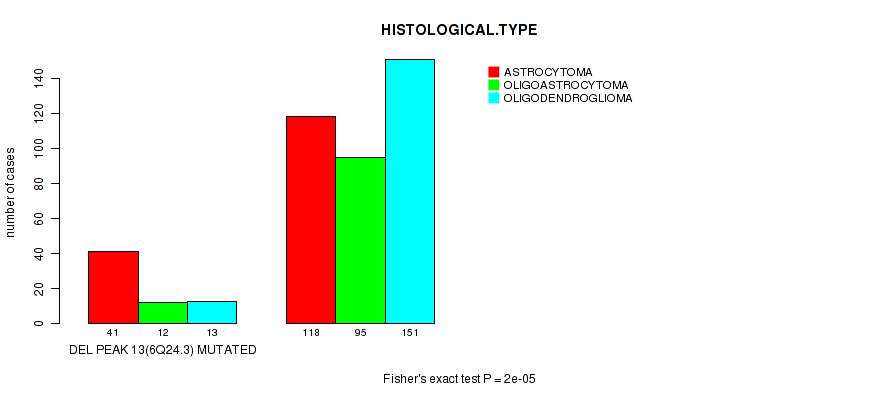
P value = 2e-05 (Fisher's exact test), Q value = 0.0079
Table S20. Gene #34: 'del_6q24.3' versus Clinical Feature #5: 'HISTOLOGICAL.TYPE'
| nPatients | ASTROCYTOMA | OLIGOASTROCYTOMA | OLIGODENDROGLIOMA |
|---|---|---|---|
| ALL | 159 | 107 | 164 |
| DEL PEAK 13(6Q24.3) MUTATED | 41 | 12 | 13 |
| DEL PEAK 13(6Q24.3) WILD-TYPE | 118 | 95 | 151 |
Figure S20. Get High-res Image Gene #34: 'del_6q24.3' versus Clinical Feature #5: 'HISTOLOGICAL.TYPE'
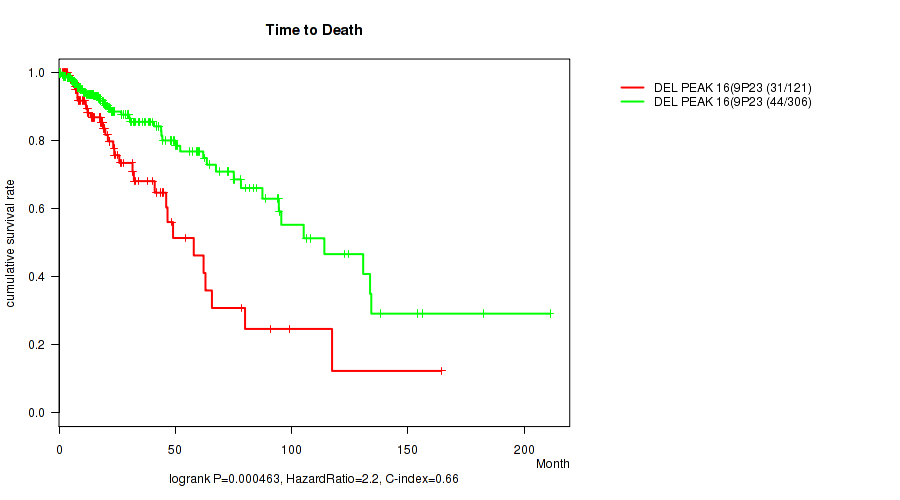
P value = 0.000463 (logrank test), Q value = 0.18
Table S21. Gene #37: 'del_9p23' versus Clinical Feature #1: 'Time to Death'
| nPatients | nDeath | Duration Range (Median), Month | |
|---|---|---|---|
| ALL | 427 | 75 | 0.0 - 211.2 (15.9) |
| DEL PEAK 16(9P23) MUTATED | 121 | 31 | 0.1 - 164.4 (17.3) |
| DEL PEAK 16(9P23) WILD-TYPE | 306 | 44 | 0.0 - 211.2 (15.8) |
Figure S21. Get High-res Image Gene #37: 'del_9p23' versus Clinical Feature #1: 'Time to Death'
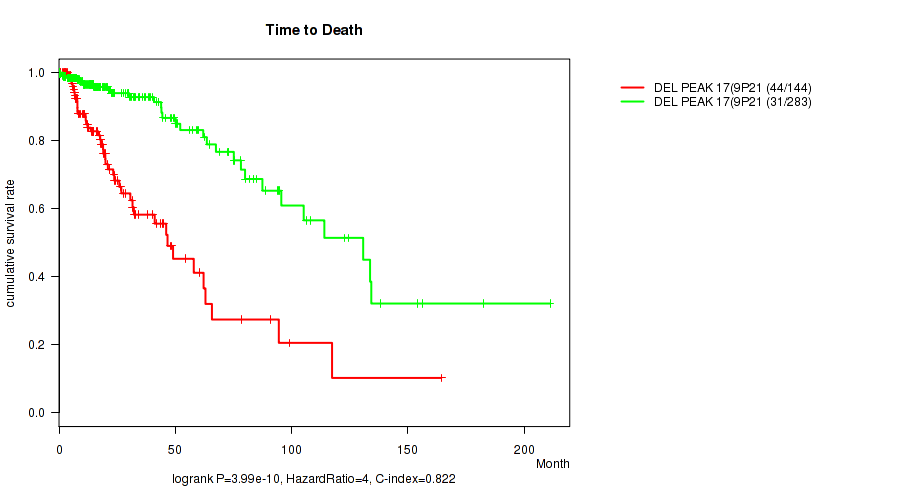
P value = 3.99e-10 (logrank test), Q value = 1.7e-07
Table S22. Gene #38: 'del_9p21.3' versus Clinical Feature #1: 'Time to Death'
| nPatients | nDeath | Duration Range (Median), Month | |
|---|---|---|---|
| ALL | 427 | 75 | 0.0 - 211.2 (15.9) |
| DEL PEAK 17(9P21.3) MUTATED | 144 | 44 | 0.1 - 164.4 (14.8) |
| DEL PEAK 17(9P21.3) WILD-TYPE | 283 | 31 | 0.0 - 211.2 (16.0) |
Figure S22. Get High-res Image Gene #38: 'del_9p21.3' versus Clinical Feature #1: 'Time to Death'
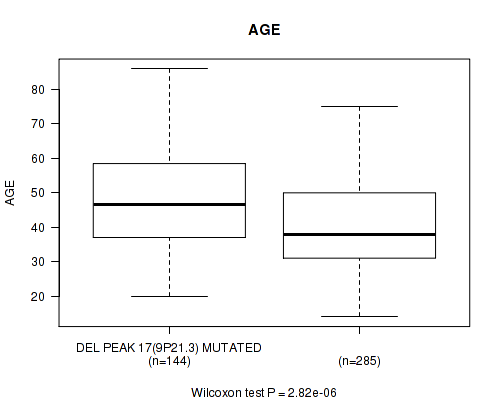
P value = 2.82e-06 (Wilcoxon-test), Q value = 0.0012
Table S23. Gene #38: 'del_9p21.3' versus Clinical Feature #2: 'AGE'
| nPatients | Mean (Std.Dev) | |
|---|---|---|
| ALL | 429 | 43.0 (13.2) |
| DEL PEAK 17(9P21.3) MUTATED | 144 | 47.3 (13.7) |
| DEL PEAK 17(9P21.3) WILD-TYPE | 285 | 40.8 (12.5) |
Figure S23. Get High-res Image Gene #38: 'del_9p21.3' versus Clinical Feature #2: 'AGE'
P value = 2.57e-11 (logrank test), Q value = 1.1e-08
Table S24. Gene #39: 'del_10q26.3' versus Clinical Feature #1: 'Time to Death'
| nPatients | nDeath | Duration Range (Median), Month | |
|---|---|---|---|
| ALL | 427 | 75 | 0.0 - 211.2 (15.9) |
| DEL PEAK 18(10Q26.3) MUTATED | 122 | 46 | 0.1 - 156.2 (14.6) |
| DEL PEAK 18(10Q26.3) WILD-TYPE | 305 | 29 | 0.0 - 211.2 (16.4) |
Figure S24. Get High-res Image Gene #39: 'del_10q26.3' versus Clinical Feature #1: 'Time to Death'
P value = 8.01e-06 (Wilcoxon-test), Q value = 0.0032
Table S25. Gene #39: 'del_10q26.3' versus Clinical Feature #2: 'AGE'
| nPatients | Mean (Std.Dev) | |
|---|---|---|
| ALL | 429 | 43.0 (13.2) |
| DEL PEAK 18(10Q26.3) MUTATED | 123 | 47.7 (13.8) |
| DEL PEAK 18(10Q26.3) WILD-TYPE | 306 | 41.1 (12.5) |
Figure S25. Get High-res Image Gene #39: 'del_10q26.3' versus Clinical Feature #2: 'AGE'
P value = 4e-05 (Fisher's exact test), Q value = 0.016
Table S26. Gene #39: 'del_10q26.3' versus Clinical Feature #5: 'HISTOLOGICAL.TYPE'
| nPatients | ASTROCYTOMA | OLIGOASTROCYTOMA | OLIGODENDROGLIOMA |
|---|---|---|---|
| ALL | 159 | 107 | 164 |
| DEL PEAK 18(10Q26.3) MUTATED | 66 | 26 | 31 |
| DEL PEAK 18(10Q26.3) WILD-TYPE | 93 | 81 | 133 |
Figure S26. Get High-res Image Gene #39: 'del_10q26.3' versus Clinical Feature #5: 'HISTOLOGICAL.TYPE'
P value = 1e-04 (Fisher's exact test), Q value = 0.039
Table S27. Gene #40: 'del_11p15.5' versus Clinical Feature #5: 'HISTOLOGICAL.TYPE'
| nPatients | ASTROCYTOMA | OLIGOASTROCYTOMA | OLIGODENDROGLIOMA |
|---|---|---|---|
| ALL | 159 | 107 | 164 |
| DEL PEAK 19(11P15.5) MUTATED | 45 | 23 | 16 |
| DEL PEAK 19(11P15.5) WILD-TYPE | 114 | 84 | 148 |
Figure S27. Get High-res Image Gene #40: 'del_11p15.5' versus Clinical Feature #5: 'HISTOLOGICAL.TYPE'
P value = 4.79e-05 (logrank test), Q value = 0.019
Table S28. Gene #47: 'del_14q24.3' versus Clinical Feature #1: 'Time to Death'
| nPatients | nDeath | Duration Range (Median), Month | |
|---|---|---|---|
| ALL | 427 | 75 | 0.0 - 211.2 (15.9) |
| DEL PEAK 26(14Q24.3) MUTATED | 98 | 31 | 0.1 - 130.8 (16.7) |
| DEL PEAK 26(14Q24.3) WILD-TYPE | 329 | 44 | 0.0 - 211.2 (15.4) |
Figure S28. Get High-res Image Gene #47: 'del_14q24.3' versus Clinical Feature #1: 'Time to Death'
P value = 1e-05 (Fisher's exact test), Q value = 0.004
Table S29. Gene #49: 'del_19q13.41' versus Clinical Feature #5: 'HISTOLOGICAL.TYPE'
| nPatients | ASTROCYTOMA | OLIGOASTROCYTOMA | OLIGODENDROGLIOMA |
|---|---|---|---|
| ALL | 159 | 107 | 164 |
| DEL PEAK 28(19Q13.41) MUTATED | 46 | 49 | 132 |
| DEL PEAK 28(19Q13.41) WILD-TYPE | 113 | 58 | 32 |
Figure S29. Get High-res Image Gene #49: 'del_19q13.41' versus Clinical Feature #5: 'HISTOLOGICAL.TYPE'
P value = 1e-05 (Fisher's exact test), Q value = 0.004
Table S30. Gene #50: 'del_19q13.42' versus Clinical Feature #5: 'HISTOLOGICAL.TYPE'
| nPatients | ASTROCYTOMA | OLIGOASTROCYTOMA | OLIGODENDROGLIOMA |
|---|---|---|---|
| ALL | 159 | 107 | 164 |
| DEL PEAK 29(19Q13.42) MUTATED | 49 | 52 | 133 |
| DEL PEAK 29(19Q13.42) WILD-TYPE | 110 | 55 | 31 |
Figure S30. Get High-res Image Gene #50: 'del_19q13.42' versus Clinical Feature #5: 'HISTOLOGICAL.TYPE'
P value = 0.000612 (logrank test), Q value = 0.24
Table S31. Gene #51: 'del_22q13.31' versus Clinical Feature #1: 'Time to Death'
| nPatients | nDeath | Duration Range (Median), Month | |
|---|---|---|---|
| ALL | 427 | 75 | 0.0 - 211.2 (15.9) |
| DEL PEAK 30(22Q13.31) MUTATED | 61 | 23 | 0.1 - 156.2 (18.0) |
| DEL PEAK 30(22Q13.31) WILD-TYPE | 366 | 52 | 0.0 - 211.2 (15.4) |
Figure S31. Get High-res Image Gene #51: 'del_22q13.31' versus Clinical Feature #1: 'Time to Death'
-
Copy number data file = transformed.cor.cli.txt
-
Clinical data file = LGG-TP.merged_data.txt
-
Number of patients = 430
-
Number of significantly focal cnvs = 52
-
Number of selected clinical features = 8
-
Exclude genes that fewer than K tumors have mutations, K = 3
For survival clinical features, the Kaplan-Meier survival curves of tumors with and without gene mutations were plotted and the statistical significance P values were estimated by logrank test (Bland and Altman 2004) using the 'survdiff' function in R
For binary or multi-class clinical features (nominal or ordinal), two-tailed Fisher's exact tests (Fisher 1922) were used to estimate the P values using the 'fisher.test' function in R
For multiple hypothesis correction, Q value is the False Discovery Rate (FDR) analogue of the P value (Benjamini and Hochberg 1995), defined as the minimum FDR at which the test may be called significant. We used the 'Benjamini and Hochberg' method of 'p.adjust' function in R to convert P values into Q values.
In addition to the links below, the full results of the analysis summarized in this report can also be downloaded programmatically using firehose_get, or interactively from either the Broad GDAC website or TCGA Data Coordination Center Portal.