This pipeline computes the correlation between significantly recurrent gene mutations and selected clinical features.
Testing the association between mutation status of 37 genes and 8 clinical features across 286 patients, 15 significant findings detected with Q value < 0.25.
-
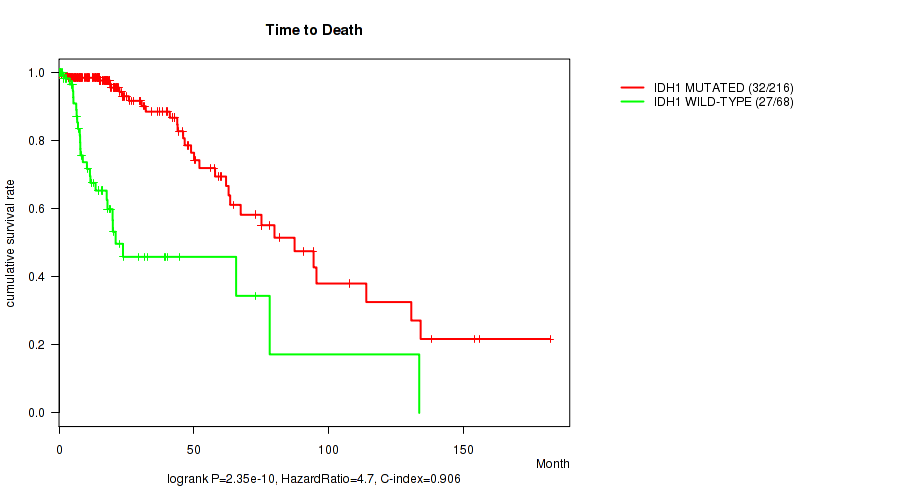
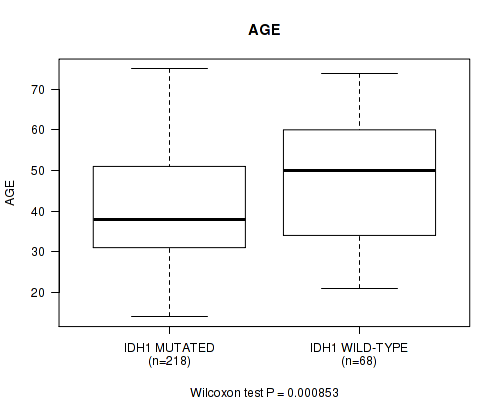
IDH1 mutation correlated to 'Time to Death' and 'AGE'.
-
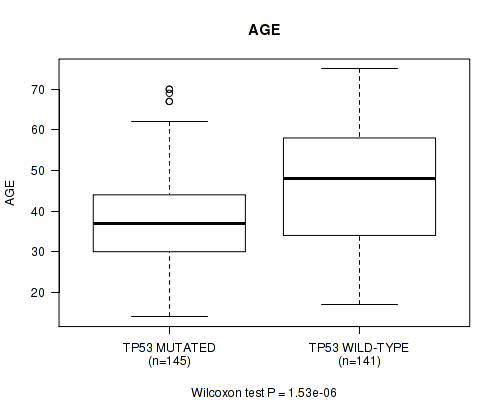
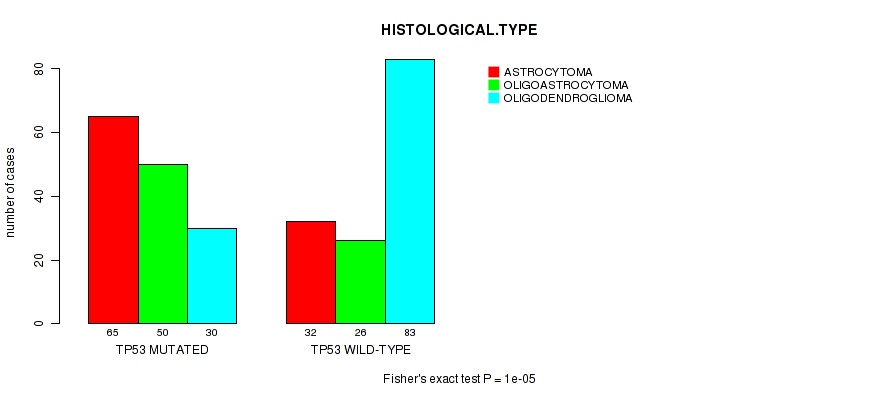
TP53 mutation correlated to 'AGE' and 'HISTOLOGICAL.TYPE'.
-
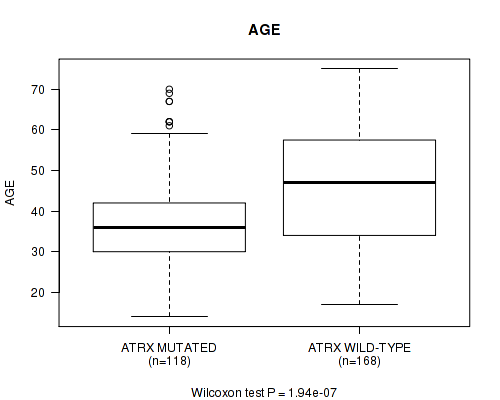
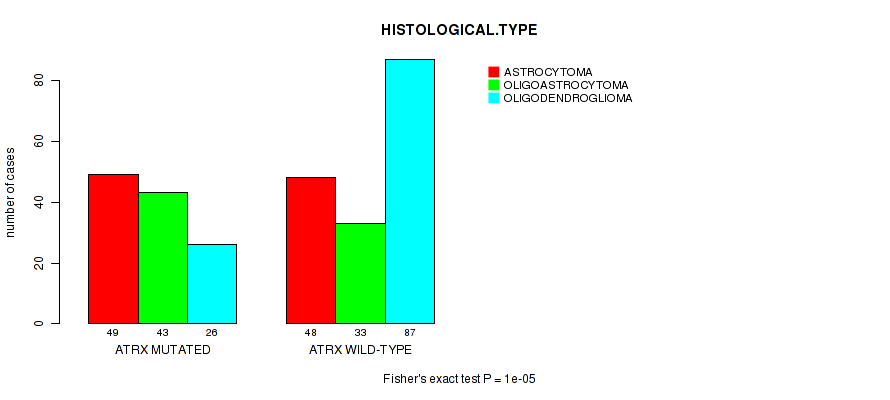
ATRX mutation correlated to 'AGE' and 'HISTOLOGICAL.TYPE'.
-
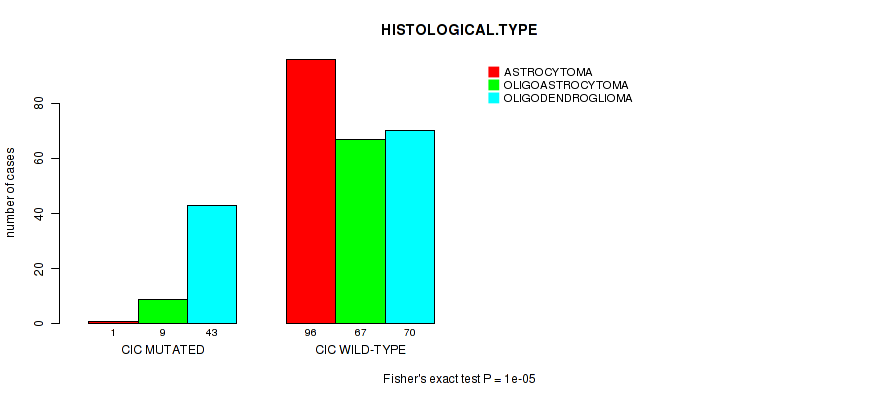
CIC mutation correlated to 'HISTOLOGICAL.TYPE'.
-
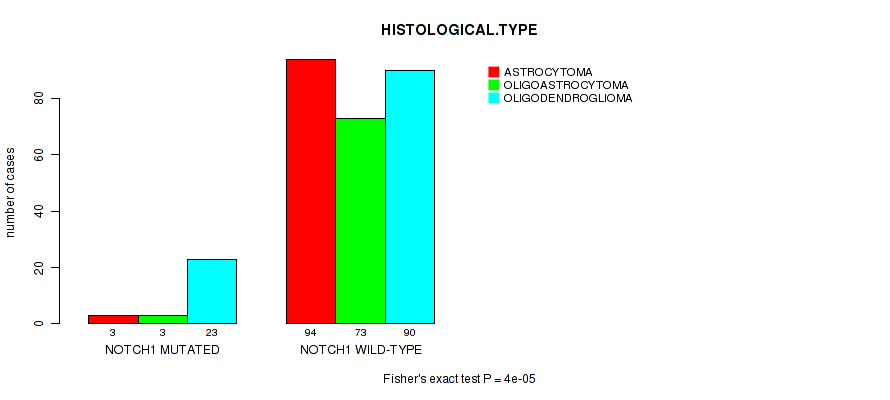
NOTCH1 mutation correlated to 'HISTOLOGICAL.TYPE'.
-
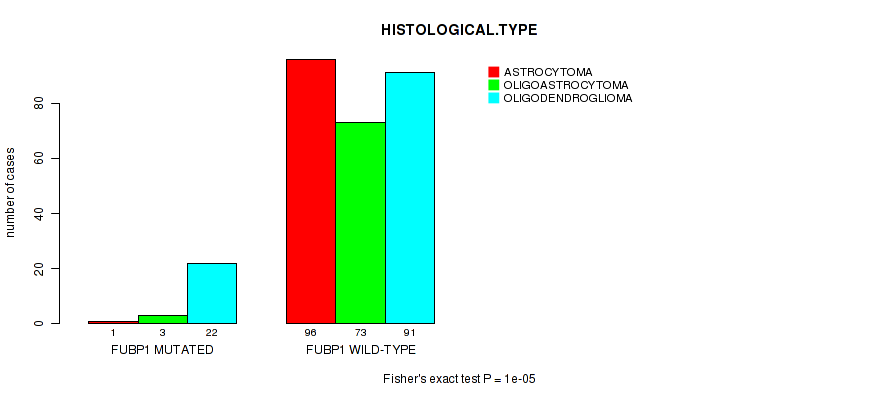
FUBP1 mutation correlated to 'HISTOLOGICAL.TYPE'.
-
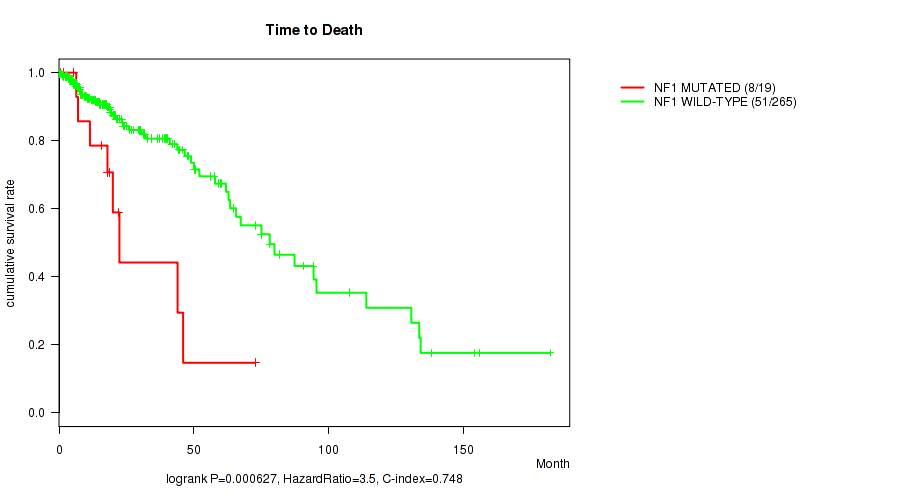
NF1 mutation correlated to 'Time to Death'.
-
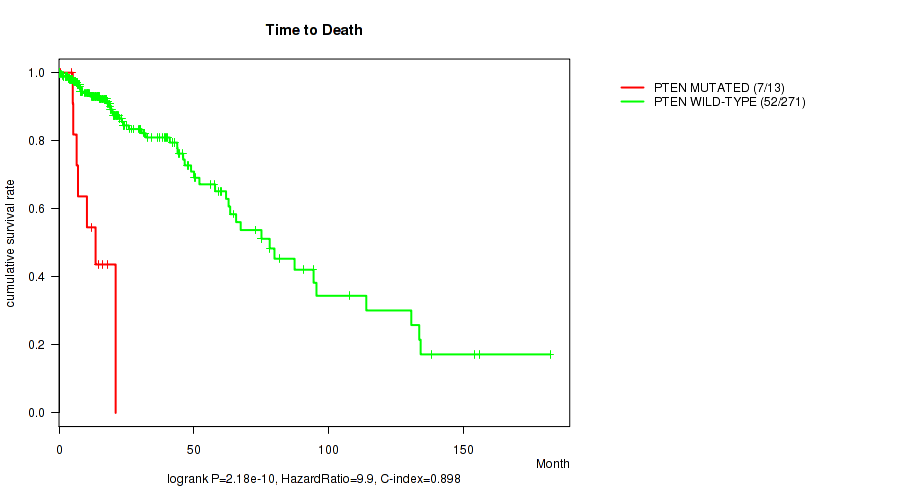
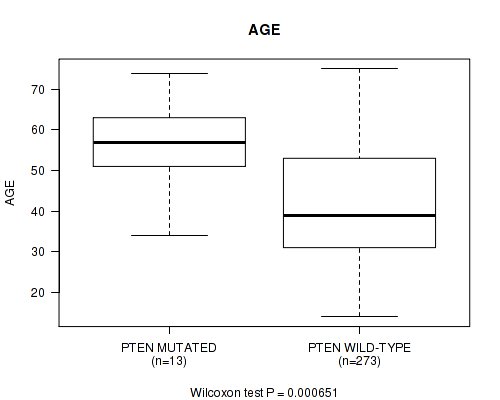
PTEN mutation correlated to 'Time to Death' and 'AGE'.
-
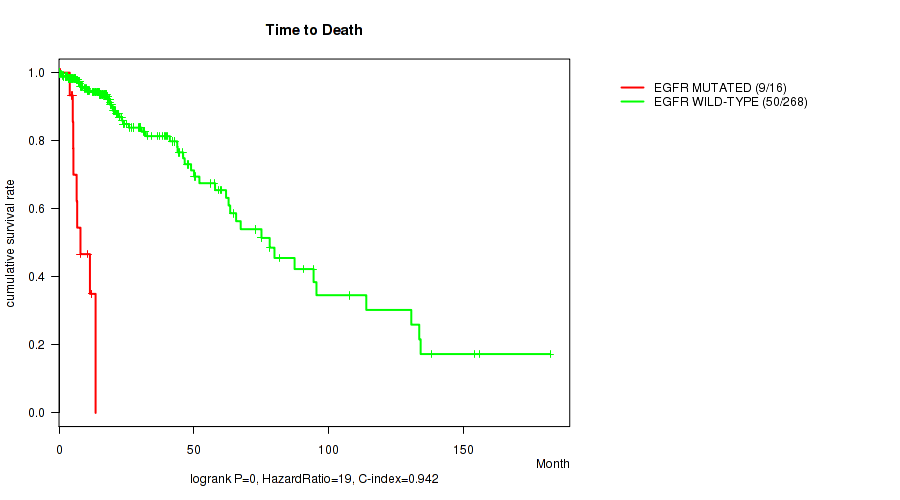
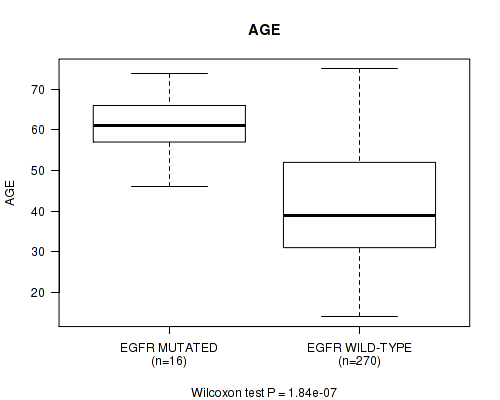
EGFR mutation correlated to 'Time to Death' and 'AGE'.
-
PLCG1 mutation correlated to 'Time to Death'.
Table 1. Get Full Table Overview of the association between mutation status of 37 genes and 8 clinical features. Shown in the table are P values (Q values). Thresholded by Q value < 0.25, 15 significant findings detected.
|
Clinical Features |
Time to Death |
AGE | GENDER |
KARNOFSKY PERFORMANCE SCORE |
HISTOLOGICAL TYPE |
RADIATIONS RADIATION REGIMENINDICATION |
RACE | ETHNICITY | ||
| nMutated (%) | nWild-Type | logrank test | Wilcoxon-test | Fisher's exact test | Wilcoxon-test | Fisher's exact test | Fisher's exact test | Fisher's exact test | Fisher's exact test | |
| IDH1 | 218 (76%) | 68 |
2.35e-10 (6.67e-08) |
0.000853 (0.232) |
0.209 (1.00) |
0.0487 (1.00) |
0.0249 (1.00) |
0.763 (1.00) |
0.176 (1.00) |
0.328 (1.00) |
| TP53 | 145 (51%) | 141 |
0.227 (1.00) |
1.53e-06 (0.000429) |
0.153 (1.00) |
0.284 (1.00) |
1e-05 (0.00279) |
0.0276 (1.00) |
0.468 (1.00) |
1 (1.00) |
| ATRX | 118 (41%) | 168 |
0.0519 (1.00) |
1.94e-07 (5.46e-05) |
0.334 (1.00) |
0.0949 (1.00) |
1e-05 (0.00279) |
0.0873 (1.00) |
0.748 (1.00) |
1 (1.00) |
| PTEN | 13 (5%) | 273 |
2.18e-10 (6.22e-08) |
0.000651 (0.178) |
0.573 (1.00) |
0.115 (1.00) |
0.00612 (1.00) |
0.537 (1.00) |
0.143 (1.00) |
1 (1.00) |
| EGFR | 16 (6%) | 270 |
0 (0) |
1.84e-07 (5.22e-05) |
0.797 (1.00) |
0.00205 (0.551) |
0.334 (1.00) |
0.162 (1.00) |
0.541 (1.00) |
1 (1.00) |
| CIC | 53 (19%) | 233 |
0.0461 (1.00) |
0.298 (1.00) |
0.358 (1.00) |
0.437 (1.00) |
1e-05 (0.00279) |
0.135 (1.00) |
0.756 (1.00) |
1 (1.00) |
| NOTCH1 | 29 (10%) | 257 |
0.673 (1.00) |
0.0464 (1.00) |
1 (1.00) |
0.705 (1.00) |
4e-05 (0.011) |
0.293 (1.00) |
0.66 (1.00) |
1 (1.00) |
| FUBP1 | 26 (9%) | 260 |
0.921 (1.00) |
0.00344 (0.921) |
1 (1.00) |
0.601 (1.00) |
1e-05 (0.00279) |
1 (1.00) |
1 (1.00) |
0.617 (1.00) |
| NF1 | 19 (7%) | 267 |
0.000627 (0.172) |
0.178 (1.00) |
0.815 (1.00) |
0.368 (1.00) |
0.0847 (1.00) |
0.116 (1.00) |
0.247 (1.00) |
0.259 (1.00) |
| PLCG1 | 4 (1%) | 282 |
1.93e-06 (0.00054) |
0.0574 (1.00) |
1 (1.00) |
0.629 (1.00) |
0.686 (1.00) |
0.585 (1.00) |
0.173 (1.00) |
1 (1.00) |
| IDH2 | 12 (4%) | 274 |
0.235 (1.00) |
0.254 (1.00) |
0.771 (1.00) |
0.894 (1.00) |
0.00895 (1.00) |
0.754 (1.00) |
0.436 (1.00) |
0.106 (1.00) |
| PIK3R1 | 13 (5%) | 273 |
0.532 (1.00) |
0.121 (1.00) |
0.155 (1.00) |
0.526 (1.00) |
0.248 (1.00) |
0.216 (1.00) |
0.437 (1.00) |
1 (1.00) |
| STK19 | 8 (3%) | 278 |
0.222 (1.00) |
0.534 (1.00) |
0.473 (1.00) |
0.0434 (1.00) |
0.0645 (1.00) |
0.11 (1.00) |
1 (1.00) |
0.0589 (1.00) |
| PIK3CA | 25 (9%) | 261 |
0.0858 (1.00) |
0.104 (1.00) |
0.679 (1.00) |
0.435 (1.00) |
0.0429 (1.00) |
0.649 (1.00) |
1 (1.00) |
1 (1.00) |
| ARID1A | 12 (4%) | 274 |
0.121 (1.00) |
0.844 (1.00) |
0.0142 (1.00) |
0.0458 (1.00) |
0.317 (1.00) |
1 (1.00) |
1 (1.00) |
0.481 (1.00) |
| GAGE2B | 4 (1%) | 282 |
0.729 (1.00) |
0.765 (1.00) |
0.632 (1.00) |
1 (1.00) |
1 (1.00) |
1 (1.00) |
0.193 (1.00) |
|
| CREBZF | 5 (2%) | 281 |
0.768 (1.00) |
0.231 (1.00) |
0.175 (1.00) |
0.189 (1.00) |
0.223 (1.00) |
1 (1.00) |
0.212 (1.00) |
1 (1.00) |
| TCF12 | 8 (3%) | 278 |
0.332 (1.00) |
0.0839 (1.00) |
1 (1.00) |
0.467 (1.00) |
0.16 (1.00) |
0.443 (1.00) |
1 (1.00) |
1 (1.00) |
| SMARCA4 | 13 (5%) | 273 |
0.105 (1.00) |
0.13 (1.00) |
0.779 (1.00) |
0.0349 (1.00) |
0.482 (1.00) |
0.0643 (1.00) |
1 (1.00) |
0.481 (1.00) |
| VAV3 | 8 (3%) | 278 |
0.449 (1.00) |
0.924 (1.00) |
0.473 (1.00) |
0.00142 (0.386) |
0.742 (1.00) |
0.698 (1.00) |
1 (1.00) |
0.352 (1.00) |
| TMEM216 | 3 (1%) | 283 |
0.747 (1.00) |
0.782 (1.00) |
0.0864 (1.00) |
0.489 (1.00) |
0.557 (1.00) |
1 (1.00) |
1 (1.00) |
|
| ROBO3 | 4 (1%) | 282 |
0.664 (1.00) |
0.874 (1.00) |
0.326 (1.00) |
0.208 (1.00) |
0.566 (1.00) |
1 (1.00) |
1 (1.00) |
1 (1.00) |
| IRS4 | 5 (2%) | 281 |
0.698 (1.00) |
0.998 (1.00) |
1 (1.00) |
0.208 (1.00) |
0.379 (1.00) |
1 (1.00) |
1 (1.00) |
0.236 (1.00) |
| HTRA2 | 4 (1%) | 282 |
0.84 (1.00) |
0.0763 (1.00) |
0.632 (1.00) |
0.566 (1.00) |
0.322 (1.00) |
1 (1.00) |
0.193 (1.00) |
|
| EIF1AX | 4 (1%) | 282 |
0.377 (1.00) |
0.971 (1.00) |
0.132 (1.00) |
0.894 (1.00) |
0.187 (1.00) |
0.585 (1.00) |
1 (1.00) |
1 (1.00) |
| FAM47C | 7 (2%) | 279 |
0.167 (1.00) |
0.923 (1.00) |
1 (1.00) |
0.568 (1.00) |
0.0717 (1.00) |
1 (1.00) |
1 (1.00) |
0.315 (1.00) |
| DDX5 | 4 (1%) | 282 |
0.567 (1.00) |
0.872 (1.00) |
0.632 (1.00) |
0.309 (1.00) |
0.681 (1.00) |
1 (1.00) |
1 (1.00) |
0.149 (1.00) |
| ZNF709 | 3 (1%) | 283 |
0.556 (1.00) |
0.56 (1.00) |
0.257 (1.00) |
0.491 (1.00) |
0.212 (1.00) |
0.134 (1.00) |
1 (1.00) |
|
| TRERF1 | 3 (1%) | 283 |
0.731 (1.00) |
0.702 (1.00) |
0.0864 (1.00) |
0.363 (1.00) |
0.557 (1.00) |
1 (1.00) |
1 (1.00) |
|
| BCOR | 9 (3%) | 277 |
0.992 (1.00) |
0.158 (1.00) |
0.0828 (1.00) |
0.28 (1.00) |
0.477 (1.00) |
0.728 (1.00) |
0.351 (1.00) |
1 (1.00) |
| SRPX | 3 (1%) | 283 |
0.485 (1.00) |
0.105 (1.00) |
0.0864 (1.00) |
0.783 (1.00) |
1 (1.00) |
1 (1.00) |
1 (1.00) |
|
| DOCK5 | 5 (2%) | 281 |
0.00788 (1.00) |
0.0213 (1.00) |
1 (1.00) |
0.696 (1.00) |
1 (1.00) |
0.636 (1.00) |
1 (1.00) |
1 (1.00) |
| GIGYF2 | 4 (1%) | 282 |
0.00162 (0.438) |
0.715 (1.00) |
1 (1.00) |
0.827 (1.00) |
0.0801 (1.00) |
1 (1.00) |
1 (1.00) |
|
| NIPBL | 5 (2%) | 281 |
0.0909 (1.00) |
0.029 (1.00) |
0.386 (1.00) |
0.183 (1.00) |
1 (1.00) |
1 (1.00) |
0.236 (1.00) |
|
| ZBTB20 | 13 (5%) | 273 |
0.371 (1.00) |
0.614 (1.00) |
0.398 (1.00) |
0.99 (1.00) |
0.369 (1.00) |
0.117 (1.00) |
0.14 (1.00) |
0.481 (1.00) |
| TRIP12 | 5 (2%) | 281 |
0.217 (1.00) |
0.66 (1.00) |
1 (1.00) |
0.153 (1.00) |
0.158 (1.00) |
1 (1.00) |
1 (1.00) |
|
| KIAA0664 | 5 (2%) | 281 |
0.981 (1.00) |
0.943 (1.00) |
1 (1.00) |
0.223 (1.00) |
0.158 (1.00) |
1 (1.00) |
1 (1.00) |
P value = 2.35e-10 (logrank test), Q value = 6.7e-08
Table S1. Gene #1: 'IDH1 MUTATION STATUS' versus Clinical Feature #1: 'Time to Death'
| nPatients | nDeath | Duration Range (Median), Month | |
|---|---|---|---|
| ALL | 284 | 59 | 0.0 - 182.3 (15.6) |
| IDH1 MUTATED | 216 | 32 | 0.0 - 182.3 (17.1) |
| IDH1 WILD-TYPE | 68 | 27 | 0.1 - 133.7 (11.6) |
Figure S1. Get High-res Image Gene #1: 'IDH1 MUTATION STATUS' versus Clinical Feature #1: 'Time to Death'
P value = 0.000853 (Wilcoxon-test), Q value = 0.23
Table S2. Gene #1: 'IDH1 MUTATION STATUS' versus Clinical Feature #2: 'AGE'
| nPatients | Mean (Std.Dev) | |
|---|---|---|
| ALL | 286 | 42.6 (13.5) |
| IDH1 MUTATED | 218 | 40.9 (12.6) |
| IDH1 WILD-TYPE | 68 | 47.8 (14.9) |
Figure S2. Get High-res Image Gene #1: 'IDH1 MUTATION STATUS' versus Clinical Feature #2: 'AGE'
P value = 1.53e-06 (Wilcoxon-test), Q value = 0.00043
Table S3. Gene #2: 'TP53 MUTATION STATUS' versus Clinical Feature #2: 'AGE'
| nPatients | Mean (Std.Dev) | |
|---|---|---|
| ALL | 286 | 42.6 (13.5) |
| TP53 MUTATED | 145 | 38.7 (11.7) |
| TP53 WILD-TYPE | 141 | 46.6 (14.0) |
Figure S3. Get High-res Image Gene #2: 'TP53 MUTATION STATUS' versus Clinical Feature #2: 'AGE'
P value = 1e-05 (Fisher's exact test), Q value = 0.0028
Table S4. Gene #2: 'TP53 MUTATION STATUS' versus Clinical Feature #5: 'HISTOLOGICAL.TYPE'
| nPatients | ASTROCYTOMA | OLIGOASTROCYTOMA | OLIGODENDROGLIOMA |
|---|---|---|---|
| ALL | 97 | 76 | 113 |
| TP53 MUTATED | 65 | 50 | 30 |
| TP53 WILD-TYPE | 32 | 26 | 83 |
Figure S4. Get High-res Image Gene #2: 'TP53 MUTATION STATUS' versus Clinical Feature #5: 'HISTOLOGICAL.TYPE'
P value = 1.94e-07 (Wilcoxon-test), Q value = 5.5e-05
Table S5. Gene #3: 'ATRX MUTATION STATUS' versus Clinical Feature #2: 'AGE'
| nPatients | Mean (Std.Dev) | |
|---|---|---|
| ALL | 286 | 42.6 (13.5) |
| ATRX MUTATED | 118 | 37.6 (11.4) |
| ATRX WILD-TYPE | 168 | 46.1 (13.7) |
Figure S5. Get High-res Image Gene #3: 'ATRX MUTATION STATUS' versus Clinical Feature #2: 'AGE'
P value = 1e-05 (Fisher's exact test), Q value = 0.0028
Table S6. Gene #3: 'ATRX MUTATION STATUS' versus Clinical Feature #5: 'HISTOLOGICAL.TYPE'
| nPatients | ASTROCYTOMA | OLIGOASTROCYTOMA | OLIGODENDROGLIOMA |
|---|---|---|---|
| ALL | 97 | 76 | 113 |
| ATRX MUTATED | 49 | 43 | 26 |
| ATRX WILD-TYPE | 48 | 33 | 87 |
Figure S6. Get High-res Image Gene #3: 'ATRX MUTATION STATUS' versus Clinical Feature #5: 'HISTOLOGICAL.TYPE'
P value = 1e-05 (Fisher's exact test), Q value = 0.0028
Table S7. Gene #4: 'CIC MUTATION STATUS' versus Clinical Feature #5: 'HISTOLOGICAL.TYPE'
| nPatients | ASTROCYTOMA | OLIGOASTROCYTOMA | OLIGODENDROGLIOMA |
|---|---|---|---|
| ALL | 97 | 76 | 113 |
| CIC MUTATED | 1 | 9 | 43 |
| CIC WILD-TYPE | 96 | 67 | 70 |
Figure S7. Get High-res Image Gene #4: 'CIC MUTATION STATUS' versus Clinical Feature #5: 'HISTOLOGICAL.TYPE'
P value = 4e-05 (Fisher's exact test), Q value = 0.011
Table S8. Gene #5: 'NOTCH1 MUTATION STATUS' versus Clinical Feature #5: 'HISTOLOGICAL.TYPE'
| nPatients | ASTROCYTOMA | OLIGOASTROCYTOMA | OLIGODENDROGLIOMA |
|---|---|---|---|
| ALL | 97 | 76 | 113 |
| NOTCH1 MUTATED | 3 | 3 | 23 |
| NOTCH1 WILD-TYPE | 94 | 73 | 90 |
Figure S8. Get High-res Image Gene #5: 'NOTCH1 MUTATION STATUS' versus Clinical Feature #5: 'HISTOLOGICAL.TYPE'
P value = 1e-05 (Fisher's exact test), Q value = 0.0028
Table S9. Gene #7: 'FUBP1 MUTATION STATUS' versus Clinical Feature #5: 'HISTOLOGICAL.TYPE'
| nPatients | ASTROCYTOMA | OLIGOASTROCYTOMA | OLIGODENDROGLIOMA |
|---|---|---|---|
| ALL | 97 | 76 | 113 |
| FUBP1 MUTATED | 1 | 3 | 22 |
| FUBP1 WILD-TYPE | 96 | 73 | 91 |
Figure S9. Get High-res Image Gene #7: 'FUBP1 MUTATION STATUS' versus Clinical Feature #5: 'HISTOLOGICAL.TYPE'
P value = 0.000627 (logrank test), Q value = 0.17
Table S10. Gene #8: 'NF1 MUTATION STATUS' versus Clinical Feature #1: 'Time to Death'
| nPatients | nDeath | Duration Range (Median), Month | |
|---|---|---|---|
| ALL | 284 | 59 | 0.0 - 182.3 (15.6) |
| NF1 MUTATED | 19 | 8 | 0.2 - 73.0 (18.0) |
| NF1 WILD-TYPE | 265 | 51 | 0.0 - 182.3 (15.5) |
Figure S10. Get High-res Image Gene #8: 'NF1 MUTATION STATUS' versus Clinical Feature #1: 'Time to Death'
P value = 2.18e-10 (logrank test), Q value = 6.2e-08
Table S11. Gene #11: 'PTEN MUTATION STATUS' versus Clinical Feature #1: 'Time to Death'
| nPatients | nDeath | Duration Range (Median), Month | |
|---|---|---|---|
| ALL | 284 | 59 | 0.0 - 182.3 (15.6) |
| PTEN MUTATED | 13 | 7 | 0.5 - 21.0 (10.4) |
| PTEN WILD-TYPE | 271 | 52 | 0.0 - 182.3 (16.1) |
Figure S11. Get High-res Image Gene #11: 'PTEN MUTATION STATUS' versus Clinical Feature #1: 'Time to Death'
P value = 0.000651 (Wilcoxon-test), Q value = 0.18
Table S12. Gene #11: 'PTEN MUTATION STATUS' versus Clinical Feature #2: 'AGE'
| nPatients | Mean (Std.Dev) | |
|---|---|---|
| ALL | 286 | 42.6 (13.5) |
| PTEN MUTATED | 13 | 55.3 (10.5) |
| PTEN WILD-TYPE | 273 | 42.0 (13.3) |
Figure S12. Get High-res Image Gene #11: 'PTEN MUTATION STATUS' versus Clinical Feature #2: 'AGE'
P value = 0 (logrank test), Q value = 0
Table S13. Gene #14: 'EGFR MUTATION STATUS' versus Clinical Feature #1: 'Time to Death'
| nPatients | nDeath | Duration Range (Median), Month | |
|---|---|---|---|
| ALL | 284 | 59 | 0.0 - 182.3 (15.6) |
| EGFR MUTATED | 16 | 9 | 0.5 - 13.6 (6.6) |
| EGFR WILD-TYPE | 268 | 50 | 0.0 - 182.3 (16.7) |
Figure S13. Get High-res Image Gene #14: 'EGFR MUTATION STATUS' versus Clinical Feature #1: 'Time to Death'
P value = 1.84e-07 (Wilcoxon-test), Q value = 5.2e-05
Table S14. Gene #14: 'EGFR MUTATION STATUS' versus Clinical Feature #2: 'AGE'
| nPatients | Mean (Std.Dev) | |
|---|---|---|
| ALL | 286 | 42.6 (13.5) |
| EGFR MUTATED | 16 | 61.1 (7.3) |
| EGFR WILD-TYPE | 270 | 41.5 (12.9) |
Figure S14. Get High-res Image Gene #14: 'EGFR MUTATION STATUS' versus Clinical Feature #2: 'AGE'
P value = 1.93e-06 (logrank test), Q value = 0.00054
Table S15. Gene #26: 'PLCG1 MUTATION STATUS' versus Clinical Feature #1: 'Time to Death'
| nPatients | nDeath | Duration Range (Median), Month | |
|---|---|---|---|
| ALL | 284 | 59 | 0.0 - 182.3 (15.6) |
| PLCG1 MUTATED | 4 | 3 | 6.7 - 21.0 (7.2) |
| PLCG1 WILD-TYPE | 280 | 56 | 0.0 - 182.3 (15.9) |
Figure S15. Get High-res Image Gene #26: 'PLCG1 MUTATION STATUS' versus Clinical Feature #1: 'Time to Death'

-
Mutation data file = transformed.cor.cli.txt
-
Clinical data file = LGG-TP.merged_data.txt
-
Number of patients = 286
-
Number of significantly mutated genes = 37
-
Number of selected clinical features = 8
-
Exclude genes that fewer than K tumors have mutations, K = 3
For survival clinical features, the Kaplan-Meier survival curves of tumors with and without gene mutations were plotted and the statistical significance P values were estimated by logrank test (Bland and Altman 2004) using the 'survdiff' function in R
For binary or multi-class clinical features (nominal or ordinal), two-tailed Fisher's exact tests (Fisher 1922) were used to estimate the P values using the 'fisher.test' function in R
For multiple hypothesis correction, Q value is the False Discovery Rate (FDR) analogue of the P value (Benjamini and Hochberg 1995), defined as the minimum FDR at which the test may be called significant. We used the 'Benjamini and Hochberg' method of 'p.adjust' function in R to convert P values into Q values.
In addition to the links below, the full results of the analysis summarized in this report can also be downloaded programmatically using firehose_get, or interactively from either the Broad GDAC website or TCGA Data Coordination Center Portal.