This pipeline computes the correlation between cancer subtypes identified by different molecular patterns and selected clinical features.
Testing the association between subtypes identified by 8 different clustering approaches and 11 clinical features across 317 patients, 10 significant findings detected with P value < 0.05 and Q value < 0.25.
-
3 subtypes identified in current cancer cohort by 'Copy Number Ratio CNMF subtypes'. These subtypes do not correlate to any clinical features.
-
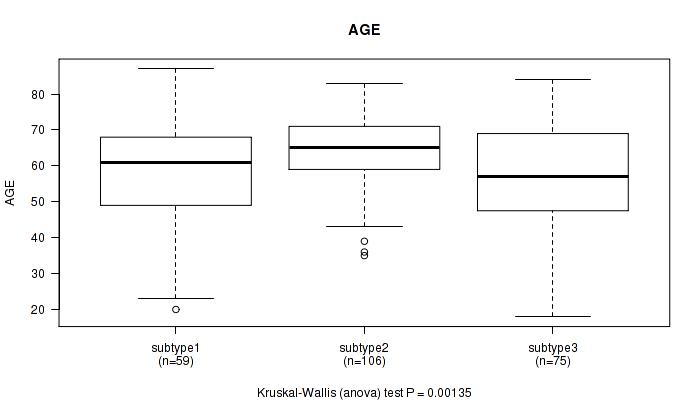
3 subtypes identified in current cancer cohort by 'METHLYATION CNMF'. These subtypes correlate to 'AGE'.
-
CNMF clustering analysis on sequencing-based mRNA expression data identified 6 subtypes that correlate to 'AGE' and 'GENDER'.
-
Consensus hierarchical clustering analysis on sequencing-based mRNA expression data identified 3 subtypes that correlate to 'PATHOLOGY.T.STAGE', 'GENDER', and 'RACE'.
-
4 subtypes identified in current cancer cohort by 'MIRSEQ CNMF'. These subtypes do not correlate to any clinical features.
-
5 subtypes identified in current cancer cohort by 'MIRSEQ CHIERARCHICAL'. These subtypes correlate to 'AGE'.
-
4 subtypes identified in current cancer cohort by 'MIRseq Mature CNMF subtypes'. These subtypes correlate to 'AGE' and 'NEOPLASM.DISEASESTAGE'.
-
5 subtypes identified in current cancer cohort by 'MIRseq Mature cHierClus subtypes'. These subtypes correlate to 'AGE'.
Table 1. Get Full Table Overview of the association between subtypes identified by 8 different clustering approaches and 11 clinical features. Shown in the table are P values (Q values). Thresholded by P value < 0.05 and Q value < 0.25, 10 significant findings detected.
|
Clinical Features |
Statistical Tests |
Copy Number Ratio CNMF subtypes |
METHLYATION CNMF |
RNAseq CNMF subtypes |
RNAseq cHierClus subtypes |
MIRSEQ CNMF |
MIRSEQ CHIERARCHICAL |
MIRseq Mature CNMF subtypes |
MIRseq Mature cHierClus subtypes |
| Time to Death | logrank test |
0.12 (1.00) |
0.332 (1.00) |
0.312 (1.00) |
0.464 (1.00) |
0.356 (1.00) |
0.024 (1.00) |
0.0622 (1.00) |
0.00488 (0.371) |
| AGE | Kruskal-Wallis (anova) |
0.075 (1.00) |
0.00135 (0.11) |
0.00116 (0.0954) |
0.0041 (0.32) |
0.00585 (0.433) |
1.54e-05 (0.00134) |
0.00218 (0.174) |
1.07e-05 (0.000943) |
| NEOPLASM DISEASESTAGE | Fisher's exact test |
0.177 (1.00) |
0.789 (1.00) |
0.0739 (1.00) |
0.0125 (0.91) |
0.191 (1.00) |
0.868 (1.00) |
0.00297 (0.235) |
0.0904 (1.00) |
| PATHOLOGY T STAGE | Fisher's exact test |
0.121 (1.00) |
0.586 (1.00) |
0.0581 (1.00) |
0.00031 (0.0257) |
0.677 (1.00) |
0.855 (1.00) |
0.0245 (1.00) |
0.095 (1.00) |
| PATHOLOGY N STAGE | Fisher's exact test |
1 (1.00) |
1 (1.00) |
0.304 (1.00) |
0.385 (1.00) |
0.758 (1.00) |
1 (1.00) |
0.191 (1.00) |
0.943 (1.00) |
| PATHOLOGY M STAGE | Fisher's exact test |
0.813 (1.00) |
0.217 (1.00) |
0.0496 (1.00) |
0.209 (1.00) |
0.019 (1.00) |
0.0931 (1.00) |
0.0173 (1.00) |
0.101 (1.00) |
| GENDER | Fisher's exact test |
0.106 (1.00) |
0.0947 (1.00) |
6e-05 (0.00516) |
0.00022 (0.0187) |
0.51 (1.00) |
0.0741 (1.00) |
0.13 (1.00) |
0.166 (1.00) |
| HISTOLOGICAL TYPE | Fisher's exact test |
0.536 (1.00) |
0.174 (1.00) |
0.0316 (1.00) |
0.679 (1.00) |
0.147 (1.00) |
0.922 (1.00) |
0.192 (1.00) |
0.815 (1.00) |
| COMPLETENESS OF RESECTION | Fisher's exact test |
0.0697 (1.00) |
0.74 (1.00) |
0.043 (1.00) |
0.503 (1.00) |
0.75 (1.00) |
0.311 (1.00) |
0.233 (1.00) |
0.221 (1.00) |
| RACE | Fisher's exact test |
0.0396 (1.00) |
0.00465 (0.358) |
0.0278 (1.00) |
0.00026 (0.0218) |
0.274 (1.00) |
0.0393 (1.00) |
0.844 (1.00) |
0.00564 (0.423) |
| ETHNICITY | Fisher's exact test |
0.326 (1.00) |
0.464 (1.00) |
0.355 (1.00) |
0.376 (1.00) |
0.201 (1.00) |
0.538 (1.00) |
1 (1.00) |
0.696 (1.00) |
Table S1. Description of clustering approach #1: 'Copy Number Ratio CNMF subtypes'
| Cluster Labels | 1 | 2 | 3 |
|---|---|---|---|
| Number of samples | 93 | 106 | 112 |
P value = 0.12 (logrank test), Q value = 1
Table S2. Clustering Approach #1: 'Copy Number Ratio CNMF subtypes' versus Clinical Feature #1: 'Time to Death'
| nPatients | nDeath | Duration Range (Median), Month | |
|---|---|---|---|
| ALL | 292 | 92 | 0.0 - 113.0 (14.5) |
| subtype1 | 92 | 28 | 0.1 - 101.0 (14.4) |
| subtype2 | 94 | 34 | 0.0 - 113.0 (13.8) |
| subtype3 | 106 | 30 | 0.1 - 108.8 (17.1) |
Figure S1. Get High-res Image Clustering Approach #1: 'Copy Number Ratio CNMF subtypes' versus Clinical Feature #1: 'Time to Death'

P value = 0.075 (Kruskal-Wallis (anova)), Q value = 1
Table S3. Clustering Approach #1: 'Copy Number Ratio CNMF subtypes' versus Clinical Feature #2: 'AGE'
| nPatients | Mean (Std.Dev) | |
|---|---|---|
| ALL | 308 | 59.8 (12.7) |
| subtype1 | 92 | 61.3 (11.7) |
| subtype2 | 104 | 57.6 (12.8) |
| subtype3 | 112 | 60.6 (13.1) |
Figure S2. Get High-res Image Clustering Approach #1: 'Copy Number Ratio CNMF subtypes' versus Clinical Feature #2: 'AGE'

P value = 0.177 (Fisher's exact test), Q value = 1
Table S4. Clustering Approach #1: 'Copy Number Ratio CNMF subtypes' versus Clinical Feature #3: 'NEOPLASM.DISEASESTAGE'
| nPatients | STAGE I | STAGE II | STAGE III | STAGE IIIA | STAGE IIIB | STAGE IIIC | STAGE IV | STAGE IVA | STAGE IVB |
|---|---|---|---|---|---|---|---|---|---|
| ALL | 146 | 72 | 2 | 52 | 7 | 7 | 2 | 1 | 2 |
| subtype1 | 51 | 20 | 0 | 14 | 0 | 0 | 1 | 1 | 0 |
| subtype2 | 41 | 30 | 1 | 20 | 3 | 2 | 1 | 0 | 1 |
| subtype3 | 54 | 22 | 1 | 18 | 4 | 5 | 0 | 0 | 1 |
Figure S3. Get High-res Image Clustering Approach #1: 'Copy Number Ratio CNMF subtypes' versus Clinical Feature #3: 'NEOPLASM.DISEASESTAGE'

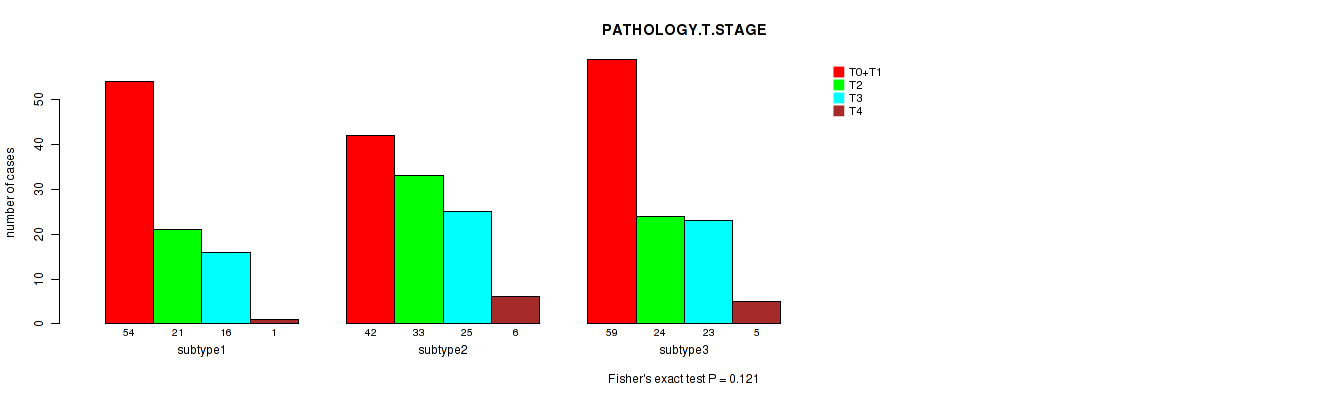
P value = 0.121 (Fisher's exact test), Q value = 1
Table S5. Clustering Approach #1: 'Copy Number Ratio CNMF subtypes' versus Clinical Feature #4: 'PATHOLOGY.T.STAGE'
| nPatients | T0+T1 | T2 | T3 | T4 |
|---|---|---|---|---|
| ALL | 155 | 78 | 64 | 12 |
| subtype1 | 54 | 21 | 16 | 1 |
| subtype2 | 42 | 33 | 25 | 6 |
| subtype3 | 59 | 24 | 23 | 5 |
Figure S4. Get High-res Image Clustering Approach #1: 'Copy Number Ratio CNMF subtypes' versus Clinical Feature #4: 'PATHOLOGY.T.STAGE'
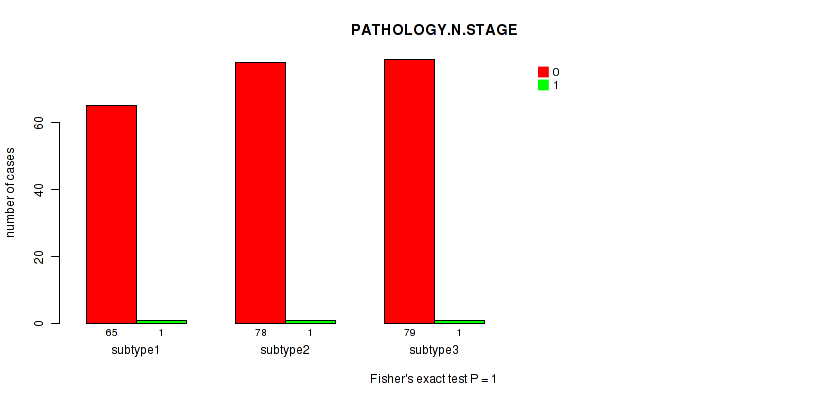
P value = 1 (Fisher's exact test), Q value = 1
Table S6. Clustering Approach #1: 'Copy Number Ratio CNMF subtypes' versus Clinical Feature #5: 'PATHOLOGY.N.STAGE'
| nPatients | 0 | 1 |
|---|---|---|
| ALL | 222 | 3 |
| subtype1 | 65 | 1 |
| subtype2 | 78 | 1 |
| subtype3 | 79 | 1 |
Figure S5. Get High-res Image Clustering Approach #1: 'Copy Number Ratio CNMF subtypes' versus Clinical Feature #5: 'PATHOLOGY.N.STAGE'
P value = 0.813 (Fisher's exact test), Q value = 1
Table S7. Clustering Approach #1: 'Copy Number Ratio CNMF subtypes' versus Clinical Feature #6: 'PATHOLOGY.M.STAGE'
| nPatients | M0 | M1 | MX |
|---|---|---|---|
| ALL | 238 | 4 | 69 |
| subtype1 | 71 | 1 | 21 |
| subtype2 | 84 | 2 | 20 |
| subtype3 | 83 | 1 | 28 |
Figure S6. Get High-res Image Clustering Approach #1: 'Copy Number Ratio CNMF subtypes' versus Clinical Feature #6: 'PATHOLOGY.M.STAGE'

P value = 0.106 (Fisher's exact test), Q value = 1
Table S8. Clustering Approach #1: 'Copy Number Ratio CNMF subtypes' versus Clinical Feature #7: 'GENDER'
| nPatients | FEMALE | MALE |
|---|---|---|
| ALL | 100 | 211 |
| subtype1 | 22 | 71 |
| subtype2 | 38 | 68 |
| subtype3 | 40 | 72 |
Figure S7. Get High-res Image Clustering Approach #1: 'Copy Number Ratio CNMF subtypes' versus Clinical Feature #7: 'GENDER'

P value = 0.536 (Fisher's exact test), Q value = 1
Table S9. Clustering Approach #1: 'Copy Number Ratio CNMF subtypes' versus Clinical Feature #8: 'HISTOLOGICAL.TYPE'
| nPatients | FIBROLAMELLAR CARCINOMA | HEPATOCELLULAR CARCINOMA | HEPATOCHOLANGIOCARCINOMA (MIXED) |
|---|---|---|---|
| ALL | 2 | 303 | 6 |
| subtype1 | 0 | 92 | 1 |
| subtype2 | 0 | 103 | 3 |
| subtype3 | 2 | 108 | 2 |
Figure S8. Get High-res Image Clustering Approach #1: 'Copy Number Ratio CNMF subtypes' versus Clinical Feature #8: 'HISTOLOGICAL.TYPE'

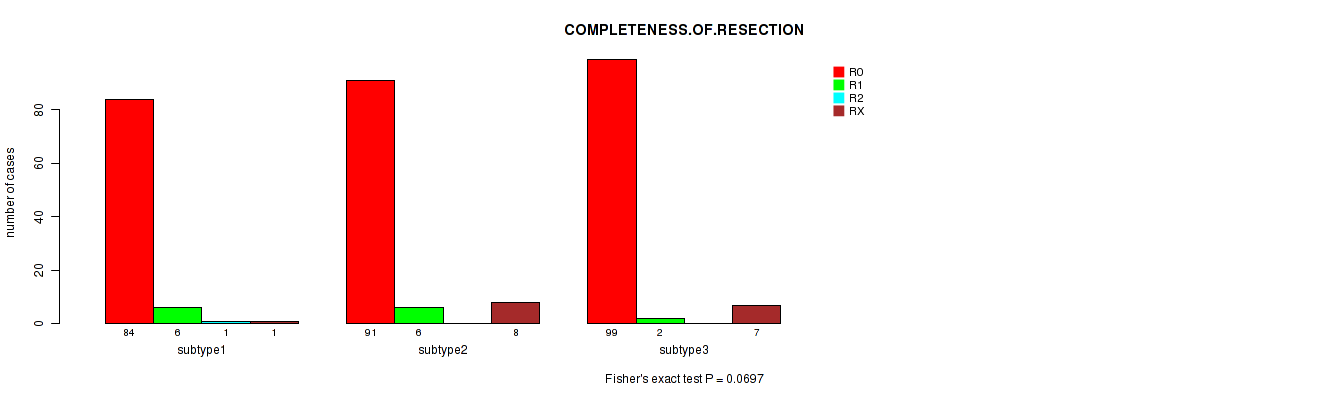
P value = 0.0697 (Fisher's exact test), Q value = 1
Table S10. Clustering Approach #1: 'Copy Number Ratio CNMF subtypes' versus Clinical Feature #9: 'COMPLETENESS.OF.RESECTION'
| nPatients | R0 | R1 | R2 | RX |
|---|---|---|---|---|
| ALL | 274 | 14 | 1 | 16 |
| subtype1 | 84 | 6 | 1 | 1 |
| subtype2 | 91 | 6 | 0 | 8 |
| subtype3 | 99 | 2 | 0 | 7 |
Figure S9. Get High-res Image Clustering Approach #1: 'Copy Number Ratio CNMF subtypes' versus Clinical Feature #9: 'COMPLETENESS.OF.RESECTION'
P value = 0.0396 (Fisher's exact test), Q value = 1
Table S11. Clustering Approach #1: 'Copy Number Ratio CNMF subtypes' versus Clinical Feature #10: 'RACE'
| nPatients | AMERICAN INDIAN OR ALASKA NATIVE | ASIAN | BLACK OR AFRICAN AMERICAN | WHITE |
|---|---|---|---|---|
| ALL | 1 | 141 | 15 | 145 |
| subtype1 | 1 | 45 | 4 | 39 |
| subtype2 | 0 | 58 | 4 | 43 |
| subtype3 | 0 | 38 | 7 | 63 |
Figure S10. Get High-res Image Clustering Approach #1: 'Copy Number Ratio CNMF subtypes' versus Clinical Feature #10: 'RACE'

P value = 0.326 (Fisher's exact test), Q value = 1
Table S12. Clustering Approach #1: 'Copy Number Ratio CNMF subtypes' versus Clinical Feature #11: 'ETHNICITY'
| nPatients | HISPANIC OR LATINO | NOT HISPANIC OR LATINO |
|---|---|---|
| ALL | 8 | 287 |
| subtype1 | 4 | 84 |
| subtype2 | 3 | 100 |
| subtype3 | 1 | 103 |
Figure S11. Get High-res Image Clustering Approach #1: 'Copy Number Ratio CNMF subtypes' versus Clinical Feature #11: 'ETHNICITY'

Table S13. Description of clustering approach #2: 'METHLYATION CNMF'
| Cluster Labels | 1 | 2 | 3 |
|---|---|---|---|
| Number of samples | 59 | 108 | 76 |
P value = 0.332 (logrank test), Q value = 1
Table S14. Clustering Approach #2: 'METHLYATION CNMF' versus Clinical Feature #1: 'Time to Death'
| nPatients | nDeath | Duration Range (Median), Month | |
|---|---|---|---|
| ALL | 222 | 84 | 0.0 - 113.0 (13.7) |
| subtype1 | 53 | 18 | 0.1 - 108.8 (13.9) |
| subtype2 | 100 | 38 | 0.0 - 102.7 (13.6) |
| subtype3 | 69 | 28 | 0.1 - 113.0 (13.5) |
Figure S12. Get High-res Image Clustering Approach #2: 'METHLYATION CNMF' versus Clinical Feature #1: 'Time to Death'

P value = 0.00135 (Kruskal-Wallis (anova)), Q value = 0.11
Table S15. Clustering Approach #2: 'METHLYATION CNMF' versus Clinical Feature #2: 'AGE'
| nPatients | Mean (Std.Dev) | |
|---|---|---|
| ALL | 240 | 60.4 (13.7) |
| subtype1 | 59 | 58.0 (15.2) |
| subtype2 | 106 | 64.3 (10.1) |
| subtype3 | 75 | 56.7 (15.4) |
Figure S13. Get High-res Image Clustering Approach #2: 'METHLYATION CNMF' versus Clinical Feature #2: 'AGE'
P value = 0.789 (Fisher's exact test), Q value = 1
Table S16. Clustering Approach #2: 'METHLYATION CNMF' versus Clinical Feature #3: 'NEOPLASM.DISEASESTAGE'
| nPatients | STAGE I | STAGE II | STAGE III | STAGE IIIA | STAGE IIIB | STAGE IIIC | STAGE IV | STAGE IVA | STAGE IVB |
|---|---|---|---|---|---|---|---|---|---|
| ALL | 91 | 57 | 2 | 52 | 7 | 9 | 2 | 1 | 2 |
| subtype1 | 24 | 11 | 0 | 15 | 3 | 4 | 0 | 0 | 0 |
| subtype2 | 42 | 27 | 1 | 20 | 3 | 3 | 0 | 1 | 1 |
| subtype3 | 25 | 19 | 1 | 17 | 1 | 2 | 2 | 0 | 1 |
Figure S14. Get High-res Image Clustering Approach #2: 'METHLYATION CNMF' versus Clinical Feature #3: 'NEOPLASM.DISEASESTAGE'

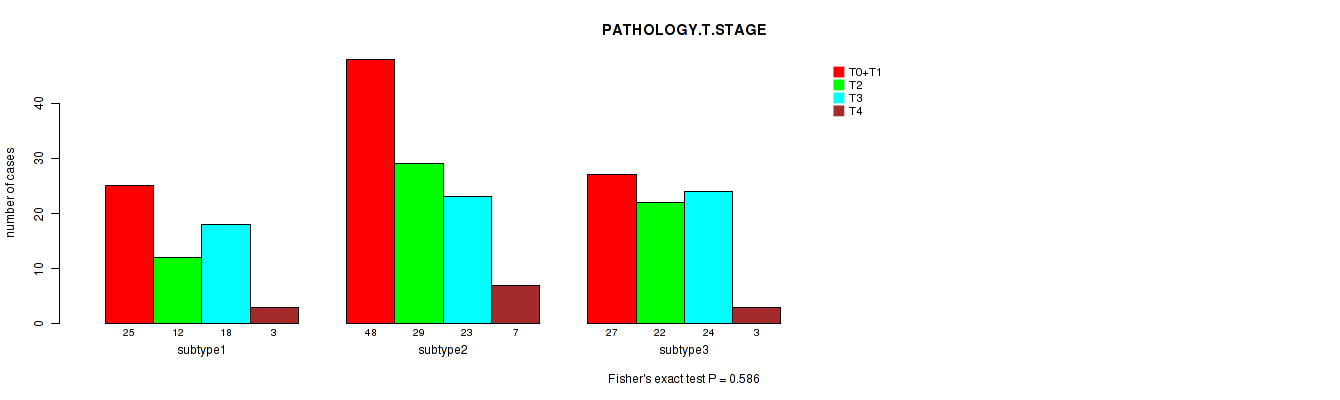
P value = 0.586 (Fisher's exact test), Q value = 1
Table S17. Clustering Approach #2: 'METHLYATION CNMF' versus Clinical Feature #4: 'PATHOLOGY.T.STAGE'
| nPatients | T0+T1 | T2 | T3 | T4 |
|---|---|---|---|---|
| ALL | 100 | 63 | 65 | 13 |
| subtype1 | 25 | 12 | 18 | 3 |
| subtype2 | 48 | 29 | 23 | 7 |
| subtype3 | 27 | 22 | 24 | 3 |
Figure S15. Get High-res Image Clustering Approach #2: 'METHLYATION CNMF' versus Clinical Feature #4: 'PATHOLOGY.T.STAGE'
P value = 1 (Fisher's exact test), Q value = 1
Table S18. Clustering Approach #2: 'METHLYATION CNMF' versus Clinical Feature #5: 'PATHOLOGY.N.STAGE'
| nPatients | 0 | 1 |
|---|---|---|
| ALL | 153 | 4 |
| subtype1 | 43 | 1 |
| subtype2 | 60 | 2 |
| subtype3 | 50 | 1 |
Figure S16. Get High-res Image Clustering Approach #2: 'METHLYATION CNMF' versus Clinical Feature #5: 'PATHOLOGY.N.STAGE'

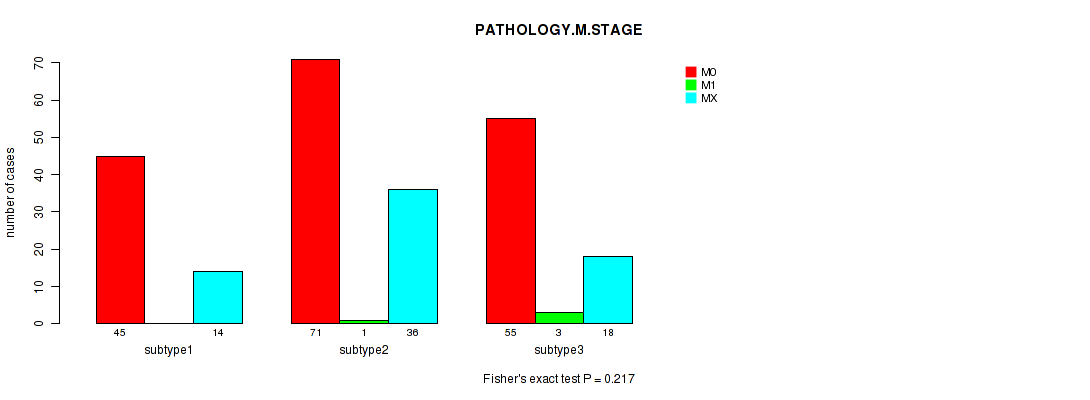
P value = 0.217 (Fisher's exact test), Q value = 1
Table S19. Clustering Approach #2: 'METHLYATION CNMF' versus Clinical Feature #6: 'PATHOLOGY.M.STAGE'
| nPatients | M0 | M1 | MX |
|---|---|---|---|
| ALL | 171 | 4 | 68 |
| subtype1 | 45 | 0 | 14 |
| subtype2 | 71 | 1 | 36 |
| subtype3 | 55 | 3 | 18 |
Figure S17. Get High-res Image Clustering Approach #2: 'METHLYATION CNMF' versus Clinical Feature #6: 'PATHOLOGY.M.STAGE'
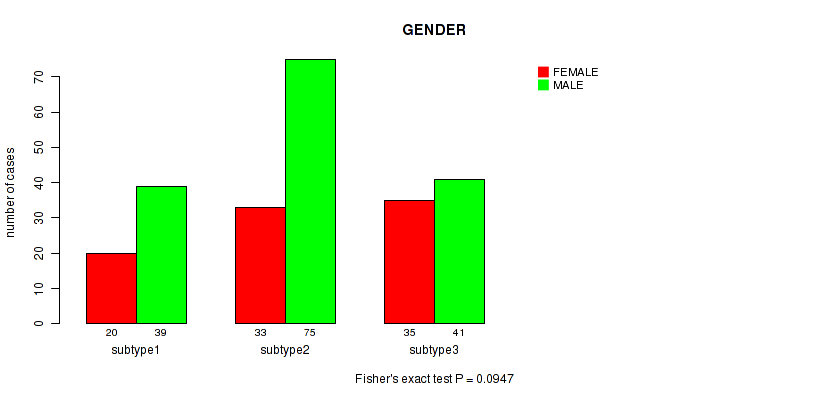
P value = 0.0947 (Fisher's exact test), Q value = 1
Table S20. Clustering Approach #2: 'METHLYATION CNMF' versus Clinical Feature #7: 'GENDER'
| nPatients | FEMALE | MALE |
|---|---|---|
| ALL | 88 | 155 |
| subtype1 | 20 | 39 |
| subtype2 | 33 | 75 |
| subtype3 | 35 | 41 |
Figure S18. Get High-res Image Clustering Approach #2: 'METHLYATION CNMF' versus Clinical Feature #7: 'GENDER'
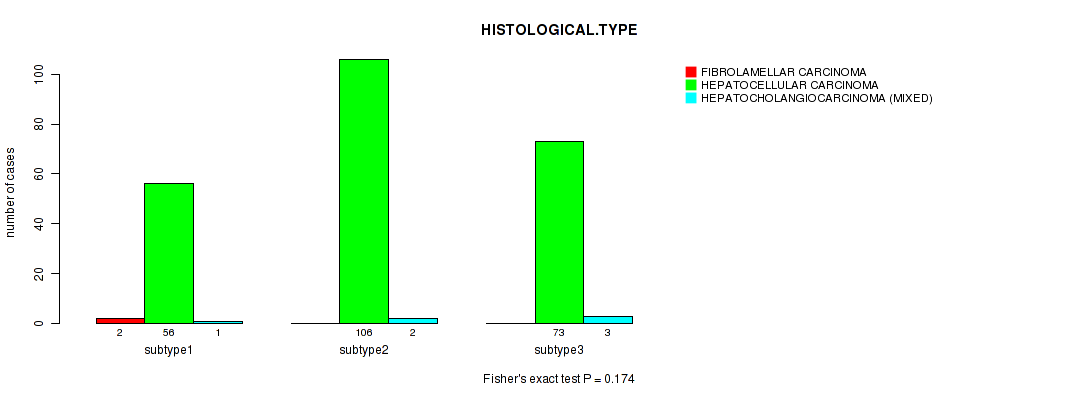
P value = 0.174 (Fisher's exact test), Q value = 1
Table S21. Clustering Approach #2: 'METHLYATION CNMF' versus Clinical Feature #8: 'HISTOLOGICAL.TYPE'
| nPatients | FIBROLAMELLAR CARCINOMA | HEPATOCELLULAR CARCINOMA | HEPATOCHOLANGIOCARCINOMA (MIXED) |
|---|---|---|---|
| ALL | 2 | 235 | 6 |
| subtype1 | 2 | 56 | 1 |
| subtype2 | 0 | 106 | 2 |
| subtype3 | 0 | 73 | 3 |
Figure S19. Get High-res Image Clustering Approach #2: 'METHLYATION CNMF' versus Clinical Feature #8: 'HISTOLOGICAL.TYPE'
P value = 0.74 (Fisher's exact test), Q value = 1
Table S22. Clustering Approach #2: 'METHLYATION CNMF' versus Clinical Feature #9: 'COMPLETENESS.OF.RESECTION'
| nPatients | R0 | R1 | R2 | RX |
|---|---|---|---|---|
| ALL | 206 | 13 | 1 | 17 |
| subtype1 | 48 | 2 | 0 | 6 |
| subtype2 | 92 | 6 | 0 | 7 |
| subtype3 | 66 | 5 | 1 | 4 |
Figure S20. Get High-res Image Clustering Approach #2: 'METHLYATION CNMF' versus Clinical Feature #9: 'COMPLETENESS.OF.RESECTION'

P value = 0.00465 (Fisher's exact test), Q value = 0.36
Table S23. Clustering Approach #2: 'METHLYATION CNMF' versus Clinical Feature #10: 'RACE'
| nPatients | AMERICAN INDIAN OR ALASKA NATIVE | ASIAN | BLACK OR AFRICAN AMERICAN | WHITE |
|---|---|---|---|---|
| ALL | 1 | 71 | 15 | 147 |
| subtype1 | 0 | 16 | 6 | 34 |
| subtype2 | 1 | 22 | 8 | 74 |
| subtype3 | 0 | 33 | 1 | 39 |
Figure S21. Get High-res Image Clustering Approach #2: 'METHLYATION CNMF' versus Clinical Feature #10: 'RACE'

P value = 0.464 (Fisher's exact test), Q value = 1
Table S24. Clustering Approach #2: 'METHLYATION CNMF' versus Clinical Feature #11: 'ETHNICITY'
| nPatients | HISPANIC OR LATINO | NOT HISPANIC OR LATINO |
|---|---|---|
| ALL | 9 | 218 |
| subtype1 | 3 | 52 |
| subtype2 | 2 | 96 |
| subtype3 | 4 | 70 |
Figure S22. Get High-res Image Clustering Approach #2: 'METHLYATION CNMF' versus Clinical Feature #11: 'ETHNICITY'

Table S25. Description of clustering approach #3: 'RNAseq CNMF subtypes'
| Cluster Labels | 1 | 2 | 3 | 4 | 5 | 6 |
|---|---|---|---|---|---|---|
| Number of samples | 28 | 58 | 43 | 25 | 41 | 39 |
P value = 0.312 (logrank test), Q value = 1
Table S26. Clustering Approach #3: 'RNAseq CNMF subtypes' versus Clinical Feature #1: 'Time to Death'
| nPatients | nDeath | Duration Range (Median), Month | |
|---|---|---|---|
| ALL | 214 | 82 | 0.0 - 113.0 (13.7) |
| subtype1 | 24 | 10 | 1.0 - 44.4 (12.1) |
| subtype2 | 56 | 22 | 0.1 - 102.7 (21.3) |
| subtype3 | 35 | 12 | 0.1 - 113.0 (15.0) |
| subtype4 | 25 | 11 | 0.1 - 73.8 (9.6) |
| subtype5 | 38 | 15 | 0.0 - 107.1 (14.4) |
| subtype6 | 36 | 12 | 0.4 - 108.8 (12.9) |
Figure S23. Get High-res Image Clustering Approach #3: 'RNAseq CNMF subtypes' versus Clinical Feature #1: 'Time to Death'

P value = 0.00116 (Kruskal-Wallis (anova)), Q value = 0.095
Table S27. Clustering Approach #3: 'RNAseq CNMF subtypes' versus Clinical Feature #2: 'AGE'
| nPatients | Mean (Std.Dev) | |
|---|---|---|
| ALL | 231 | 60.4 (13.6) |
| subtype1 | 28 | 61.9 (11.3) |
| subtype2 | 57 | 63.9 (13.5) |
| subtype3 | 42 | 53.9 (14.6) |
| subtype4 | 24 | 64.8 (10.5) |
| subtype5 | 41 | 57.2 (13.9) |
| subtype6 | 39 | 62.1 (12.6) |
Figure S24. Get High-res Image Clustering Approach #3: 'RNAseq CNMF subtypes' versus Clinical Feature #2: 'AGE'

P value = 0.0739 (Fisher's exact test), Q value = 1
Table S28. Clustering Approach #3: 'RNAseq CNMF subtypes' versus Clinical Feature #3: 'NEOPLASM.DISEASESTAGE'
| nPatients | STAGE I | STAGE II | STAGE III | STAGE IIIA | STAGE IIIB | STAGE IIIC | STAGE IV | STAGE IVA | STAGE IVB |
|---|---|---|---|---|---|---|---|---|---|
| ALL | 85 | 56 | 2 | 51 | 6 | 9 | 2 | 1 | 2 |
| subtype1 | 5 | 10 | 0 | 7 | 2 | 1 | 0 | 0 | 0 |
| subtype2 | 29 | 9 | 1 | 12 | 1 | 0 | 0 | 0 | 1 |
| subtype3 | 9 | 13 | 1 | 11 | 1 | 3 | 1 | 0 | 1 |
| subtype4 | 13 | 4 | 0 | 2 | 1 | 1 | 1 | 1 | 0 |
| subtype5 | 13 | 10 | 0 | 10 | 0 | 3 | 0 | 0 | 0 |
| subtype6 | 16 | 10 | 0 | 9 | 1 | 1 | 0 | 0 | 0 |
Figure S25. Get High-res Image Clustering Approach #3: 'RNAseq CNMF subtypes' versus Clinical Feature #3: 'NEOPLASM.DISEASESTAGE'

P value = 0.0581 (Fisher's exact test), Q value = 1
Table S29. Clustering Approach #3: 'RNAseq CNMF subtypes' versus Clinical Feature #4: 'PATHOLOGY.T.STAGE'
| nPatients | T0+T1 | T2 | T3 | T4 |
|---|---|---|---|---|
| ALL | 94 | 62 | 63 | 13 |
| subtype1 | 5 | 12 | 8 | 3 |
| subtype2 | 30 | 9 | 14 | 4 |
| subtype3 | 12 | 14 | 15 | 2 |
| subtype4 | 16 | 4 | 4 | 1 |
| subtype5 | 14 | 13 | 12 | 2 |
| subtype6 | 17 | 10 | 10 | 1 |
Figure S26. Get High-res Image Clustering Approach #3: 'RNAseq CNMF subtypes' versus Clinical Feature #4: 'PATHOLOGY.T.STAGE'

P value = 0.304 (Fisher's exact test), Q value = 1
Table S30. Clustering Approach #3: 'RNAseq CNMF subtypes' versus Clinical Feature #5: 'PATHOLOGY.N.STAGE'
| nPatients | 0 | 1 |
|---|---|---|
| ALL | 146 | 4 |
| subtype1 | 15 | 0 |
| subtype2 | 37 | 0 |
| subtype3 | 30 | 2 |
| subtype4 | 12 | 1 |
| subtype5 | 26 | 1 |
| subtype6 | 26 | 0 |
Figure S27. Get High-res Image Clustering Approach #3: 'RNAseq CNMF subtypes' versus Clinical Feature #5: 'PATHOLOGY.N.STAGE'
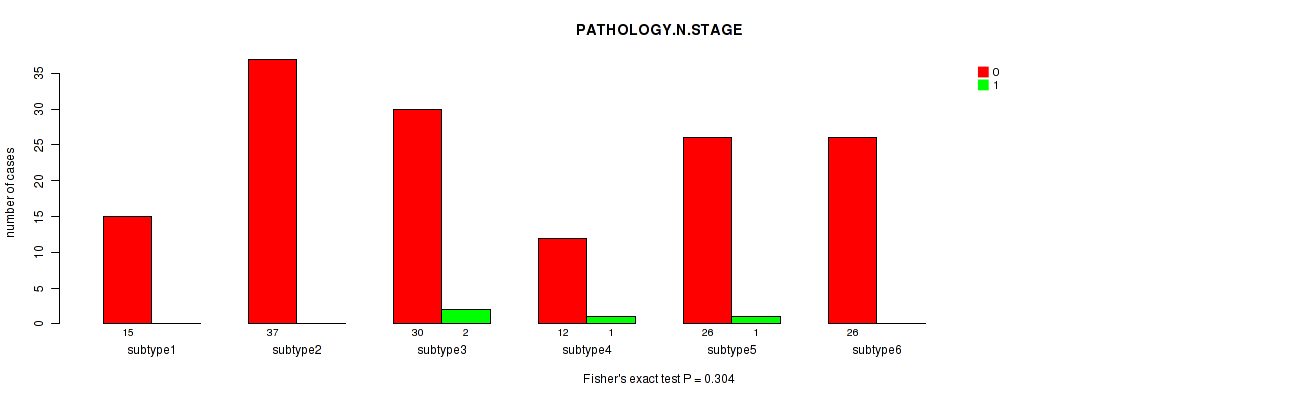
P value = 0.0496 (Fisher's exact test), Q value = 1
Table S31. Clustering Approach #3: 'RNAseq CNMF subtypes' versus Clinical Feature #6: 'PATHOLOGY.M.STAGE'
| nPatients | M0 | M1 | MX |
|---|---|---|---|
| ALL | 163 | 4 | 67 |
| subtype1 | 19 | 0 | 9 |
| subtype2 | 40 | 1 | 17 |
| subtype3 | 36 | 2 | 5 |
| subtype4 | 12 | 1 | 12 |
| subtype5 | 28 | 0 | 13 |
| subtype6 | 28 | 0 | 11 |
Figure S28. Get High-res Image Clustering Approach #3: 'RNAseq CNMF subtypes' versus Clinical Feature #6: 'PATHOLOGY.M.STAGE'
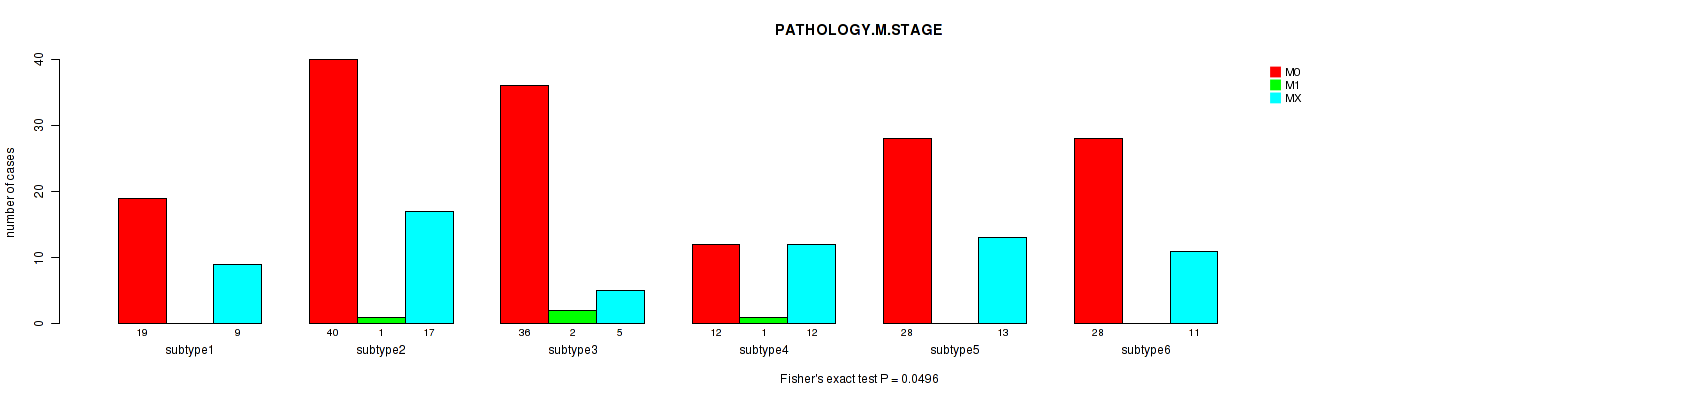
P value = 6e-05 (Fisher's exact test), Q value = 0.0052
Table S32. Clustering Approach #3: 'RNAseq CNMF subtypes' versus Clinical Feature #7: 'GENDER'
| nPatients | FEMALE | MALE |
|---|---|---|
| ALL | 84 | 150 |
| subtype1 | 7 | 21 |
| subtype2 | 19 | 39 |
| subtype3 | 25 | 18 |
| subtype4 | 6 | 19 |
| subtype5 | 22 | 19 |
| subtype6 | 5 | 34 |
Figure S29. Get High-res Image Clustering Approach #3: 'RNAseq CNMF subtypes' versus Clinical Feature #7: 'GENDER'

P value = 0.0316 (Fisher's exact test), Q value = 1
Table S33. Clustering Approach #3: 'RNAseq CNMF subtypes' versus Clinical Feature #8: 'HISTOLOGICAL.TYPE'
| nPatients | FIBROLAMELLAR CARCINOMA | HEPATOCELLULAR CARCINOMA | HEPATOCHOLANGIOCARCINOMA (MIXED) |
|---|---|---|---|
| ALL | 2 | 227 | 5 |
| subtype1 | 0 | 28 | 0 |
| subtype2 | 0 | 58 | 0 |
| subtype3 | 0 | 41 | 2 |
| subtype4 | 0 | 25 | 0 |
| subtype5 | 2 | 36 | 3 |
| subtype6 | 0 | 39 | 0 |
Figure S30. Get High-res Image Clustering Approach #3: 'RNAseq CNMF subtypes' versus Clinical Feature #8: 'HISTOLOGICAL.TYPE'

P value = 0.043 (Fisher's exact test), Q value = 1
Table S34. Clustering Approach #3: 'RNAseq CNMF subtypes' versus Clinical Feature #9: 'COMPLETENESS.OF.RESECTION'
| nPatients | R0 | R1 | R2 | RX |
|---|---|---|---|---|
| ALL | 198 | 13 | 1 | 16 |
| subtype1 | 18 | 4 | 0 | 5 |
| subtype2 | 48 | 4 | 0 | 5 |
| subtype3 | 39 | 2 | 0 | 2 |
| subtype4 | 20 | 1 | 1 | 1 |
| subtype5 | 36 | 2 | 0 | 3 |
| subtype6 | 37 | 0 | 0 | 0 |
Figure S31. Get High-res Image Clustering Approach #3: 'RNAseq CNMF subtypes' versus Clinical Feature #9: 'COMPLETENESS.OF.RESECTION'

P value = 0.0278 (Fisher's exact test), Q value = 1
Table S35. Clustering Approach #3: 'RNAseq CNMF subtypes' versus Clinical Feature #10: 'RACE'
| nPatients | AMERICAN INDIAN OR ALASKA NATIVE | ASIAN | BLACK OR AFRICAN AMERICAN | WHITE |
|---|---|---|---|---|
| ALL | 1 | 66 | 15 | 143 |
| subtype1 | 0 | 9 | 4 | 14 |
| subtype2 | 0 | 11 | 2 | 41 |
| subtype3 | 0 | 20 | 1 | 21 |
| subtype4 | 0 | 3 | 2 | 17 |
| subtype5 | 0 | 15 | 2 | 24 |
| subtype6 | 1 | 8 | 4 | 26 |
Figure S32. Get High-res Image Clustering Approach #3: 'RNAseq CNMF subtypes' versus Clinical Feature #10: 'RACE'

P value = 0.355 (Fisher's exact test), Q value = 1
Table S36. Clustering Approach #3: 'RNAseq CNMF subtypes' versus Clinical Feature #11: 'ETHNICITY'
| nPatients | HISPANIC OR LATINO | NOT HISPANIC OR LATINO |
|---|---|---|
| ALL | 9 | 209 |
| subtype1 | 1 | 23 |
| subtype2 | 5 | 48 |
| subtype3 | 1 | 40 |
| subtype4 | 1 | 22 |
| subtype5 | 1 | 39 |
| subtype6 | 0 | 37 |
Figure S33. Get High-res Image Clustering Approach #3: 'RNAseq CNMF subtypes' versus Clinical Feature #11: 'ETHNICITY'
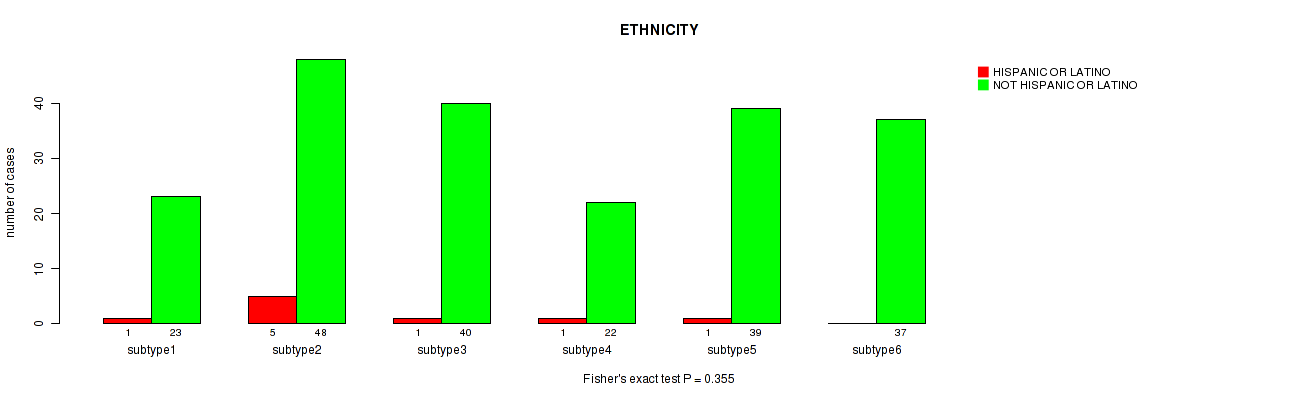
Table S37. Description of clustering approach #4: 'RNAseq cHierClus subtypes'
| Cluster Labels | 1 | 2 | 3 |
|---|---|---|---|
| Number of samples | 85 | 113 | 36 |
P value = 0.464 (logrank test), Q value = 1
Table S38. Clustering Approach #4: 'RNAseq cHierClus subtypes' versus Clinical Feature #1: 'Time to Death'
| nPatients | nDeath | Duration Range (Median), Month | |
|---|---|---|---|
| ALL | 214 | 82 | 0.0 - 113.0 (13.7) |
| subtype1 | 71 | 31 | 0.1 - 113.0 (13.4) |
| subtype2 | 109 | 40 | 0.0 - 102.7 (17.1) |
| subtype3 | 34 | 11 | 0.4 - 108.8 (12.9) |
Figure S34. Get High-res Image Clustering Approach #4: 'RNAseq cHierClus subtypes' versus Clinical Feature #1: 'Time to Death'

P value = 0.0041 (Kruskal-Wallis (anova)), Q value = 0.32
Table S39. Clustering Approach #4: 'RNAseq cHierClus subtypes' versus Clinical Feature #2: 'AGE'
| nPatients | Mean (Std.Dev) | |
|---|---|---|
| ALL | 231 | 60.4 (13.6) |
| subtype1 | 84 | 56.7 (14.4) |
| subtype2 | 111 | 62.4 (12.8) |
| subtype3 | 36 | 63.1 (12.3) |
Figure S35. Get High-res Image Clustering Approach #4: 'RNAseq cHierClus subtypes' versus Clinical Feature #2: 'AGE'

P value = 0.0125 (Fisher's exact test), Q value = 0.91
Table S40. Clustering Approach #4: 'RNAseq cHierClus subtypes' versus Clinical Feature #3: 'NEOPLASM.DISEASESTAGE'
| nPatients | STAGE I | STAGE II | STAGE III | STAGE IIIA | STAGE IIIB | STAGE IIIC | STAGE IV | STAGE IVA | STAGE IVB |
|---|---|---|---|---|---|---|---|---|---|
| ALL | 85 | 56 | 2 | 51 | 6 | 9 | 2 | 1 | 2 |
| subtype1 | 16 | 25 | 1 | 25 | 4 | 5 | 1 | 0 | 1 |
| subtype2 | 54 | 21 | 1 | 20 | 1 | 3 | 1 | 1 | 1 |
| subtype3 | 15 | 10 | 0 | 6 | 1 | 1 | 0 | 0 | 0 |
Figure S36. Get High-res Image Clustering Approach #4: 'RNAseq cHierClus subtypes' versus Clinical Feature #3: 'NEOPLASM.DISEASESTAGE'

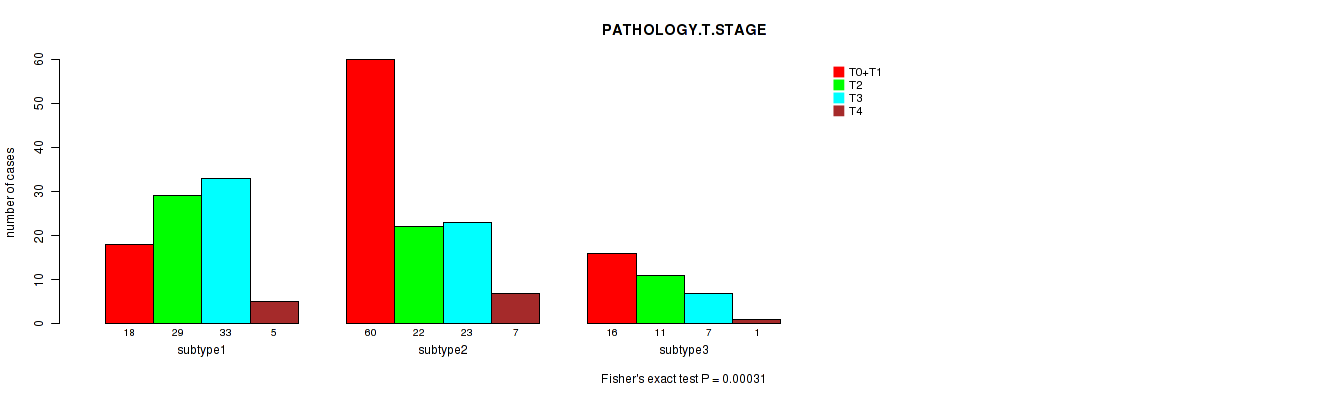
P value = 0.00031 (Fisher's exact test), Q value = 0.026
Table S41. Clustering Approach #4: 'RNAseq cHierClus subtypes' versus Clinical Feature #4: 'PATHOLOGY.T.STAGE'
| nPatients | T0+T1 | T2 | T3 | T4 |
|---|---|---|---|---|
| ALL | 94 | 62 | 63 | 13 |
| subtype1 | 18 | 29 | 33 | 5 |
| subtype2 | 60 | 22 | 23 | 7 |
| subtype3 | 16 | 11 | 7 | 1 |
Figure S37. Get High-res Image Clustering Approach #4: 'RNAseq cHierClus subtypes' versus Clinical Feature #4: 'PATHOLOGY.T.STAGE'
P value = 0.385 (Fisher's exact test), Q value = 1
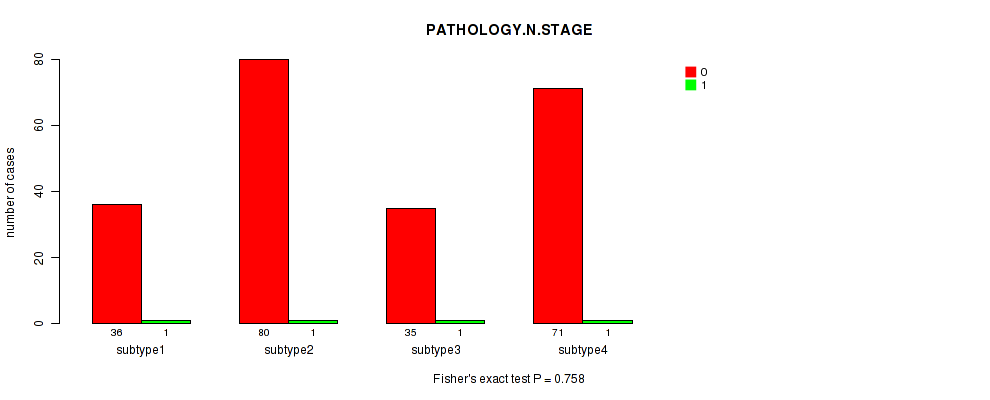
Table S42. Clustering Approach #4: 'RNAseq cHierClus subtypes' versus Clinical Feature #5: 'PATHOLOGY.N.STAGE'
| nPatients | 0 | 1 |
|---|---|---|
| ALL | 146 | 4 |
| subtype1 | 58 | 3 |
| subtype2 | 65 | 1 |
| subtype3 | 23 | 0 |
Figure S38. Get High-res Image Clustering Approach #4: 'RNAseq cHierClus subtypes' versus Clinical Feature #5: 'PATHOLOGY.N.STAGE'

P value = 0.209 (Fisher's exact test), Q value = 1
Table S43. Clustering Approach #4: 'RNAseq cHierClus subtypes' versus Clinical Feature #6: 'PATHOLOGY.M.STAGE'
| nPatients | M0 | M1 | MX |
|---|---|---|---|
| ALL | 163 | 4 | 67 |
| subtype1 | 66 | 2 | 17 |
| subtype2 | 73 | 2 | 38 |
| subtype3 | 24 | 0 | 12 |
Figure S39. Get High-res Image Clustering Approach #4: 'RNAseq cHierClus subtypes' versus Clinical Feature #6: 'PATHOLOGY.M.STAGE'
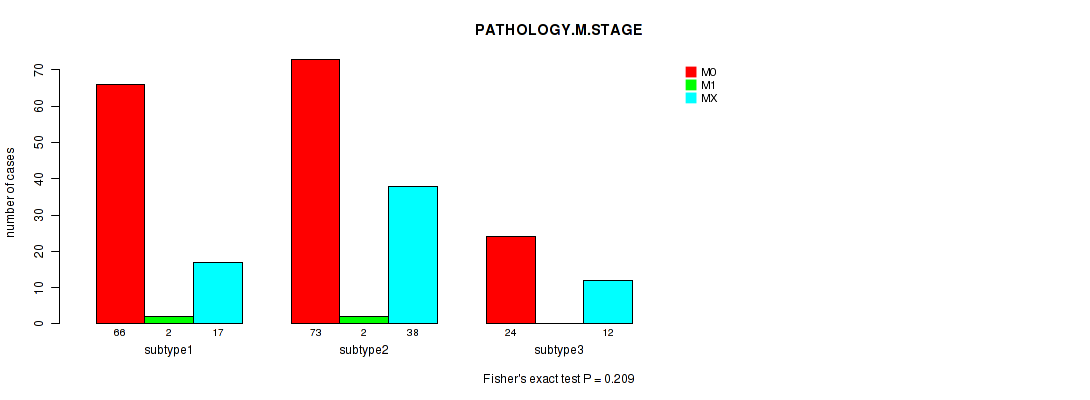
P value = 0.00022 (Fisher's exact test), Q value = 0.019
Table S44. Clustering Approach #4: 'RNAseq cHierClus subtypes' versus Clinical Feature #7: 'GENDER'
| nPatients | FEMALE | MALE |
|---|---|---|
| ALL | 84 | 150 |
| subtype1 | 43 | 42 |
| subtype2 | 36 | 77 |
| subtype3 | 5 | 31 |
Figure S40. Get High-res Image Clustering Approach #4: 'RNAseq cHierClus subtypes' versus Clinical Feature #7: 'GENDER'
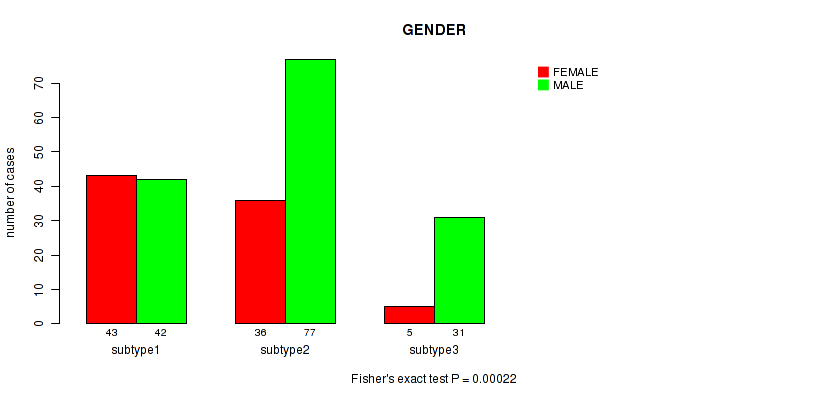
P value = 0.679 (Fisher's exact test), Q value = 1
Table S45. Clustering Approach #4: 'RNAseq cHierClus subtypes' versus Clinical Feature #8: 'HISTOLOGICAL.TYPE'
| nPatients | FIBROLAMELLAR CARCINOMA | HEPATOCELLULAR CARCINOMA | HEPATOCHOLANGIOCARCINOMA (MIXED) |
|---|---|---|---|
| ALL | 2 | 227 | 5 |
| subtype1 | 0 | 82 | 3 |
| subtype2 | 2 | 109 | 2 |
| subtype3 | 0 | 36 | 0 |
Figure S41. Get High-res Image Clustering Approach #4: 'RNAseq cHierClus subtypes' versus Clinical Feature #8: 'HISTOLOGICAL.TYPE'

P value = 0.503 (Fisher's exact test), Q value = 1
Table S46. Clustering Approach #4: 'RNAseq cHierClus subtypes' versus Clinical Feature #9: 'COMPLETENESS.OF.RESECTION'
| nPatients | R0 | R1 | R2 | RX |
|---|---|---|---|---|
| ALL | 198 | 13 | 1 | 16 |
| subtype1 | 71 | 6 | 0 | 7 |
| subtype2 | 94 | 6 | 1 | 9 |
| subtype3 | 33 | 1 | 0 | 0 |
Figure S42. Get High-res Image Clustering Approach #4: 'RNAseq cHierClus subtypes' versus Clinical Feature #9: 'COMPLETENESS.OF.RESECTION'

P value = 0.00026 (Fisher's exact test), Q value = 0.022
Table S47. Clustering Approach #4: 'RNAseq cHierClus subtypes' versus Clinical Feature #10: 'RACE'
| nPatients | AMERICAN INDIAN OR ALASKA NATIVE | ASIAN | BLACK OR AFRICAN AMERICAN | WHITE |
|---|---|---|---|---|
| ALL | 1 | 66 | 15 | 143 |
| subtype1 | 0 | 39 | 3 | 42 |
| subtype2 | 0 | 21 | 8 | 76 |
| subtype3 | 1 | 6 | 4 | 25 |
Figure S43. Get High-res Image Clustering Approach #4: 'RNAseq cHierClus subtypes' versus Clinical Feature #10: 'RACE'

P value = 0.376 (Fisher's exact test), Q value = 1
Table S48. Clustering Approach #4: 'RNAseq cHierClus subtypes' versus Clinical Feature #11: 'ETHNICITY'
| nPatients | HISPANIC OR LATINO | NOT HISPANIC OR LATINO |
|---|---|---|
| ALL | 9 | 209 |
| subtype1 | 3 | 80 |
| subtype2 | 6 | 95 |
| subtype3 | 0 | 34 |
Figure S44. Get High-res Image Clustering Approach #4: 'RNAseq cHierClus subtypes' versus Clinical Feature #11: 'ETHNICITY'
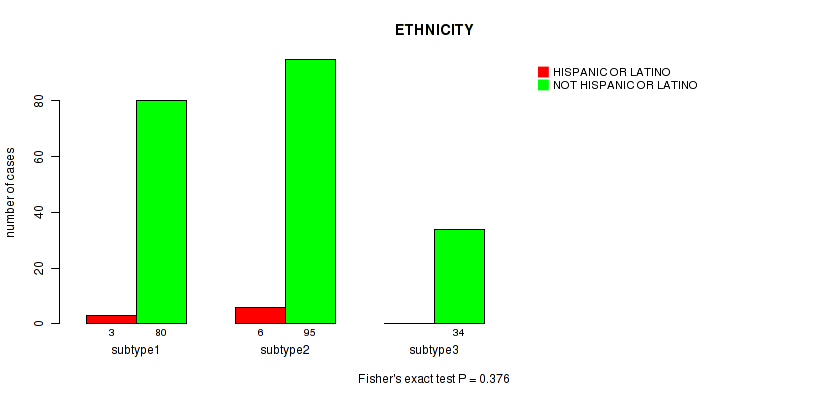
Table S49. Description of clustering approach #5: 'MIRSEQ CNMF'
| Cluster Labels | 1 | 2 | 3 | 4 |
|---|---|---|---|---|
| Number of samples | 52 | 112 | 43 | 105 |
P value = 0.356 (logrank test), Q value = 1
Table S50. Clustering Approach #5: 'MIRSEQ CNMF' versus Clinical Feature #1: 'Time to Death'
| nPatients | nDeath | Duration Range (Median), Month | |
|---|---|---|---|
| ALL | 291 | 90 | 0.0 - 113.0 (14.6) |
| subtype1 | 50 | 18 | 0.0 - 102.7 (14.6) |
| subtype2 | 104 | 35 | 0.2 - 108.8 (13.1) |
| subtype3 | 36 | 9 | 0.1 - 75.7 (24.3) |
| subtype4 | 101 | 28 | 0.1 - 113.0 (14.9) |
Figure S45. Get High-res Image Clustering Approach #5: 'MIRSEQ CNMF' versus Clinical Feature #1: 'Time to Death'

P value = 0.00585 (Kruskal-Wallis (anova)), Q value = 0.43
Table S51. Clustering Approach #5: 'MIRSEQ CNMF' versus Clinical Feature #2: 'AGE'
| nPatients | Mean (Std.Dev) | |
|---|---|---|
| ALL | 309 | 59.6 (12.9) |
| subtype1 | 50 | 63.0 (11.4) |
| subtype2 | 112 | 61.1 (13.5) |
| subtype3 | 43 | 55.3 (14.0) |
| subtype4 | 104 | 58.1 (12.1) |
Figure S46. Get High-res Image Clustering Approach #5: 'MIRSEQ CNMF' versus Clinical Feature #2: 'AGE'

P value = 0.191 (Fisher's exact test), Q value = 1
Table S52. Clustering Approach #5: 'MIRSEQ CNMF' versus Clinical Feature #3: 'NEOPLASM.DISEASESTAGE'
| nPatients | STAGE I | STAGE II | STAGE III | STAGE IIIA | STAGE IIIB | STAGE IIIC | STAGE IV | STAGE IVA | STAGE IVB |
|---|---|---|---|---|---|---|---|---|---|
| ALL | 144 | 71 | 2 | 54 | 7 | 9 | 2 | 1 | 2 |
| subtype1 | 29 | 6 | 1 | 7 | 3 | 1 | 0 | 1 | 1 |
| subtype2 | 52 | 28 | 0 | 23 | 2 | 3 | 0 | 0 | 0 |
| subtype3 | 17 | 10 | 1 | 10 | 0 | 2 | 1 | 0 | 0 |
| subtype4 | 46 | 27 | 0 | 14 | 2 | 3 | 1 | 0 | 1 |
Figure S47. Get High-res Image Clustering Approach #5: 'MIRSEQ CNMF' versus Clinical Feature #3: 'NEOPLASM.DISEASESTAGE'

P value = 0.677 (Fisher's exact test), Q value = 1
Table S53. Clustering Approach #5: 'MIRSEQ CNMF' versus Clinical Feature #4: 'PATHOLOGY.T.STAGE'
| nPatients | T0+T1 | T2 | T3 | T4 |
|---|---|---|---|---|
| ALL | 153 | 77 | 67 | 13 |
| subtype1 | 31 | 7 | 11 | 3 |
| subtype2 | 53 | 29 | 25 | 4 |
| subtype3 | 19 | 11 | 11 | 2 |
| subtype4 | 50 | 30 | 20 | 4 |
Figure S48. Get High-res Image Clustering Approach #5: 'MIRSEQ CNMF' versus Clinical Feature #4: 'PATHOLOGY.T.STAGE'

P value = 0.758 (Fisher's exact test), Q value = 1
Table S54. Clustering Approach #5: 'MIRSEQ CNMF' versus Clinical Feature #5: 'PATHOLOGY.N.STAGE'
| nPatients | 0 | 1 |
|---|---|---|
| ALL | 222 | 4 |
| subtype1 | 36 | 1 |
| subtype2 | 80 | 1 |
| subtype3 | 35 | 1 |
| subtype4 | 71 | 1 |
Figure S49. Get High-res Image Clustering Approach #5: 'MIRSEQ CNMF' versus Clinical Feature #5: 'PATHOLOGY.N.STAGE'
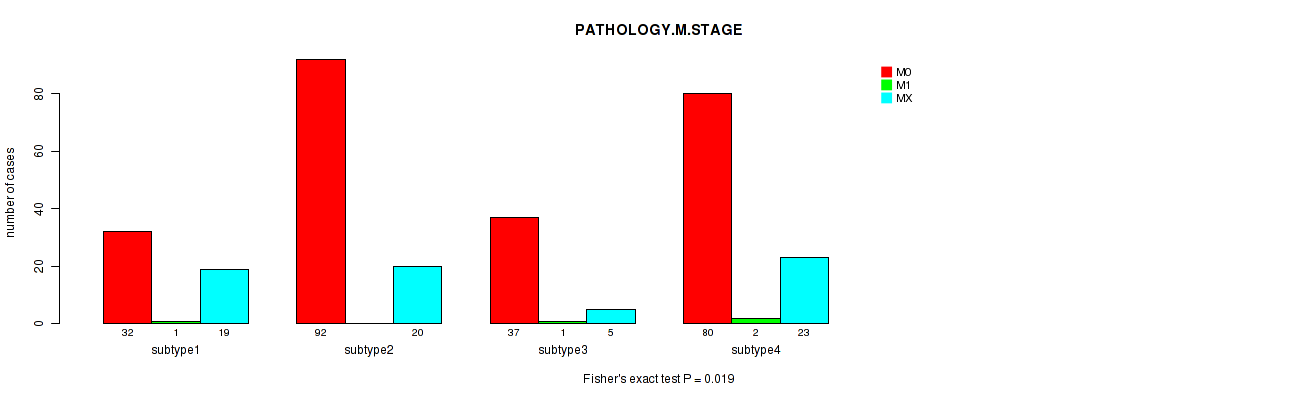
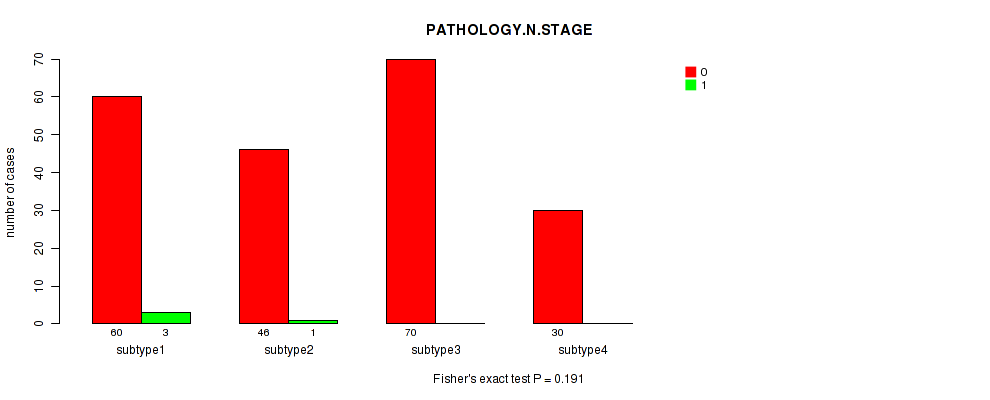
P value = 0.019 (Fisher's exact test), Q value = 1
Table S55. Clustering Approach #5: 'MIRSEQ CNMF' versus Clinical Feature #6: 'PATHOLOGY.M.STAGE'
| nPatients | M0 | M1 | MX |
|---|---|---|---|
| ALL | 241 | 4 | 67 |
| subtype1 | 32 | 1 | 19 |
| subtype2 | 92 | 0 | 20 |
| subtype3 | 37 | 1 | 5 |
| subtype4 | 80 | 2 | 23 |
Figure S50. Get High-res Image Clustering Approach #5: 'MIRSEQ CNMF' versus Clinical Feature #6: 'PATHOLOGY.M.STAGE'
P value = 0.51 (Fisher's exact test), Q value = 1
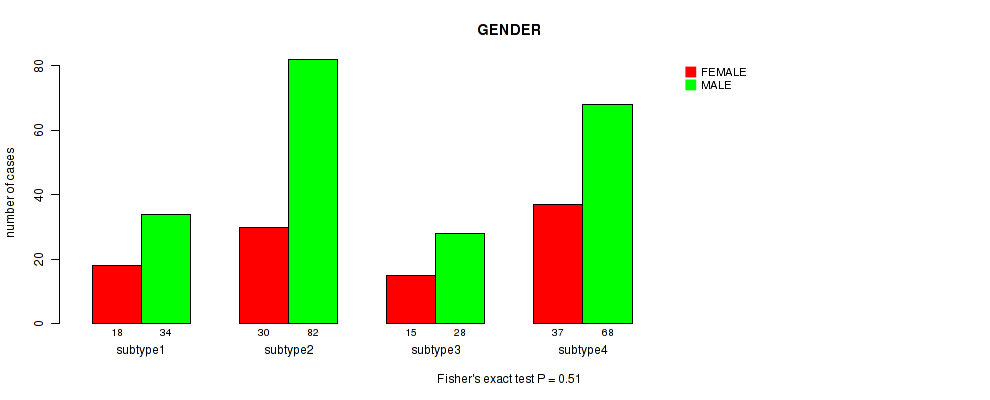
Table S56. Clustering Approach #5: 'MIRSEQ CNMF' versus Clinical Feature #7: 'GENDER'
| nPatients | FEMALE | MALE |
|---|---|---|
| ALL | 100 | 212 |
| subtype1 | 18 | 34 |
| subtype2 | 30 | 82 |
| subtype3 | 15 | 28 |
| subtype4 | 37 | 68 |
Figure S51. Get High-res Image Clustering Approach #5: 'MIRSEQ CNMF' versus Clinical Feature #7: 'GENDER'
P value = 0.147 (Fisher's exact test), Q value = 1
Table S57. Clustering Approach #5: 'MIRSEQ CNMF' versus Clinical Feature #8: 'HISTOLOGICAL.TYPE'
| nPatients | FIBROLAMELLAR CARCINOMA | HEPATOCELLULAR CARCINOMA | HEPATOCHOLANGIOCARCINOMA (MIXED) |
|---|---|---|---|
| ALL | 2 | 304 | 6 |
| subtype1 | 0 | 51 | 1 |
| subtype2 | 0 | 112 | 0 |
| subtype3 | 0 | 42 | 1 |
| subtype4 | 2 | 99 | 4 |
Figure S52. Get High-res Image Clustering Approach #5: 'MIRSEQ CNMF' versus Clinical Feature #8: 'HISTOLOGICAL.TYPE'

P value = 0.75 (Fisher's exact test), Q value = 1
Table S58. Clustering Approach #5: 'MIRSEQ CNMF' versus Clinical Feature #9: 'COMPLETENESS.OF.RESECTION'
| nPatients | R0 | R1 | R2 | RX |
|---|---|---|---|---|
| ALL | 274 | 14 | 1 | 17 |
| subtype1 | 40 | 4 | 0 | 4 |
| subtype2 | 101 | 4 | 0 | 6 |
| subtype3 | 38 | 2 | 0 | 3 |
| subtype4 | 95 | 4 | 1 | 4 |
Figure S53. Get High-res Image Clustering Approach #5: 'MIRSEQ CNMF' versus Clinical Feature #9: 'COMPLETENESS.OF.RESECTION'

P value = 0.274 (Fisher's exact test), Q value = 1
Table S59. Clustering Approach #5: 'MIRSEQ CNMF' versus Clinical Feature #10: 'RACE'
| nPatients | AMERICAN INDIAN OR ALASKA NATIVE | ASIAN | BLACK OR AFRICAN AMERICAN | WHITE |
|---|---|---|---|---|
| ALL | 1 | 144 | 15 | 143 |
| subtype1 | 0 | 18 | 4 | 28 |
| subtype2 | 1 | 51 | 4 | 53 |
| subtype3 | 0 | 26 | 3 | 14 |
| subtype4 | 0 | 49 | 4 | 48 |
Figure S54. Get High-res Image Clustering Approach #5: 'MIRSEQ CNMF' versus Clinical Feature #10: 'RACE'

P value = 0.201 (Fisher's exact test), Q value = 1
Table S60. Clustering Approach #5: 'MIRSEQ CNMF' versus Clinical Feature #11: 'ETHNICITY'
| nPatients | HISPANIC OR LATINO | NOT HISPANIC OR LATINO |
|---|---|---|
| ALL | 9 | 287 |
| subtype1 | 0 | 49 |
| subtype2 | 2 | 104 |
| subtype3 | 1 | 40 |
| subtype4 | 6 | 94 |
Figure S55. Get High-res Image Clustering Approach #5: 'MIRSEQ CNMF' versus Clinical Feature #11: 'ETHNICITY'

Table S61. Description of clustering approach #6: 'MIRSEQ CHIERARCHICAL'
| Cluster Labels | 1 | 2 | 3 | 4 | 5 |
|---|---|---|---|---|---|
| Number of samples | 35 | 82 | 47 | 105 | 43 |
P value = 0.024 (logrank test), Q value = 1
Table S62. Clustering Approach #6: 'MIRSEQ CHIERARCHICAL' versus Clinical Feature #1: 'Time to Death'
| nPatients | nDeath | Duration Range (Median), Month | |
|---|---|---|---|
| ALL | 291 | 90 | 0.0 - 113.0 (14.6) |
| subtype1 | 32 | 14 | 0.0 - 83.6 (11.0) |
| subtype2 | 77 | 23 | 0.1 - 102.7 (15.0) |
| subtype3 | 43 | 19 | 0.2 - 113.0 (13.6) |
| subtype4 | 98 | 25 | 0.1 - 101.0 (19.2) |
| subtype5 | 41 | 9 | 0.3 - 108.8 (12.8) |
Figure S56. Get High-res Image Clustering Approach #6: 'MIRSEQ CHIERARCHICAL' versus Clinical Feature #1: 'Time to Death'

P value = 1.54e-05 (Kruskal-Wallis (anova)), Q value = 0.0013
Table S63. Clustering Approach #6: 'MIRSEQ CHIERARCHICAL' versus Clinical Feature #2: 'AGE'
| nPatients | Mean (Std.Dev) | |
|---|---|---|
| ALL | 309 | 59.6 (12.9) |
| subtype1 | 35 | 62.0 (11.4) |
| subtype2 | 80 | 63.2 (12.1) |
| subtype3 | 47 | 57.9 (13.7) |
| subtype4 | 104 | 55.1 (13.4) |
| subtype5 | 43 | 64.0 (9.9) |
Figure S57. Get High-res Image Clustering Approach #6: 'MIRSEQ CHIERARCHICAL' versus Clinical Feature #2: 'AGE'

P value = 0.868 (Fisher's exact test), Q value = 1
Table S64. Clustering Approach #6: 'MIRSEQ CHIERARCHICAL' versus Clinical Feature #3: 'NEOPLASM.DISEASESTAGE'
| nPatients | STAGE I | STAGE II | STAGE III | STAGE IIIA | STAGE IIIB | STAGE IIIC | STAGE IV | STAGE IVA | STAGE IVB |
|---|---|---|---|---|---|---|---|---|---|
| ALL | 144 | 71 | 2 | 54 | 7 | 9 | 2 | 1 | 2 |
| subtype1 | 18 | 4 | 0 | 9 | 1 | 1 | 0 | 0 | 1 |
| subtype2 | 36 | 20 | 1 | 10 | 4 | 1 | 0 | 1 | 0 |
| subtype3 | 23 | 11 | 0 | 10 | 0 | 1 | 0 | 0 | 0 |
| subtype4 | 45 | 26 | 1 | 18 | 1 | 5 | 2 | 0 | 1 |
| subtype5 | 22 | 10 | 0 | 7 | 1 | 1 | 0 | 0 | 0 |
Figure S58. Get High-res Image Clustering Approach #6: 'MIRSEQ CHIERARCHICAL' versus Clinical Feature #3: 'NEOPLASM.DISEASESTAGE'

P value = 0.855 (Fisher's exact test), Q value = 1
Table S65. Clustering Approach #6: 'MIRSEQ CHIERARCHICAL' versus Clinical Feature #4: 'PATHOLOGY.T.STAGE'
| nPatients | T0+T1 | T2 | T3 | T4 |
|---|---|---|---|---|
| ALL | 153 | 77 | 67 | 13 |
| subtype1 | 18 | 5 | 10 | 2 |
| subtype2 | 40 | 21 | 16 | 5 |
| subtype3 | 24 | 12 | 11 | 0 |
| subtype4 | 48 | 29 | 22 | 5 |
| subtype5 | 23 | 10 | 8 | 1 |
Figure S59. Get High-res Image Clustering Approach #6: 'MIRSEQ CHIERARCHICAL' versus Clinical Feature #4: 'PATHOLOGY.T.STAGE'

P value = 1 (Fisher's exact test), Q value = 1
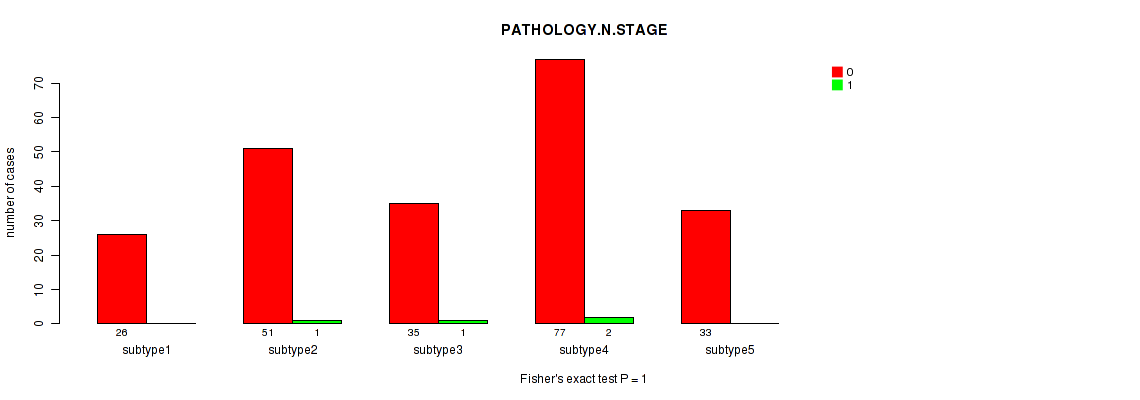
Table S66. Clustering Approach #6: 'MIRSEQ CHIERARCHICAL' versus Clinical Feature #5: 'PATHOLOGY.N.STAGE'
| nPatients | 0 | 1 |
|---|---|---|
| ALL | 222 | 4 |
| subtype1 | 26 | 0 |
| subtype2 | 51 | 1 |
| subtype3 | 35 | 1 |
| subtype4 | 77 | 2 |
| subtype5 | 33 | 0 |
Figure S60. Get High-res Image Clustering Approach #6: 'MIRSEQ CHIERARCHICAL' versus Clinical Feature #5: 'PATHOLOGY.N.STAGE'
P value = 0.0931 (Fisher's exact test), Q value = 1
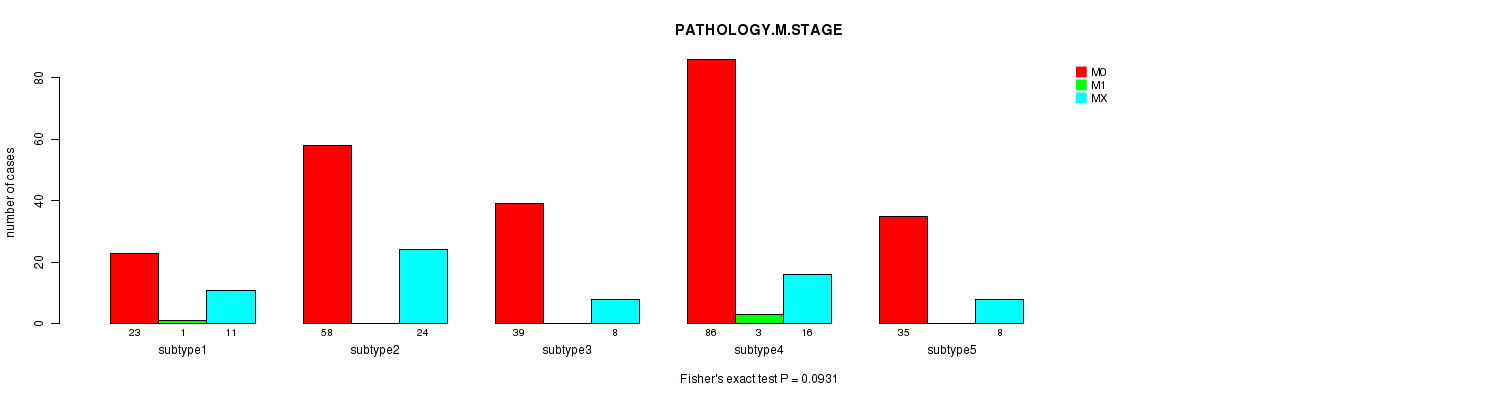
Table S67. Clustering Approach #6: 'MIRSEQ CHIERARCHICAL' versus Clinical Feature #6: 'PATHOLOGY.M.STAGE'
| nPatients | M0 | M1 | MX |
|---|---|---|---|
| ALL | 241 | 4 | 67 |
| subtype1 | 23 | 1 | 11 |
| subtype2 | 58 | 0 | 24 |
| subtype3 | 39 | 0 | 8 |
| subtype4 | 86 | 3 | 16 |
| subtype5 | 35 | 0 | 8 |
Figure S61. Get High-res Image Clustering Approach #6: 'MIRSEQ CHIERARCHICAL' versus Clinical Feature #6: 'PATHOLOGY.M.STAGE'
P value = 0.0741 (Fisher's exact test), Q value = 1
Table S68. Clustering Approach #6: 'MIRSEQ CHIERARCHICAL' versus Clinical Feature #7: 'GENDER'
| nPatients | FEMALE | MALE |
|---|---|---|
| ALL | 100 | 212 |
| subtype1 | 12 | 23 |
| subtype2 | 27 | 55 |
| subtype3 | 16 | 31 |
| subtype4 | 39 | 66 |
| subtype5 | 6 | 37 |
Figure S62. Get High-res Image Clustering Approach #6: 'MIRSEQ CHIERARCHICAL' versus Clinical Feature #7: 'GENDER'

P value = 0.922 (Fisher's exact test), Q value = 1
Table S69. Clustering Approach #6: 'MIRSEQ CHIERARCHICAL' versus Clinical Feature #8: 'HISTOLOGICAL.TYPE'
| nPatients | FIBROLAMELLAR CARCINOMA | HEPATOCELLULAR CARCINOMA | HEPATOCHOLANGIOCARCINOMA (MIXED) |
|---|---|---|---|
| ALL | 2 | 304 | 6 |
| subtype1 | 0 | 35 | 0 |
| subtype2 | 0 | 80 | 2 |
| subtype3 | 0 | 46 | 1 |
| subtype4 | 2 | 100 | 3 |
| subtype5 | 0 | 43 | 0 |
Figure S63. Get High-res Image Clustering Approach #6: 'MIRSEQ CHIERARCHICAL' versus Clinical Feature #8: 'HISTOLOGICAL.TYPE'

P value = 0.311 (Fisher's exact test), Q value = 1
Table S70. Clustering Approach #6: 'MIRSEQ CHIERARCHICAL' versus Clinical Feature #9: 'COMPLETENESS.OF.RESECTION'
| nPatients | R0 | R1 | R2 | RX |
|---|---|---|---|---|
| ALL | 274 | 14 | 1 | 17 |
| subtype1 | 26 | 3 | 0 | 3 |
| subtype2 | 70 | 5 | 0 | 5 |
| subtype3 | 42 | 1 | 0 | 4 |
| subtype4 | 94 | 5 | 1 | 5 |
| subtype5 | 42 | 0 | 0 | 0 |
Figure S64. Get High-res Image Clustering Approach #6: 'MIRSEQ CHIERARCHICAL' versus Clinical Feature #9: 'COMPLETENESS.OF.RESECTION'

P value = 0.0393 (Fisher's exact test), Q value = 1
Table S71. Clustering Approach #6: 'MIRSEQ CHIERARCHICAL' versus Clinical Feature #10: 'RACE'
| nPatients | AMERICAN INDIAN OR ALASKA NATIVE | ASIAN | BLACK OR AFRICAN AMERICAN | WHITE |
|---|---|---|---|---|
| ALL | 1 | 144 | 15 | 143 |
| subtype1 | 0 | 15 | 5 | 15 |
| subtype2 | 0 | 28 | 4 | 45 |
| subtype3 | 0 | 29 | 1 | 16 |
| subtype4 | 0 | 53 | 4 | 45 |
| subtype5 | 1 | 19 | 1 | 22 |
Figure S65. Get High-res Image Clustering Approach #6: 'MIRSEQ CHIERARCHICAL' versus Clinical Feature #10: 'RACE'

P value = 0.538 (Fisher's exact test), Q value = 1
Table S72. Clustering Approach #6: 'MIRSEQ CHIERARCHICAL' versus Clinical Feature #11: 'ETHNICITY'
| nPatients | HISPANIC OR LATINO | NOT HISPANIC OR LATINO |
|---|---|---|
| ALL | 9 | 287 |
| subtype1 | 0 | 34 |
| subtype2 | 2 | 74 |
| subtype3 | 2 | 43 |
| subtype4 | 5 | 96 |
| subtype5 | 0 | 40 |
Figure S66. Get High-res Image Clustering Approach #6: 'MIRSEQ CHIERARCHICAL' versus Clinical Feature #11: 'ETHNICITY'

Table S73. Description of clustering approach #7: 'MIRseq Mature CNMF subtypes'
| Cluster Labels | 1 | 2 | 3 | 4 |
|---|---|---|---|---|
| Number of samples | 83 | 72 | 98 | 38 |
P value = 0.0622 (logrank test), Q value = 1
Table S74. Clustering Approach #7: 'MIRseq Mature CNMF subtypes' versus Clinical Feature #1: 'Time to Death'
| nPatients | nDeath | Duration Range (Median), Month | |
|---|---|---|---|
| ALL | 273 | 84 | 0.0 - 113.0 (14.4) |
| subtype1 | 74 | 29 | 0.2 - 113.0 (13.4) |
| subtype2 | 71 | 22 | 0.1 - 107.1 (15.4) |
| subtype3 | 96 | 27 | 0.3 - 108.8 (18.4) |
| subtype4 | 32 | 6 | 0.0 - 73.4 (14.3) |
Figure S67. Get High-res Image Clustering Approach #7: 'MIRseq Mature CNMF subtypes' versus Clinical Feature #1: 'Time to Death'

P value = 0.00218 (Kruskal-Wallis (anova)), Q value = 0.17
Table S75. Clustering Approach #7: 'MIRseq Mature CNMF subtypes' versus Clinical Feature #2: 'AGE'
| nPatients | Mean (Std.Dev) | |
|---|---|---|
| ALL | 288 | 59.7 (12.5) |
| subtype1 | 83 | 57.8 (13.4) |
| subtype2 | 71 | 59.3 (11.9) |
| subtype3 | 97 | 63.5 (10.2) |
| subtype4 | 37 | 54.6 (14.8) |
Figure S68. Get High-res Image Clustering Approach #7: 'MIRseq Mature CNMF subtypes' versus Clinical Feature #2: 'AGE'

P value = 0.00297 (Fisher's exact test), Q value = 0.23
Table S76. Clustering Approach #7: 'MIRseq Mature CNMF subtypes' versus Clinical Feature #3: 'NEOPLASM.DISEASESTAGE'
| nPatients | STAGE I | STAGE II | STAGE III | STAGE IIIA | STAGE IIIB | STAGE IIIC | STAGE IV | STAGE IVA | STAGE IVB |
|---|---|---|---|---|---|---|---|---|---|
| ALL | 132 | 69 | 2 | 49 | 6 | 8 | 2 | 1 | 2 |
| subtype1 | 30 | 20 | 0 | 22 | 5 | 5 | 0 | 0 | 0 |
| subtype2 | 29 | 18 | 0 | 10 | 0 | 3 | 1 | 1 | 1 |
| subtype3 | 56 | 21 | 1 | 10 | 0 | 0 | 0 | 0 | 1 |
| subtype4 | 17 | 10 | 1 | 7 | 1 | 0 | 1 | 0 | 0 |
Figure S69. Get High-res Image Clustering Approach #7: 'MIRseq Mature CNMF subtypes' versus Clinical Feature #3: 'NEOPLASM.DISEASESTAGE'

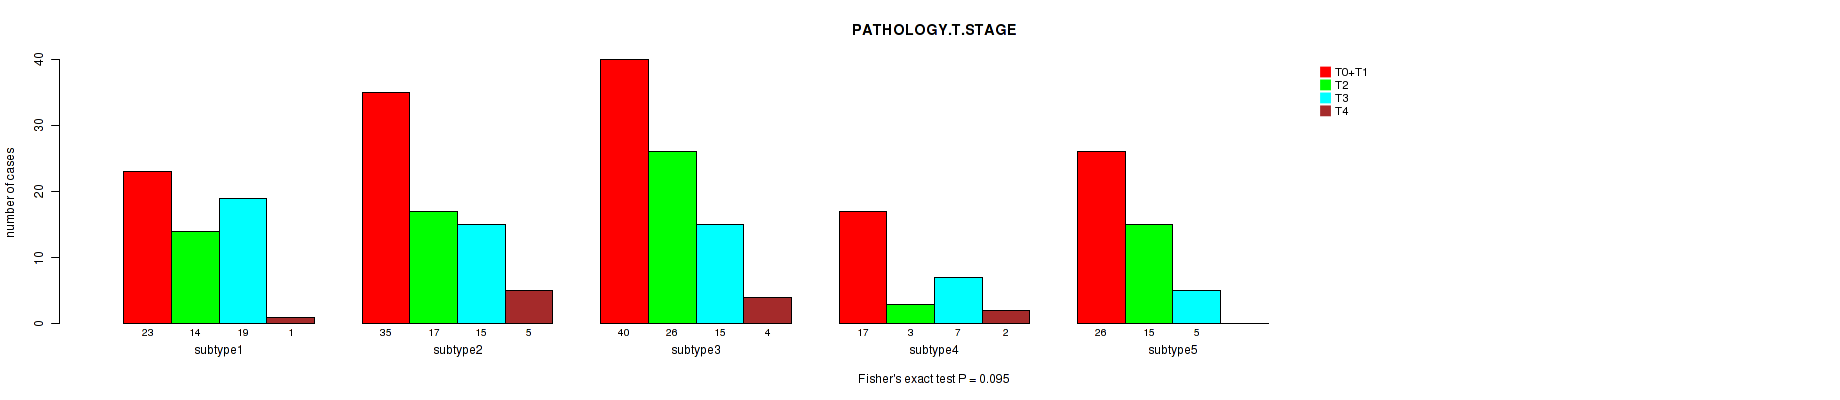
P value = 0.0245 (Fisher's exact test), Q value = 1
Table S77. Clustering Approach #7: 'MIRseq Mature CNMF subtypes' versus Clinical Feature #4: 'PATHOLOGY.T.STAGE'
| nPatients | T0+T1 | T2 | T3 | T4 |
|---|---|---|---|---|
| ALL | 141 | 75 | 61 | 12 |
| subtype1 | 31 | 21 | 26 | 5 |
| subtype2 | 34 | 20 | 13 | 5 |
| subtype3 | 59 | 23 | 12 | 2 |
| subtype4 | 17 | 11 | 10 | 0 |
Figure S70. Get High-res Image Clustering Approach #7: 'MIRseq Mature CNMF subtypes' versus Clinical Feature #4: 'PATHOLOGY.T.STAGE'

P value = 0.191 (Fisher's exact test), Q value = 1
Table S78. Clustering Approach #7: 'MIRseq Mature CNMF subtypes' versus Clinical Feature #5: 'PATHOLOGY.N.STAGE'
| nPatients | 0 | 1 |
|---|---|---|
| ALL | 206 | 4 |
| subtype1 | 60 | 3 |
| subtype2 | 46 | 1 |
| subtype3 | 70 | 0 |
| subtype4 | 30 | 0 |
Figure S71. Get High-res Image Clustering Approach #7: 'MIRseq Mature CNMF subtypes' versus Clinical Feature #5: 'PATHOLOGY.N.STAGE'
P value = 0.0173 (Fisher's exact test), Q value = 1
Table S79. Clustering Approach #7: 'MIRseq Mature CNMF subtypes' versus Clinical Feature #6: 'PATHOLOGY.M.STAGE'
| nPatients | M0 | M1 | MX |
|---|---|---|---|
| ALL | 227 | 4 | 60 |
| subtype1 | 69 | 0 | 14 |
| subtype2 | 47 | 2 | 23 |
| subtype3 | 77 | 1 | 20 |
| subtype4 | 34 | 1 | 3 |
Figure S72. Get High-res Image Clustering Approach #7: 'MIRseq Mature CNMF subtypes' versus Clinical Feature #6: 'PATHOLOGY.M.STAGE'

P value = 0.13 (Fisher's exact test), Q value = 1
Table S80. Clustering Approach #7: 'MIRseq Mature CNMF subtypes' versus Clinical Feature #7: 'GENDER'
| nPatients | FEMALE | MALE |
|---|---|---|
| ALL | 97 | 194 |
| subtype1 | 35 | 48 |
| subtype2 | 24 | 48 |
| subtype3 | 25 | 73 |
| subtype4 | 13 | 25 |
Figure S73. Get High-res Image Clustering Approach #7: 'MIRseq Mature CNMF subtypes' versus Clinical Feature #7: 'GENDER'

P value = 0.192 (Fisher's exact test), Q value = 1
Table S81. Clustering Approach #7: 'MIRseq Mature CNMF subtypes' versus Clinical Feature #8: 'HISTOLOGICAL.TYPE'
| nPatients | FIBROLAMELLAR CARCINOMA | HEPATOCELLULAR CARCINOMA | HEPATOCHOLANGIOCARCINOMA (MIXED) |
|---|---|---|---|
| ALL | 1 | 284 | 6 |
| subtype1 | 0 | 80 | 3 |
| subtype2 | 1 | 69 | 2 |
| subtype3 | 0 | 98 | 0 |
| subtype4 | 0 | 37 | 1 |
Figure S74. Get High-res Image Clustering Approach #7: 'MIRseq Mature CNMF subtypes' versus Clinical Feature #8: 'HISTOLOGICAL.TYPE'

P value = 0.233 (Fisher's exact test), Q value = 1
Table S82. Clustering Approach #7: 'MIRseq Mature CNMF subtypes' versus Clinical Feature #9: 'COMPLETENESS.OF.RESECTION'
| nPatients | R0 | R1 | R2 | RX |
|---|---|---|---|---|
| ALL | 255 | 14 | 1 | 15 |
| subtype1 | 70 | 5 | 0 | 5 |
| subtype2 | 60 | 6 | 1 | 3 |
| subtype3 | 92 | 2 | 0 | 3 |
| subtype4 | 33 | 1 | 0 | 4 |
Figure S75. Get High-res Image Clustering Approach #7: 'MIRseq Mature CNMF subtypes' versus Clinical Feature #9: 'COMPLETENESS.OF.RESECTION'

P value = 0.844 (Fisher's exact test), Q value = 1
Table S83. Clustering Approach #7: 'MIRseq Mature CNMF subtypes' versus Clinical Feature #10: 'RACE'
| nPatients | AMERICAN INDIAN OR ALASKA NATIVE | ASIAN | BLACK OR AFRICAN AMERICAN | WHITE |
|---|---|---|---|---|
| ALL | 1 | 138 | 15 | 128 |
| subtype1 | 0 | 42 | 4 | 36 |
| subtype2 | 0 | 32 | 4 | 33 |
| subtype3 | 1 | 41 | 6 | 45 |
| subtype4 | 0 | 23 | 1 | 14 |
Figure S76. Get High-res Image Clustering Approach #7: 'MIRseq Mature CNMF subtypes' versus Clinical Feature #10: 'RACE'

P value = 1 (Fisher's exact test), Q value = 1
Table S84. Clustering Approach #7: 'MIRseq Mature CNMF subtypes' versus Clinical Feature #11: 'ETHNICITY'
| nPatients | HISPANIC OR LATINO | NOT HISPANIC OR LATINO |
|---|---|---|
| ALL | 9 | 267 |
| subtype1 | 3 | 75 |
| subtype2 | 2 | 67 |
| subtype3 | 3 | 88 |
| subtype4 | 1 | 37 |
Figure S77. Get High-res Image Clustering Approach #7: 'MIRseq Mature CNMF subtypes' versus Clinical Feature #11: 'ETHNICITY'

Table S85. Description of clustering approach #8: 'MIRseq Mature cHierClus subtypes'
| Cluster Labels | 1 | 2 | 3 | 4 | 5 |
|---|---|---|---|---|---|
| Number of samples | 57 | 72 | 86 | 29 | 47 |
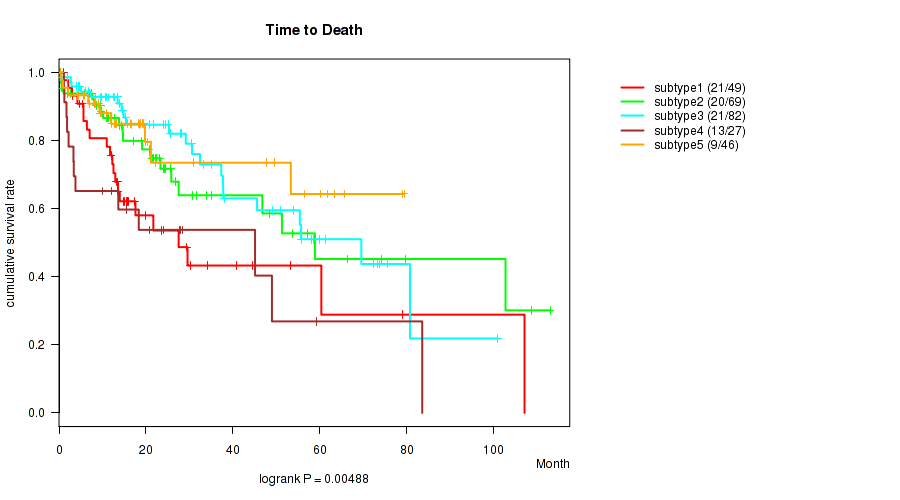
P value = 0.00488 (logrank test), Q value = 0.37
Table S86. Clustering Approach #8: 'MIRseq Mature cHierClus subtypes' versus Clinical Feature #1: 'Time to Death'
| nPatients | nDeath | Duration Range (Median), Month | |
|---|---|---|---|
| ALL | 273 | 84 | 0.0 - 113.0 (14.4) |
| subtype1 | 49 | 21 | 0.1 - 107.1 (13.4) |
| subtype2 | 69 | 20 | 0.2 - 113.0 (17.1) |
| subtype3 | 82 | 21 | 0.1 - 101.0 (15.4) |
| subtype4 | 27 | 13 | 0.0 - 83.6 (12.0) |
| subtype5 | 46 | 9 | 0.3 - 79.4 (13.1) |
Figure S78. Get High-res Image Clustering Approach #8: 'MIRseq Mature cHierClus subtypes' versus Clinical Feature #1: 'Time to Death'
P value = 1.07e-05 (Kruskal-Wallis (anova)), Q value = 0.00094
Table S87. Clustering Approach #8: 'MIRseq Mature cHierClus subtypes' versus Clinical Feature #2: 'AGE'
| nPatients | Mean (Std.Dev) | |
|---|---|---|
| ALL | 288 | 59.7 (12.5) |
| subtype1 | 57 | 54.8 (12.6) |
| subtype2 | 70 | 63.5 (11.9) |
| subtype3 | 85 | 56.6 (13.2) |
| subtype4 | 29 | 63.4 (11.1) |
| subtype5 | 47 | 63.3 (9.7) |
Figure S79. Get High-res Image Clustering Approach #8: 'MIRseq Mature cHierClus subtypes' versus Clinical Feature #2: 'AGE'

P value = 0.0904 (Fisher's exact test), Q value = 1
Table S88. Clustering Approach #8: 'MIRseq Mature cHierClus subtypes' versus Clinical Feature #3: 'NEOPLASM.DISEASESTAGE'
| nPatients | STAGE I | STAGE II | STAGE III | STAGE IIIA | STAGE IIIB | STAGE IIIC | STAGE IV | STAGE IVA | STAGE IVB |
|---|---|---|---|---|---|---|---|---|---|
| ALL | 132 | 69 | 2 | 49 | 6 | 8 | 2 | 1 | 2 |
| subtype1 | 21 | 13 | 0 | 17 | 1 | 1 | 0 | 0 | 0 |
| subtype2 | 31 | 16 | 1 | 10 | 4 | 1 | 0 | 1 | 0 |
| subtype3 | 38 | 22 | 1 | 11 | 0 | 5 | 2 | 0 | 1 |
| subtype4 | 17 | 3 | 0 | 6 | 1 | 1 | 0 | 0 | 1 |
| subtype5 | 25 | 15 | 0 | 5 | 0 | 0 | 0 | 0 | 0 |
Figure S80. Get High-res Image Clustering Approach #8: 'MIRseq Mature cHierClus subtypes' versus Clinical Feature #3: 'NEOPLASM.DISEASESTAGE'

P value = 0.095 (Fisher's exact test), Q value = 1
Table S89. Clustering Approach #8: 'MIRseq Mature cHierClus subtypes' versus Clinical Feature #4: 'PATHOLOGY.T.STAGE'
| nPatients | T0+T1 | T2 | T3 | T4 |
|---|---|---|---|---|
| ALL | 141 | 75 | 61 | 12 |
| subtype1 | 23 | 14 | 19 | 1 |
| subtype2 | 35 | 17 | 15 | 5 |
| subtype3 | 40 | 26 | 15 | 4 |
| subtype4 | 17 | 3 | 7 | 2 |
| subtype5 | 26 | 15 | 5 | 0 |
Figure S81. Get High-res Image Clustering Approach #8: 'MIRseq Mature cHierClus subtypes' versus Clinical Feature #4: 'PATHOLOGY.T.STAGE'
P value = 0.943 (Fisher's exact test), Q value = 1
Table S90. Clustering Approach #8: 'MIRseq Mature cHierClus subtypes' versus Clinical Feature #5: 'PATHOLOGY.N.STAGE'
| nPatients | 0 | 1 |
|---|---|---|
| ALL | 206 | 4 |
| subtype1 | 42 | 1 |
| subtype2 | 44 | 1 |
| subtype3 | 61 | 2 |
| subtype4 | 22 | 0 |
| subtype5 | 37 | 0 |
Figure S82. Get High-res Image Clustering Approach #8: 'MIRseq Mature cHierClus subtypes' versus Clinical Feature #5: 'PATHOLOGY.N.STAGE'

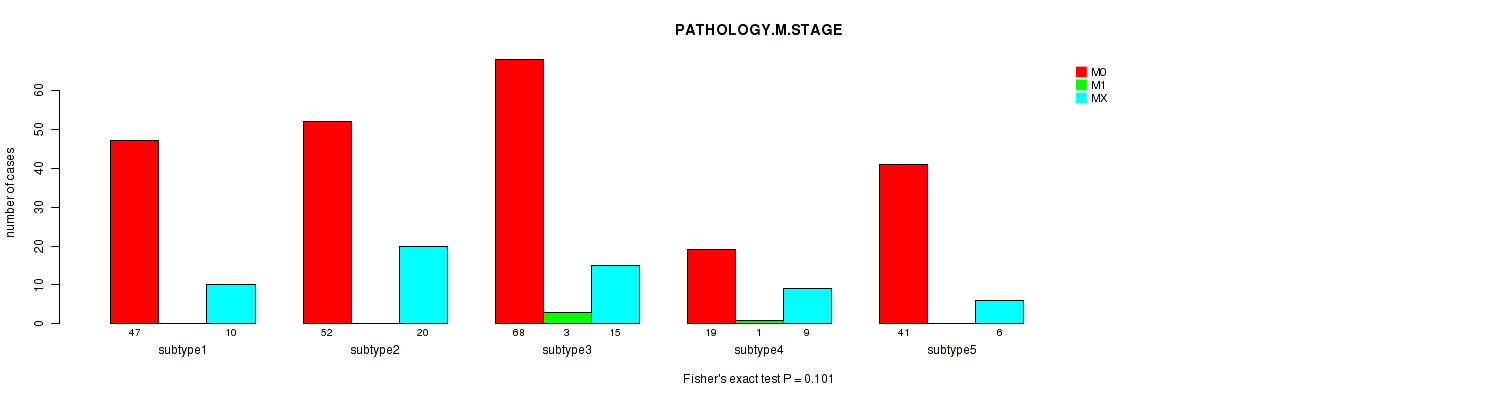
P value = 0.101 (Fisher's exact test), Q value = 1
Table S91. Clustering Approach #8: 'MIRseq Mature cHierClus subtypes' versus Clinical Feature #6: 'PATHOLOGY.M.STAGE'
| nPatients | M0 | M1 | MX |
|---|---|---|---|
| ALL | 227 | 4 | 60 |
| subtype1 | 47 | 0 | 10 |
| subtype2 | 52 | 0 | 20 |
| subtype3 | 68 | 3 | 15 |
| subtype4 | 19 | 1 | 9 |
| subtype5 | 41 | 0 | 6 |
Figure S83. Get High-res Image Clustering Approach #8: 'MIRseq Mature cHierClus subtypes' versus Clinical Feature #6: 'PATHOLOGY.M.STAGE'
P value = 0.166 (Fisher's exact test), Q value = 1
Table S92. Clustering Approach #8: 'MIRseq Mature cHierClus subtypes' versus Clinical Feature #7: 'GENDER'
| nPatients | FEMALE | MALE |
|---|---|---|
| ALL | 97 | 194 |
| subtype1 | 20 | 37 |
| subtype2 | 23 | 49 |
| subtype3 | 33 | 53 |
| subtype4 | 12 | 17 |
| subtype5 | 9 | 38 |
Figure S84. Get High-res Image Clustering Approach #8: 'MIRseq Mature cHierClus subtypes' versus Clinical Feature #7: 'GENDER'
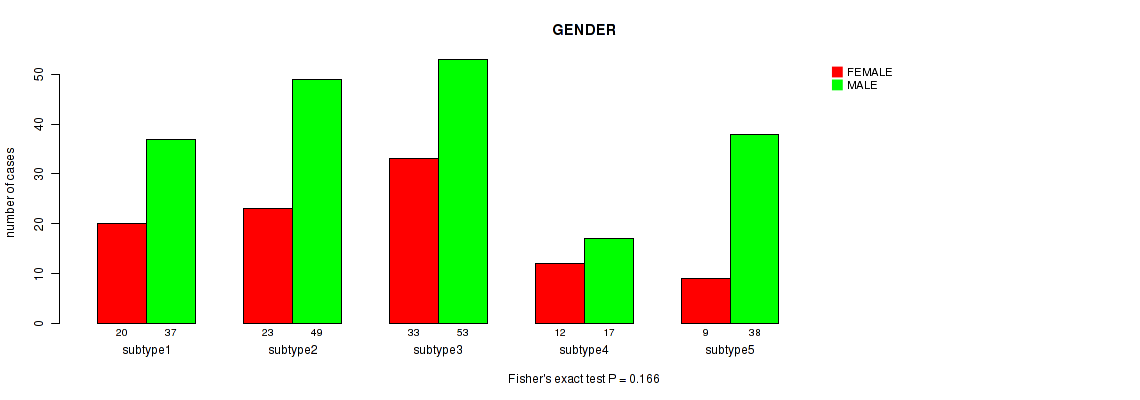
P value = 0.815 (Fisher's exact test), Q value = 1
Table S93. Clustering Approach #8: 'MIRseq Mature cHierClus subtypes' versus Clinical Feature #8: 'HISTOLOGICAL.TYPE'
| nPatients | FIBROLAMELLAR CARCINOMA | HEPATOCELLULAR CARCINOMA | HEPATOCHOLANGIOCARCINOMA (MIXED) |
|---|---|---|---|
| ALL | 1 | 284 | 6 |
| subtype1 | 0 | 55 | 2 |
| subtype2 | 0 | 71 | 1 |
| subtype3 | 1 | 82 | 3 |
| subtype4 | 0 | 29 | 0 |
| subtype5 | 0 | 47 | 0 |
Figure S85. Get High-res Image Clustering Approach #8: 'MIRseq Mature cHierClus subtypes' versus Clinical Feature #8: 'HISTOLOGICAL.TYPE'
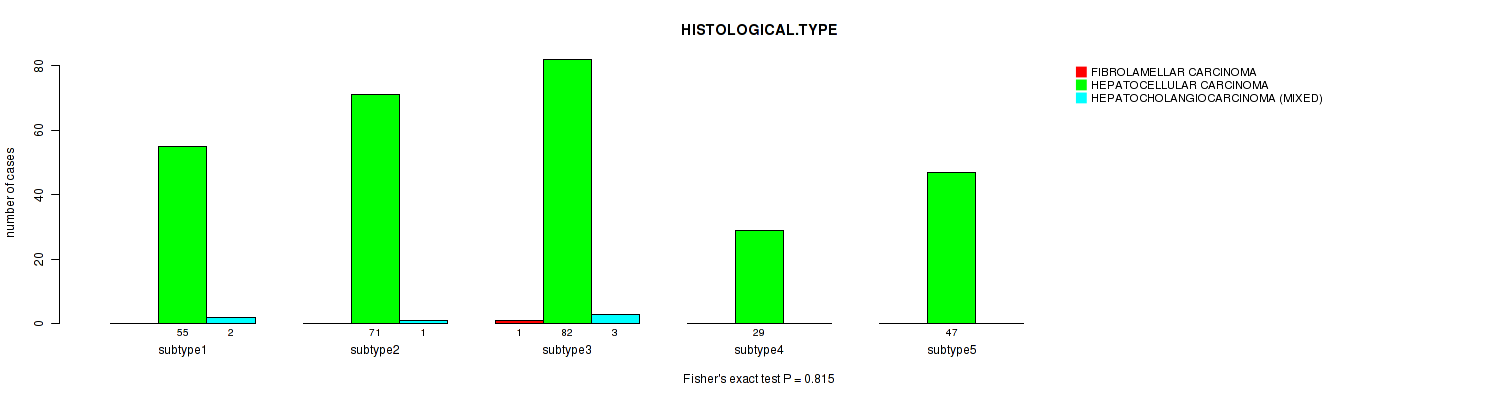
P value = 0.221 (Fisher's exact test), Q value = 1
Table S94. Clustering Approach #8: 'MIRseq Mature cHierClus subtypes' versus Clinical Feature #9: 'COMPLETENESS.OF.RESECTION'
| nPatients | R0 | R1 | R2 | RX |
|---|---|---|---|---|
| ALL | 255 | 14 | 1 | 15 |
| subtype1 | 51 | 4 | 0 | 2 |
| subtype2 | 61 | 3 | 0 | 6 |
| subtype3 | 75 | 4 | 1 | 6 |
| subtype4 | 22 | 3 | 0 | 1 |
| subtype5 | 46 | 0 | 0 | 0 |
Figure S86. Get High-res Image Clustering Approach #8: 'MIRseq Mature cHierClus subtypes' versus Clinical Feature #9: 'COMPLETENESS.OF.RESECTION'

P value = 0.00564 (Fisher's exact test), Q value = 0.42
Table S95. Clustering Approach #8: 'MIRseq Mature cHierClus subtypes' versus Clinical Feature #10: 'RACE'
| nPatients | AMERICAN INDIAN OR ALASKA NATIVE | ASIAN | BLACK OR AFRICAN AMERICAN | WHITE |
|---|---|---|---|---|
| ALL | 1 | 138 | 15 | 128 |
| subtype1 | 0 | 38 | 1 | 18 |
| subtype2 | 0 | 21 | 6 | 40 |
| subtype3 | 0 | 43 | 4 | 36 |
| subtype4 | 0 | 11 | 3 | 15 |
| subtype5 | 1 | 25 | 1 | 19 |
Figure S87. Get High-res Image Clustering Approach #8: 'MIRseq Mature cHierClus subtypes' versus Clinical Feature #10: 'RACE'
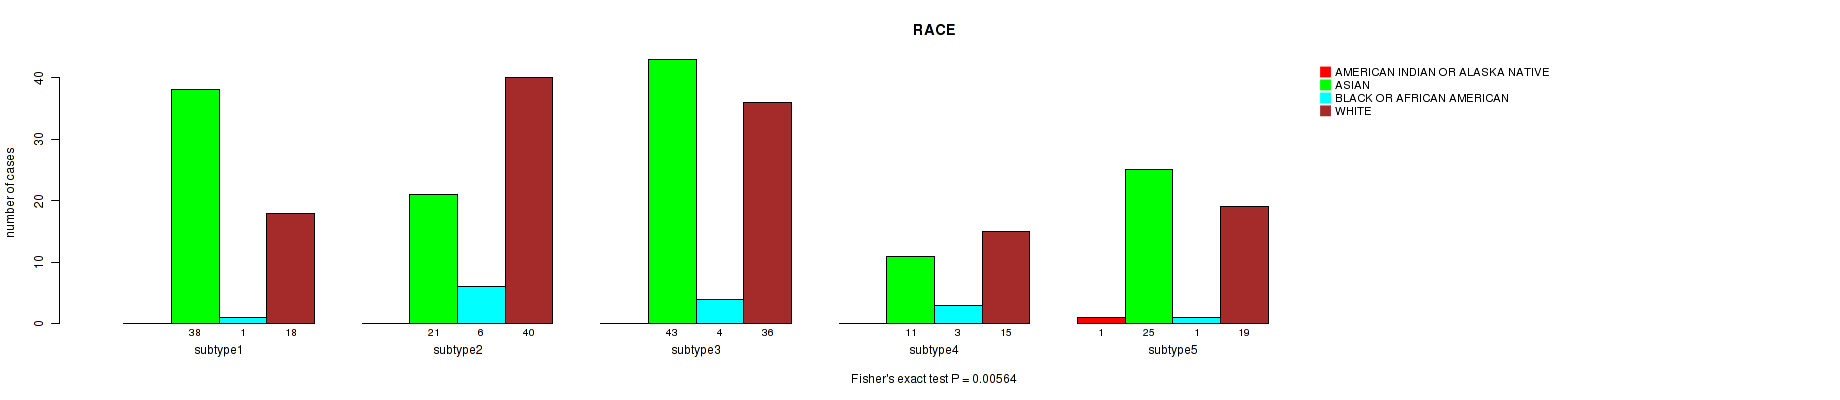
P value = 0.696 (Fisher's exact test), Q value = 1
Table S96. Clustering Approach #8: 'MIRseq Mature cHierClus subtypes' versus Clinical Feature #11: 'ETHNICITY'
| nPatients | HISPANIC OR LATINO | NOT HISPANIC OR LATINO |
|---|---|---|
| ALL | 9 | 267 |
| subtype1 | 3 | 53 |
| subtype2 | 1 | 65 |
| subtype3 | 3 | 79 |
| subtype4 | 0 | 28 |
| subtype5 | 2 | 42 |
Figure S88. Get High-res Image Clustering Approach #8: 'MIRseq Mature cHierClus subtypes' versus Clinical Feature #11: 'ETHNICITY'

-
Cluster data file = LIHC-TP.mergedcluster.txt
-
Clinical data file = LIHC-TP.merged_data.txt
-
Number of patients = 317
-
Number of clustering approaches = 8
-
Number of selected clinical features = 11
-
Exclude small clusters that include fewer than K patients, K = 3
consensus non-negative matrix factorization clustering approach (Brunet et al. 2004)
Resampling-based clustering method (Monti et al. 2003)
For survival clinical features, the Kaplan-Meier survival curves of tumors with and without gene mutations were plotted and the statistical significance P values were estimated by logrank test (Bland and Altman 2004) using the 'survdiff' function in R
For binary clinical features, two-tailed Fisher's exact tests (Fisher 1922) were used to estimate the P values using the 'fisher.test' function in R
For multiple hypothesis correction, Q value is the False Discovery Rate (FDR) analogue of the P value (Benjamini and Hochberg 1995), defined as the minimum FDR at which the test may be called significant. We used the 'Benjamini and Hochberg' method of 'p.adjust' function in R to convert P values into Q values.
In addition to the links below, the full results of the analysis summarized in this report can also be downloaded programmatically using firehose_get, or interactively from either the Broad GDAC website or TCGA Data Coordination Center Portal.