This pipeline computes the correlation between significantly recurrent gene mutations and selected clinical features.
Testing the association between mutation status of 18 genes and 11 clinical features across 188 patients, 4 significant findings detected with Q value < 0.25.
-
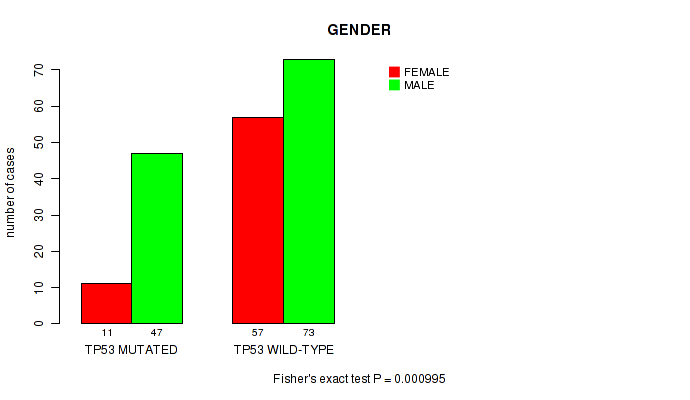
TP53 mutation correlated to 'GENDER' and 'RACE'.
-
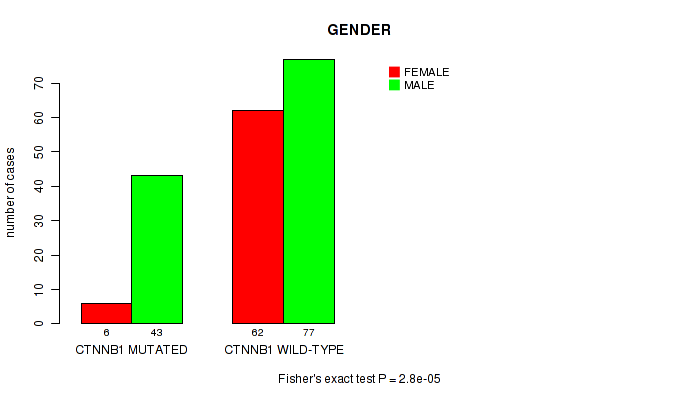
CTNNB1 mutation correlated to 'GENDER'.
-
BAP1 mutation correlated to 'GENDER'.
Table 1. Get Full Table Overview of the association between mutation status of 18 genes and 11 clinical features. Shown in the table are P values (Q values). Thresholded by Q value < 0.25, 4 significant findings detected.
|
Clinical Features |
Time to Death |
AGE |
NEOPLASM DISEASESTAGE |
PATHOLOGY T STAGE |
PATHOLOGY N STAGE |
PATHOLOGY M STAGE |
GENDER |
HISTOLOGICAL TYPE |
COMPLETENESS OF RESECTION |
RACE | ETHNICITY | ||
| nMutated (%) | nWild-Type | logrank test | Wilcoxon-test | Fisher's exact test | Fisher's exact test | Fisher's exact test | Fisher's exact test | Fisher's exact test | Fisher's exact test | Fisher's exact test | Fisher's exact test | Fisher's exact test | |
| TP53 | 58 (31%) | 130 |
0.383 (1.00) |
0.0967 (1.00) |
0.225 (1.00) |
0.0546 (1.00) |
0.562 (1.00) |
0.553 (1.00) |
0.000995 (0.194) |
0.69 (1.00) |
1 (1.00) |
0.00018 (0.0355) |
1 (1.00) |
| CTNNB1 | 49 (26%) | 139 |
0.989 (1.00) |
0.171 (1.00) |
0.77 (1.00) |
0.561 (1.00) |
0.159 (1.00) |
0.45 (1.00) |
2.8e-05 (0.00554) |
0.681 (1.00) |
0.125 (1.00) |
0.251 (1.00) |
1 (1.00) |
| BAP1 | 10 (5%) | 178 |
0.208 (1.00) |
0.844 (1.00) |
0.0486 (1.00) |
0.0367 (1.00) |
0.186 (1.00) |
0.112 (1.00) |
0.000521 (0.102) |
1 (1.00) |
0.466 (1.00) |
1 (1.00) |
1 (1.00) |
| RB1 | 15 (8%) | 173 |
0.904 (1.00) |
0.00212 (0.412) |
0.443 (1.00) |
0.18 (1.00) |
1 (1.00) |
0.543 (1.00) |
0.409 (1.00) |
1 (1.00) |
0.534 (1.00) |
0.00654 (1.00) |
0.366 (1.00) |
| AXIN1 | 9 (5%) | 179 |
0.094 (1.00) |
0.773 (1.00) |
0.0657 (1.00) |
0.632 (1.00) |
1 (1.00) |
0.216 (1.00) |
1 (1.00) |
1 (1.00) |
0.29 (1.00) |
1 (1.00) |
0.212 (1.00) |
| TSC2 | 9 (5%) | 179 |
0.832 (1.00) |
0.485 (1.00) |
0.175 (1.00) |
0.0777 (1.00) |
1 (1.00) |
0.554 (1.00) |
0.725 (1.00) |
1 (1.00) |
0.549 (1.00) |
0.217 (1.00) |
0.188 (1.00) |
| ARID1A | 14 (7%) | 174 |
0.0597 (1.00) |
0.718 (1.00) |
0.323 (1.00) |
0.683 (1.00) |
1 (1.00) |
0.521 (1.00) |
1 (1.00) |
1 (1.00) |
0.206 (1.00) |
0.454 (1.00) |
1 (1.00) |
| IL6ST | 7 (4%) | 181 |
0.00279 (0.538) |
0.159 (1.00) |
0.953 (1.00) |
0.869 (1.00) |
1 (1.00) |
0.306 (1.00) |
1 (1.00) |
1 (1.00) |
0.681 (1.00) |
0.828 (1.00) |
1 (1.00) |
| ALB | 18 (10%) | 170 |
0.512 (1.00) |
0.0327 (1.00) |
0.252 (1.00) |
0.126 (1.00) |
0.249 (1.00) |
0.261 (1.00) |
0.0204 (1.00) |
1 (1.00) |
0.403 (1.00) |
0.00871 (1.00) |
1 (1.00) |
| HNF1A | 6 (3%) | 182 |
0.335 (1.00) |
0.198 (1.00) |
0.532 (1.00) |
0.377 (1.00) |
1 (1.00) |
1 (1.00) |
0.669 (1.00) |
1 (1.00) |
0.624 (1.00) |
1 (1.00) |
1 (1.00) |
| APOB | 23 (12%) | 165 |
0.819 (1.00) |
0.288 (1.00) |
0.172 (1.00) |
0.858 (1.00) |
1 (1.00) |
0.587 (1.00) |
0.49 (1.00) |
1 (1.00) |
0.676 (1.00) |
0.0586 (1.00) |
1 (1.00) |
| EEF1A1 | 5 (3%) | 183 |
0.0519 (1.00) |
0.339 (1.00) |
0.664 (1.00) |
0.389 (1.00) |
1 (1.00) |
1 (1.00) |
0.161 (1.00) |
1 (1.00) |
0.554 (1.00) |
0.184 (1.00) |
1 (1.00) |
| KIF19 | 9 (5%) | 179 |
0.0841 (1.00) |
0.0882 (1.00) |
0.961 (1.00) |
0.634 (1.00) |
1 (1.00) |
0.0829 (1.00) |
0.492 (1.00) |
1 (1.00) |
0.41 (1.00) |
0.657 (1.00) |
1 (1.00) |
| GNAS | 7 (4%) | 181 |
0.151 (1.00) |
1 (1.00) |
0.678 (1.00) |
0.315 (1.00) |
1 (1.00) |
0.461 (1.00) |
1 (1.00) |
1 (1.00) |
1 (1.00) |
0.696 (1.00) |
1 (1.00) |
| F5 | 4 (2%) | 184 |
0.464 (1.00) |
0.217 (1.00) |
0.615 (1.00) |
0.452 (1.00) |
1 (1.00) |
0.127 (1.00) |
1 (1.00) |
1 (1.00) |
1 (1.00) |
1 (1.00) |
1 (1.00) |
| PTEN | 5 (3%) | 183 |
0.239 (1.00) |
0.128 (1.00) |
1 (1.00) |
0.9 (1.00) |
1 (1.00) |
0.641 (1.00) |
0.655 (1.00) |
1 (1.00) |
0.111 (1.00) |
0.184 (1.00) |
0.137 (1.00) |
| HIST1H1C | 5 (3%) | 183 |
0.21 (1.00) |
0.853 (1.00) |
0.0371 (1.00) |
0.00618 (1.00) |
1 (1.00) |
1 (1.00) |
1 (1.00) |
0.102 (1.00) |
0.323 (1.00) |
0.0227 (1.00) |
1 (1.00) |
| DLK2 | 4 (2%) | 184 |
0.391 (1.00) |
0.707 (1.00) |
0.469 (1.00) |
0.272 (1.00) |
1 (1.00) |
0.321 (1.00) |
0.298 (1.00) |
1 (1.00) |
1 (1.00) |
0.362 (1.00) |
1 (1.00) |
P value = 0.000995 (Fisher's exact test), Q value = 0.19
Table S1. Gene #1: 'TP53 MUTATION STATUS' versus Clinical Feature #7: 'GENDER'
| nPatients | FEMALE | MALE |
|---|---|---|
| ALL | 68 | 120 |
| TP53 MUTATED | 11 | 47 |
| TP53 WILD-TYPE | 57 | 73 |
Figure S1. Get High-res Image Gene #1: 'TP53 MUTATION STATUS' versus Clinical Feature #7: 'GENDER'
P value = 0.00018 (Fisher's exact test), Q value = 0.035
Table S2. Gene #1: 'TP53 MUTATION STATUS' versus Clinical Feature #10: 'RACE'
| nPatients | AMERICAN INDIAN OR ALASKA NATIVE | ASIAN | BLACK OR AFRICAN AMERICAN | WHITE |
|---|---|---|---|---|
| ALL | 1 | 52 | 14 | 113 |
| TP53 MUTATED | 1 | 20 | 10 | 25 |
| TP53 WILD-TYPE | 0 | 32 | 4 | 88 |
Figure S2. Get High-res Image Gene #1: 'TP53 MUTATION STATUS' versus Clinical Feature #10: 'RACE'

P value = 2.8e-05 (Fisher's exact test), Q value = 0.0055
Table S3. Gene #2: 'CTNNB1 MUTATION STATUS' versus Clinical Feature #7: 'GENDER'
| nPatients | FEMALE | MALE |
|---|---|---|
| ALL | 68 | 120 |
| CTNNB1 MUTATED | 6 | 43 |
| CTNNB1 WILD-TYPE | 62 | 77 |
Figure S3. Get High-res Image Gene #2: 'CTNNB1 MUTATION STATUS' versus Clinical Feature #7: 'GENDER'
P value = 0.000521 (Fisher's exact test), Q value = 0.1
Table S4. Gene #5: 'BAP1 MUTATION STATUS' versus Clinical Feature #7: 'GENDER'
| nPatients | FEMALE | MALE |
|---|---|---|
| ALL | 68 | 120 |
| BAP1 MUTATED | 9 | 1 |
| BAP1 WILD-TYPE | 59 | 119 |
Figure S4. Get High-res Image Gene #5: 'BAP1 MUTATION STATUS' versus Clinical Feature #7: 'GENDER'

-
Mutation data file = transformed.cor.cli.txt
-
Clinical data file = LIHC-TP.merged_data.txt
-
Number of patients = 188
-
Number of significantly mutated genes = 18
-
Number of selected clinical features = 11
-
Exclude genes that fewer than K tumors have mutations, K = 3
For survival clinical features, the Kaplan-Meier survival curves of tumors with and without gene mutations were plotted and the statistical significance P values were estimated by logrank test (Bland and Altman 2004) using the 'survdiff' function in R
For binary or multi-class clinical features (nominal or ordinal), two-tailed Fisher's exact tests (Fisher 1922) were used to estimate the P values using the 'fisher.test' function in R
For multiple hypothesis correction, Q value is the False Discovery Rate (FDR) analogue of the P value (Benjamini and Hochberg 1995), defined as the minimum FDR at which the test may be called significant. We used the 'Benjamini and Hochberg' method of 'p.adjust' function in R to convert P values into Q values.
In addition to the links below, the full results of the analysis summarized in this report can also be downloaded programmatically using firehose_get, or interactively from either the Broad GDAC website or TCGA Data Coordination Center Portal.