This pipeline computes the correlation between significant copy number variation (cnv focal) genes and molecular subtypes.
Testing the association between copy number variation 21 focal events and 8 molecular subtypes across 87 patients, 22 significant findings detected with P value < 0.05 and Q value < 0.25.
-
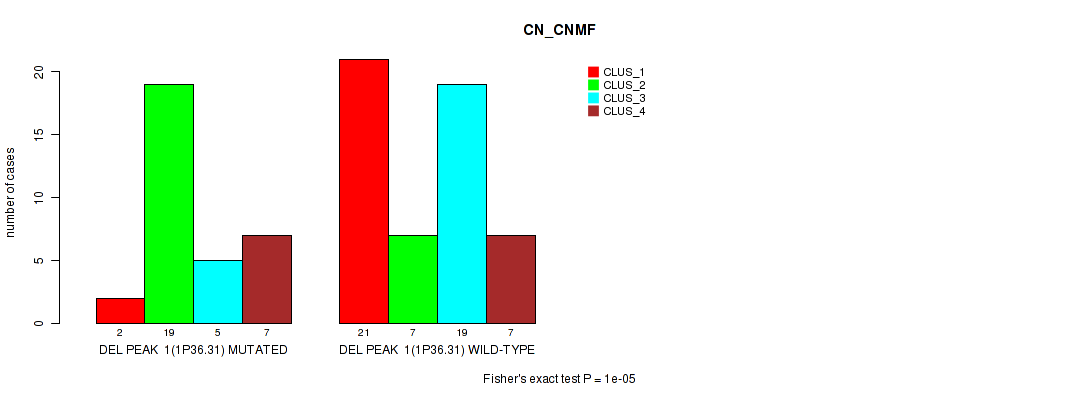
del_1p36.31 cnv correlated to 'CN_CNMF'.
-
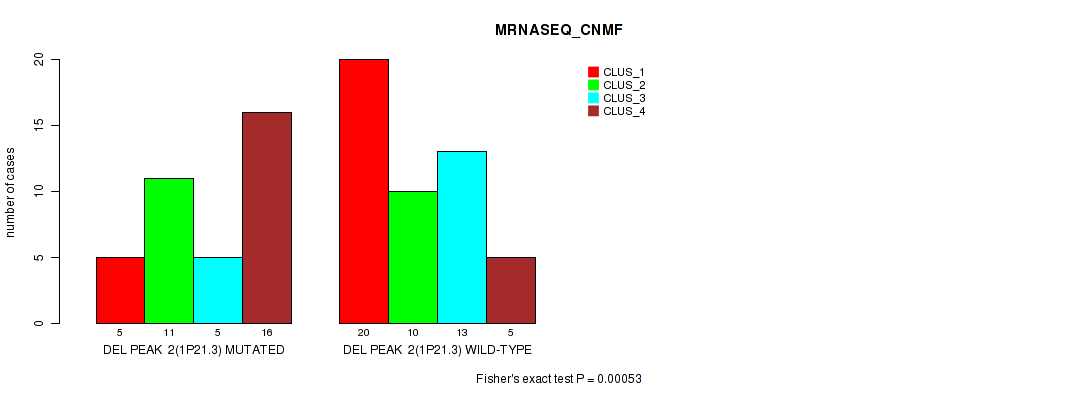
del_1p21.3 cnv correlated to 'MRNASEQ_CNMF'.
-
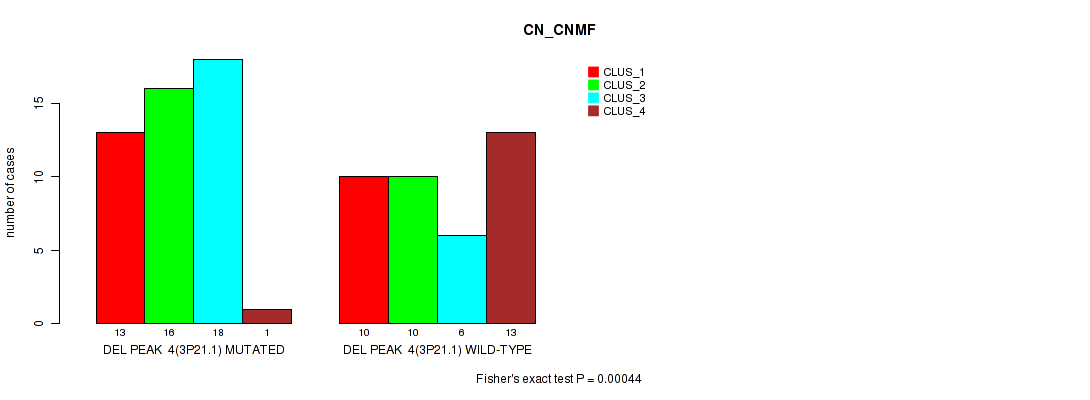
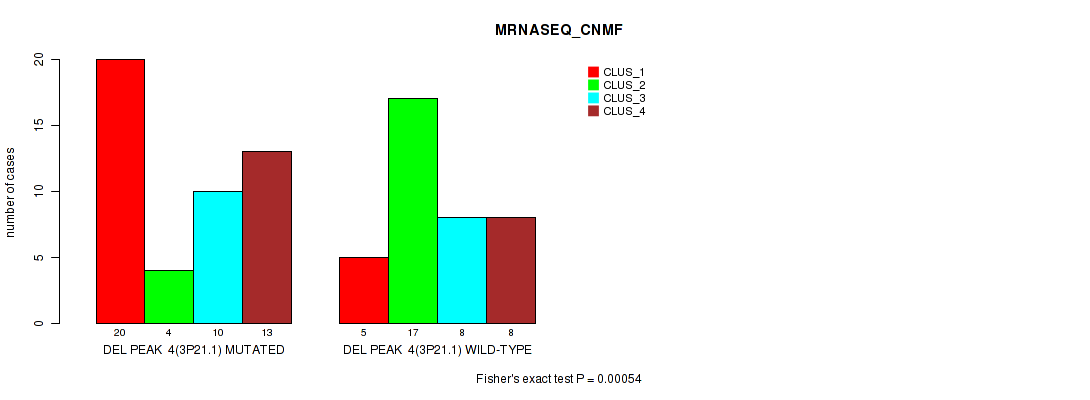
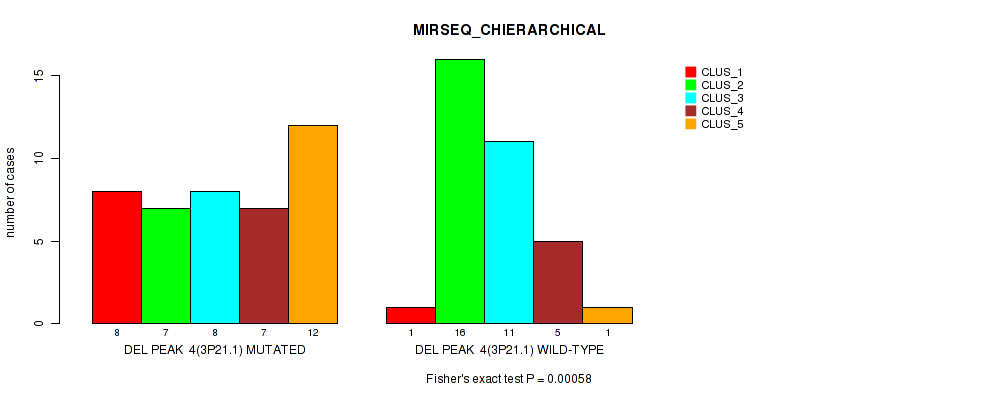
del_3p21.1 cnv correlated to 'CN_CNMF', 'MRNASEQ_CNMF', and 'MIRSEQ_CHIERARCHICAL'.
-
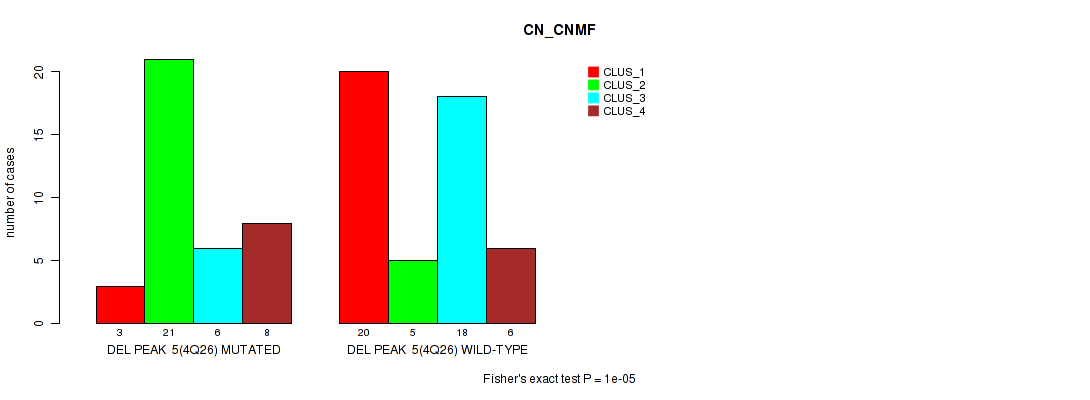
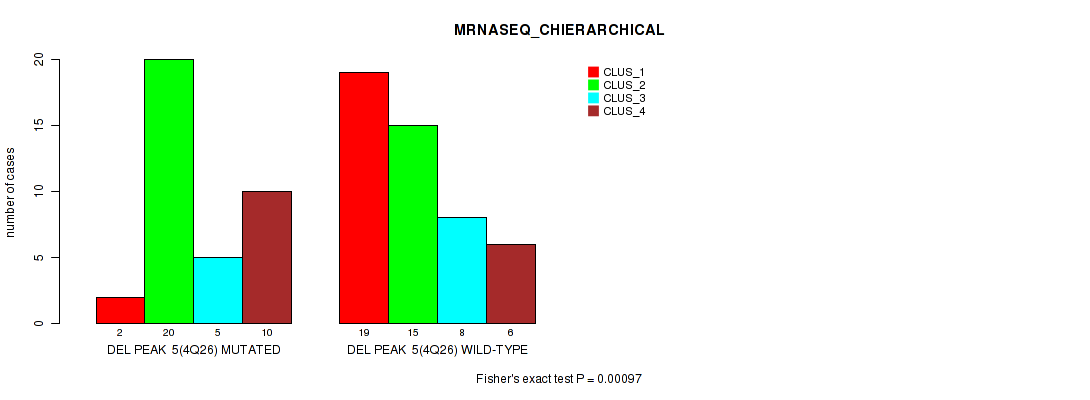
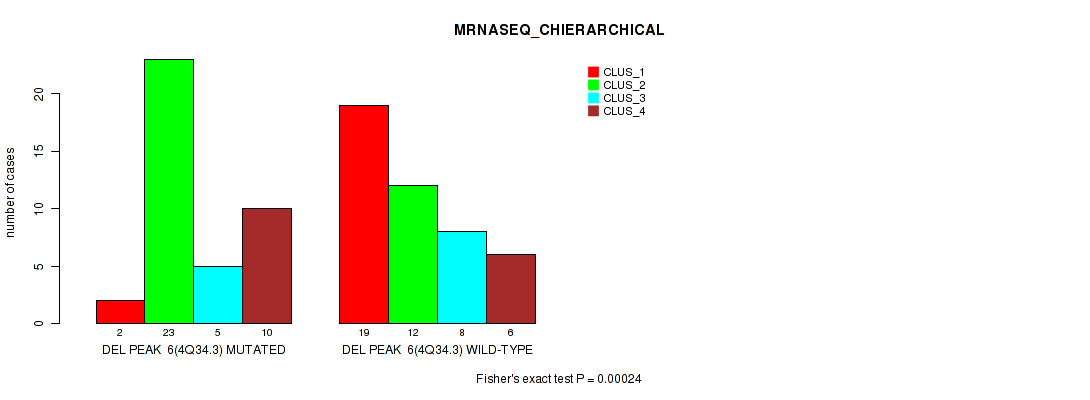
del_4q26 cnv correlated to 'CN_CNMF' and 'MRNASEQ_CHIERARCHICAL'.
-
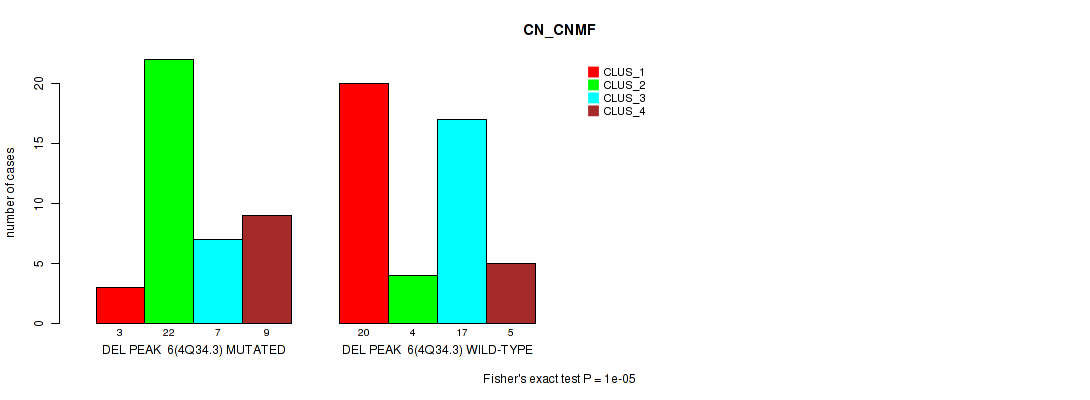
del_4q34.3 cnv correlated to 'CN_CNMF' and 'MRNASEQ_CHIERARCHICAL'.
-
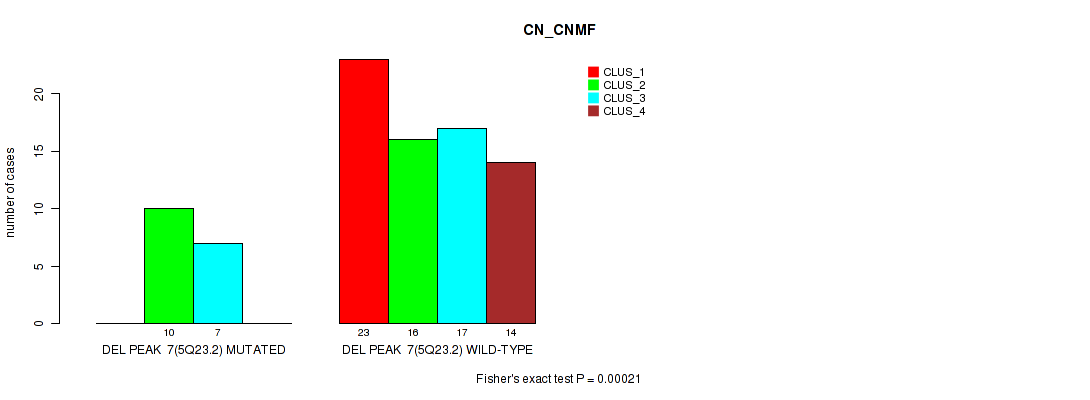
del_5q23.2 cnv correlated to 'CN_CNMF'.
-
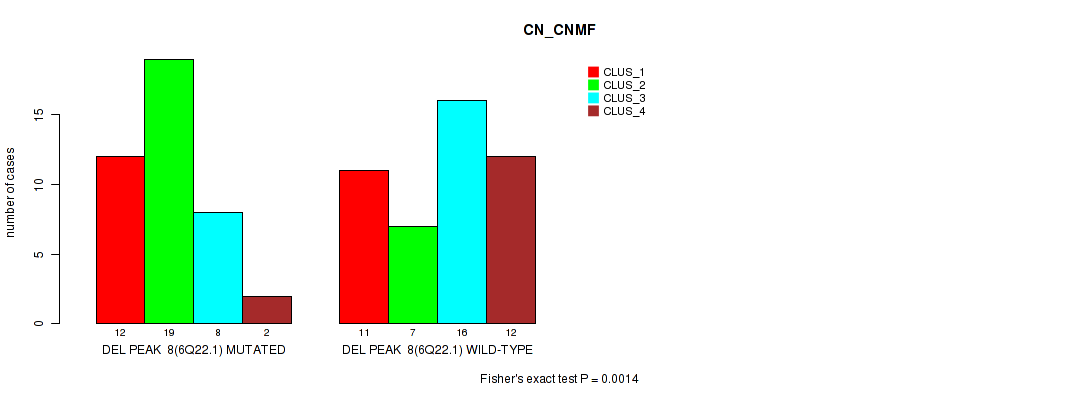
del_6q22.1 cnv correlated to 'CN_CNMF'.
-
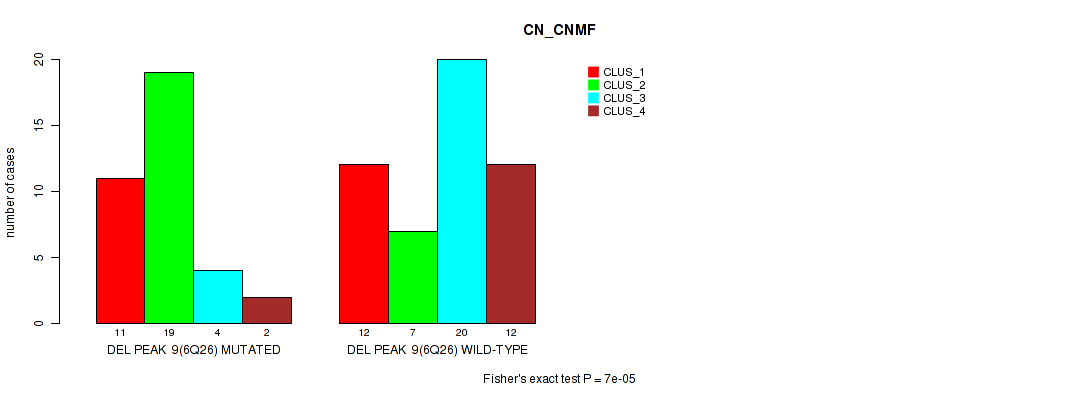
del_6q26 cnv correlated to 'CN_CNMF'.
-
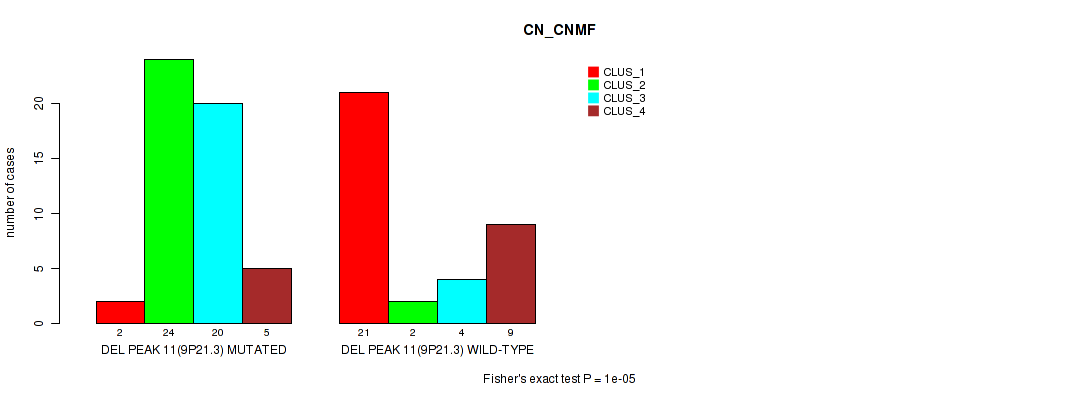
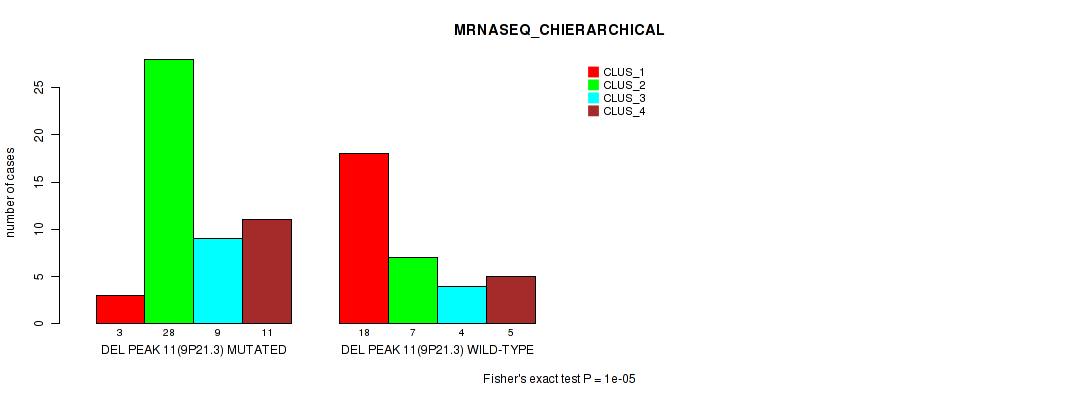
del_9p21.3 cnv correlated to 'CN_CNMF' and 'MRNASEQ_CHIERARCHICAL'.
-
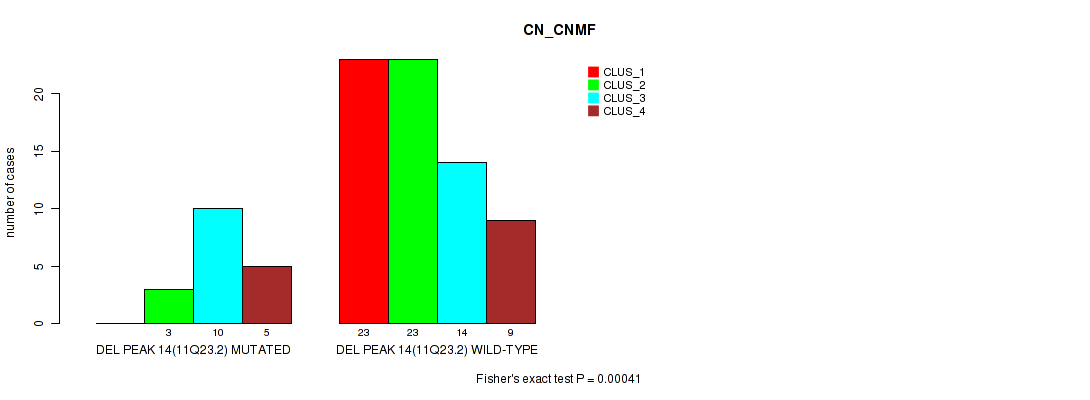
del_11q23.2 cnv correlated to 'CN_CNMF'.
-
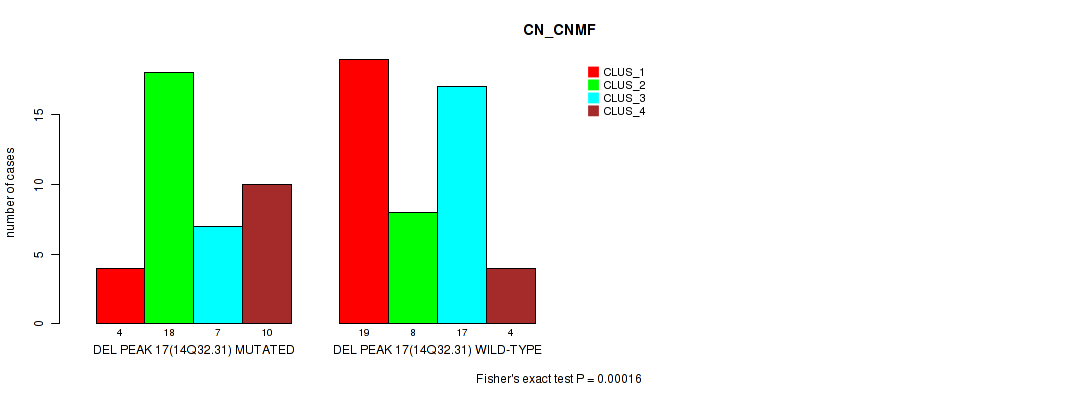
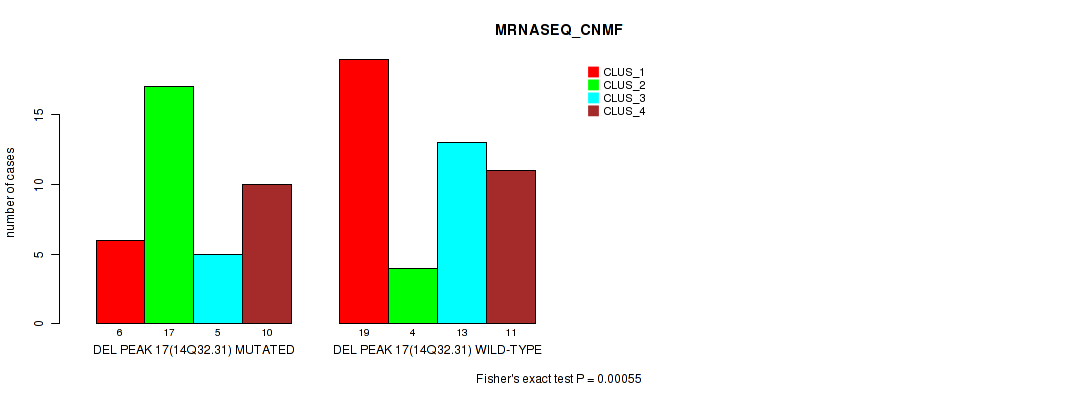
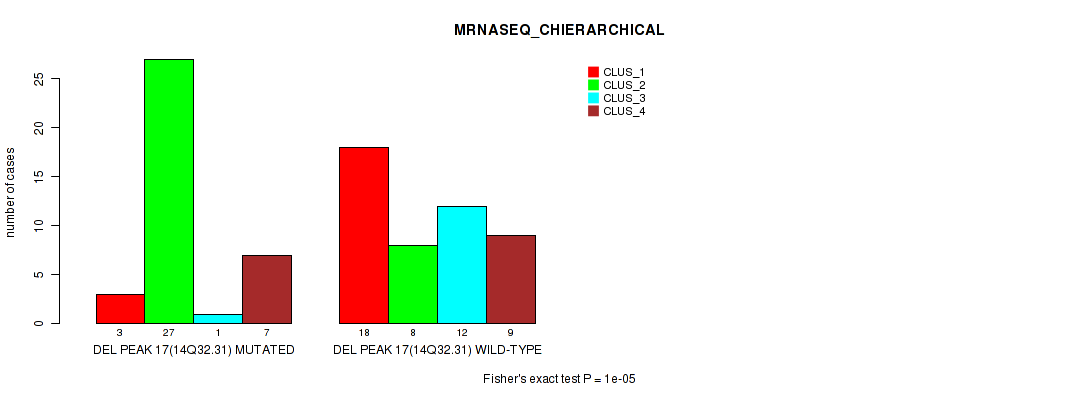
del_14q32.31 cnv correlated to 'CN_CNMF', 'MRNASEQ_CNMF', and 'MRNASEQ_CHIERARCHICAL'.
-
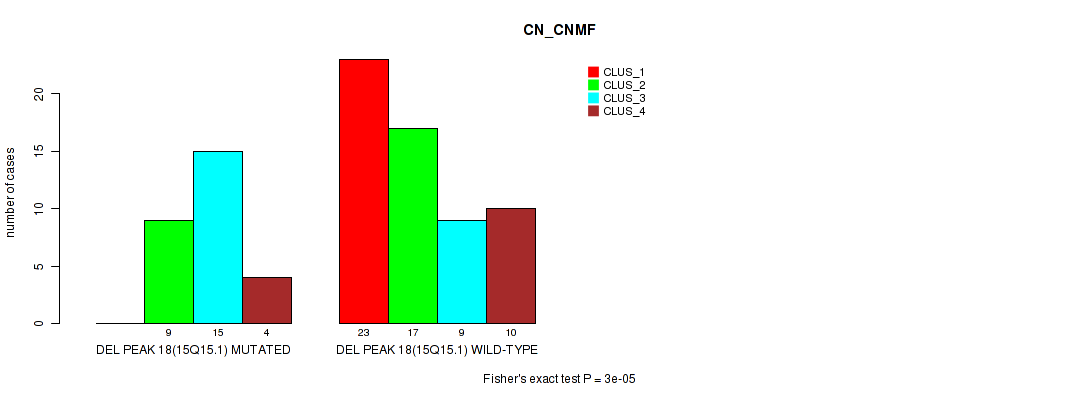
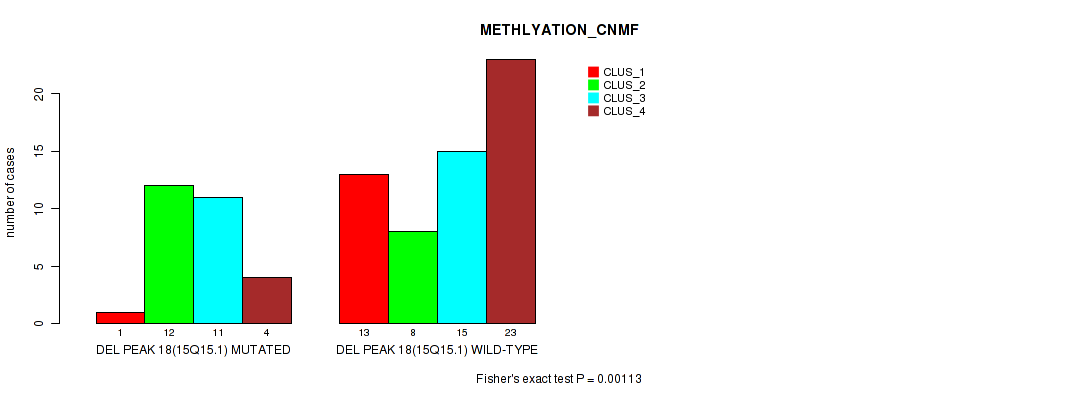
del_15q15.1 cnv correlated to 'CN_CNMF' and 'METHLYATION_CNMF'.
-
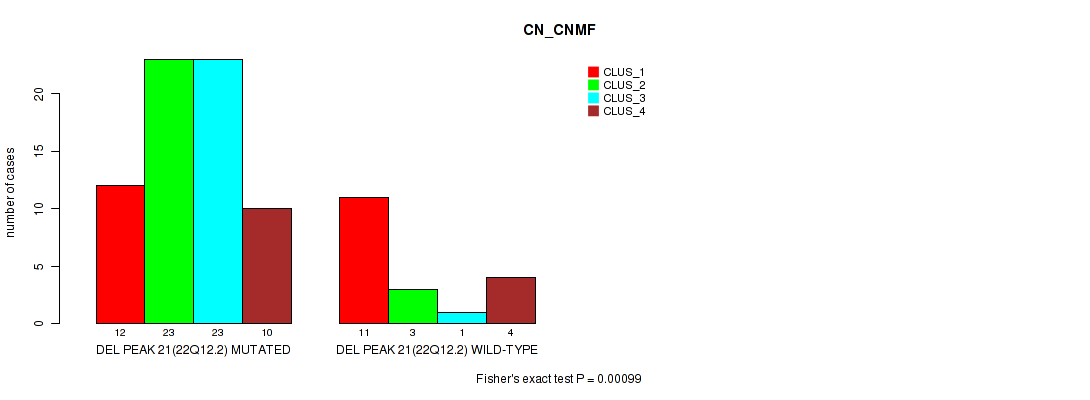
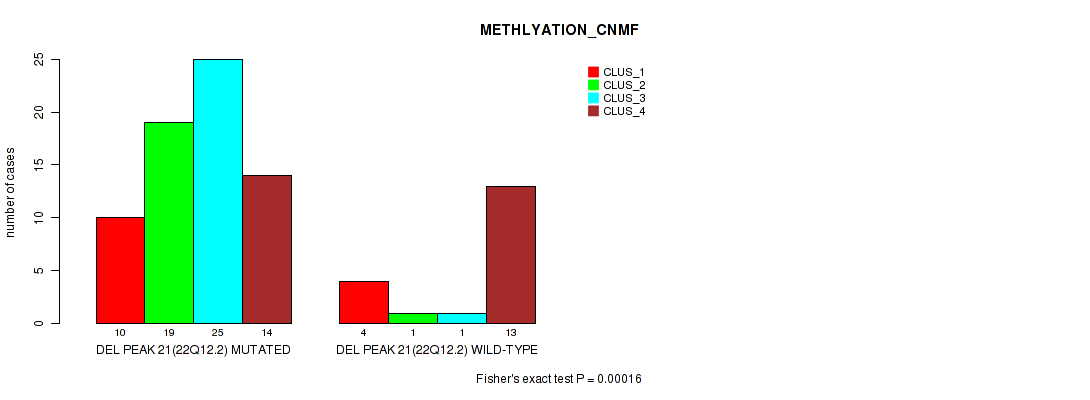
del_22q12.2 cnv correlated to 'CN_CNMF' and 'METHLYATION_CNMF'.
Table 1. Get Full Table Overview of the association between significant copy number variation of 21 focal events and 8 molecular subtypes. Shown in the table are P values (Q values). Thresholded by P value < 0.05 and Q value < 0.25, 22 significant findings detected.
|
Clinical Features |
CN CNMF |
METHLYATION CNMF |
MRNASEQ CNMF |
MRNASEQ CHIERARCHICAL |
MIRSEQ CNMF |
MIRSEQ CHIERARCHICAL |
MIRSEQ MATURE CNMF |
MIRSEQ MATURE CHIERARCHICAL |
||
| nCNV (%) | nWild-Type | Fisher's exact test | Fisher's exact test | Fisher's exact test | Fisher's exact test | Fisher's exact test | Fisher's exact test | Fisher's exact test | Fisher's exact test | |
| del 3p21 1 | 48 (55%) | 39 |
0.00044 (0.0682) |
0.124 (1.00) |
0.00054 (0.0826) |
0.399 (1.00) |
0.258 (1.00) |
0.00058 (0.0876) |
0.5 (1.00) |
0.00402 (0.571) |
| del 14q32 31 | 39 (45%) | 48 |
0.00016 (0.0256) |
0.314 (1.00) |
0.00055 (0.0836) |
1e-05 (0.00168) |
0.011 (1.00) |
0.0169 (1.00) |
0.0213 (1.00) |
0.027 (1.00) |
| del 4q26 | 38 (44%) | 49 |
1e-05 (0.00168) |
0.0572 (1.00) |
0.00305 (0.436) |
0.00097 (0.145) |
0.37 (1.00) |
0.41 (1.00) |
0.872 (1.00) |
0.325 (1.00) |
| del 4q34 3 | 41 (47%) | 46 |
1e-05 (0.00168) |
0.0168 (1.00) |
0.0507 (1.00) |
0.00024 (0.0377) |
0.237 (1.00) |
0.516 (1.00) |
0.582 (1.00) |
0.273 (1.00) |
| del 9p21 3 | 51 (59%) | 36 |
1e-05 (0.00168) |
0.00893 (1.00) |
0.00851 (1.00) |
1e-05 (0.00168) |
1 (1.00) |
0.791 (1.00) |
0.215 (1.00) |
0.0208 (1.00) |
| del 15q15 1 | 28 (32%) | 59 |
3e-05 (0.00486) |
0.00113 (0.167) |
0.0257 (1.00) |
0.146 (1.00) |
0.282 (1.00) |
0.509 (1.00) |
0.323 (1.00) |
0.32 (1.00) |
| del 22q12 2 | 68 (78%) | 19 |
0.00099 (0.148) |
0.00016 (0.0256) |
0.0667 (1.00) |
0.0134 (1.00) |
0.941 (1.00) |
0.801 (1.00) |
0.0348 (1.00) |
0.166 (1.00) |
| del 1p36 31 | 33 (38%) | 54 |
1e-05 (0.00168) |
0.185 (1.00) |
0.336 (1.00) |
0.0118 (1.00) |
0.0946 (1.00) |
0.128 (1.00) |
0.596 (1.00) |
0.223 (1.00) |
| del 1p21 3 | 37 (43%) | 50 |
0.108 (1.00) |
0.0264 (1.00) |
0.00053 (0.0816) |
0.0145 (1.00) |
0.956 (1.00) |
0.226 (1.00) |
0.431 (1.00) |
0.216 (1.00) |
| del 5q23 2 | 17 (20%) | 70 |
0.00021 (0.0332) |
0.379 (1.00) |
0.568 (1.00) |
0.212 (1.00) |
0.639 (1.00) |
0.862 (1.00) |
0.498 (1.00) |
0.567 (1.00) |
| del 6q22 1 | 41 (47%) | 46 |
0.0014 (0.206) |
0.243 (1.00) |
0.132 (1.00) |
0.165 (1.00) |
0.914 (1.00) |
0.688 (1.00) |
0.208 (1.00) |
0.288 (1.00) |
| del 6q26 | 36 (41%) | 51 |
7e-05 (0.0113) |
0.251 (1.00) |
0.649 (1.00) |
0.82 (1.00) |
0.639 (1.00) |
0.898 (1.00) |
0.376 (1.00) |
0.206 (1.00) |
| del 11q23 2 | 18 (21%) | 69 |
0.00041 (0.064) |
0.713 (1.00) |
0.0294 (1.00) |
0.0451 (1.00) |
0.725 (1.00) |
0.552 (1.00) |
0.33 (1.00) |
0.0649 (1.00) |
| del 2q35 | 17 (20%) | 70 |
0.09 (1.00) |
0.0546 (1.00) |
0.321 (1.00) |
0.00201 (0.291) |
0.432 (1.00) |
0.157 (1.00) |
0.0418 (1.00) |
0.267 (1.00) |
| del 8p23 2 | 18 (21%) | 69 |
0.867 (1.00) |
0.726 (1.00) |
0.967 (1.00) |
0.946 (1.00) |
0.703 (1.00) |
0.0831 (1.00) |
0.486 (1.00) |
0.786 (1.00) |
| del 10p15 3 | 28 (32%) | 59 |
0.00177 (0.258) |
0.00679 (0.957) |
0.0519 (1.00) |
0.0111 (1.00) |
1 (1.00) |
0.708 (1.00) |
0.302 (1.00) |
0.878 (1.00) |
| del 10q25 2 | 31 (36%) | 56 |
0.00298 (0.429) |
0.00757 (1.00) |
0.43 (1.00) |
0.583 (1.00) |
0.691 (1.00) |
0.717 (1.00) |
0.117 (1.00) |
0.475 (1.00) |
| del 12p13 31 | 11 (13%) | 76 |
0.118 (1.00) |
0.0126 (1.00) |
0.0275 (1.00) |
0.119 (1.00) |
0.273 (1.00) |
0.0869 (1.00) |
0.426 (1.00) |
0.295 (1.00) |
| del 13q14 11 | 43 (49%) | 44 |
0.0295 (1.00) |
0.177 (1.00) |
0.56 (1.00) |
0.364 (1.00) |
0.957 (1.00) |
0.947 (1.00) |
0.123 (1.00) |
0.677 (1.00) |
| del 16p13 3 | 6 (7%) | 81 |
0.0687 (1.00) |
0.238 (1.00) |
0.165 (1.00) |
0.0422 (1.00) |
1 (1.00) |
0.387 (1.00) |
1 (1.00) |
0.51 (1.00) |
| del 16q24 1 | 22 (25%) | 65 |
0.0265 (1.00) |
0.674 (1.00) |
0.101 (1.00) |
0.218 (1.00) |
0.503 (1.00) |
0.837 (1.00) |
0.549 (1.00) |
0.364 (1.00) |
P value = 1e-05 (Fisher's exact test), Q value = 0.0017
Table S1. Gene #1: 'del_1p36.31' versus Molecular Subtype #1: 'CN_CNMF'
| nPatients | CLUS_1 | CLUS_2 | CLUS_3 | CLUS_4 |
|---|---|---|---|---|
| ALL | 23 | 26 | 24 | 14 |
| DEL PEAK 1(1P36.31) MUTATED | 2 | 19 | 5 | 7 |
| DEL PEAK 1(1P36.31) WILD-TYPE | 21 | 7 | 19 | 7 |
Figure S1. Get High-res Image Gene #1: 'del_1p36.31' versus Molecular Subtype #1: 'CN_CNMF'
P value = 0.00053 (Fisher's exact test), Q value = 0.082
Table S2. Gene #2: 'del_1p21.3' versus Molecular Subtype #3: 'MRNASEQ_CNMF'
| nPatients | CLUS_1 | CLUS_2 | CLUS_3 | CLUS_4 |
|---|---|---|---|---|
| ALL | 25 | 21 | 18 | 21 |
| DEL PEAK 2(1P21.3) MUTATED | 5 | 11 | 5 | 16 |
| DEL PEAK 2(1P21.3) WILD-TYPE | 20 | 10 | 13 | 5 |
Figure S2. Get High-res Image Gene #2: 'del_1p21.3' versus Molecular Subtype #3: 'MRNASEQ_CNMF'
P value = 0.00044 (Fisher's exact test), Q value = 0.068
Table S3. Gene #4: 'del_3p21.1' versus Molecular Subtype #1: 'CN_CNMF'
| nPatients | CLUS_1 | CLUS_2 | CLUS_3 | CLUS_4 |
|---|---|---|---|---|
| ALL | 23 | 26 | 24 | 14 |
| DEL PEAK 4(3P21.1) MUTATED | 13 | 16 | 18 | 1 |
| DEL PEAK 4(3P21.1) WILD-TYPE | 10 | 10 | 6 | 13 |
Figure S3. Get High-res Image Gene #4: 'del_3p21.1' versus Molecular Subtype #1: 'CN_CNMF'
P value = 0.00054 (Fisher's exact test), Q value = 0.083
Table S4. Gene #4: 'del_3p21.1' versus Molecular Subtype #3: 'MRNASEQ_CNMF'
| nPatients | CLUS_1 | CLUS_2 | CLUS_3 | CLUS_4 |
|---|---|---|---|---|
| ALL | 25 | 21 | 18 | 21 |
| DEL PEAK 4(3P21.1) MUTATED | 20 | 4 | 10 | 13 |
| DEL PEAK 4(3P21.1) WILD-TYPE | 5 | 17 | 8 | 8 |
Figure S4. Get High-res Image Gene #4: 'del_3p21.1' versus Molecular Subtype #3: 'MRNASEQ_CNMF'
P value = 0.00058 (Fisher's exact test), Q value = 0.088
Table S5. Gene #4: 'del_3p21.1' versus Molecular Subtype #6: 'MIRSEQ_CHIERARCHICAL'
| nPatients | CLUS_1 | CLUS_2 | CLUS_3 | CLUS_4 | CLUS_5 |
|---|---|---|---|---|---|
| ALL | 9 | 23 | 19 | 12 | 13 |
| DEL PEAK 4(3P21.1) MUTATED | 8 | 7 | 8 | 7 | 12 |
| DEL PEAK 4(3P21.1) WILD-TYPE | 1 | 16 | 11 | 5 | 1 |
Figure S5. Get High-res Image Gene #4: 'del_3p21.1' versus Molecular Subtype #6: 'MIRSEQ_CHIERARCHICAL'
P value = 1e-05 (Fisher's exact test), Q value = 0.0017
Table S6. Gene #5: 'del_4q26' versus Molecular Subtype #1: 'CN_CNMF'
| nPatients | CLUS_1 | CLUS_2 | CLUS_3 | CLUS_4 |
|---|---|---|---|---|
| ALL | 23 | 26 | 24 | 14 |
| DEL PEAK 5(4Q26) MUTATED | 3 | 21 | 6 | 8 |
| DEL PEAK 5(4Q26) WILD-TYPE | 20 | 5 | 18 | 6 |
Figure S6. Get High-res Image Gene #5: 'del_4q26' versus Molecular Subtype #1: 'CN_CNMF'
P value = 0.00097 (Fisher's exact test), Q value = 0.15
Table S7. Gene #5: 'del_4q26' versus Molecular Subtype #4: 'MRNASEQ_CHIERARCHICAL'
| nPatients | CLUS_1 | CLUS_2 | CLUS_3 | CLUS_4 |
|---|---|---|---|---|
| ALL | 21 | 35 | 13 | 16 |
| DEL PEAK 5(4Q26) MUTATED | 2 | 20 | 5 | 10 |
| DEL PEAK 5(4Q26) WILD-TYPE | 19 | 15 | 8 | 6 |
Figure S7. Get High-res Image Gene #5: 'del_4q26' versus Molecular Subtype #4: 'MRNASEQ_CHIERARCHICAL'
P value = 1e-05 (Fisher's exact test), Q value = 0.0017
Table S8. Gene #6: 'del_4q34.3' versus Molecular Subtype #1: 'CN_CNMF'
| nPatients | CLUS_1 | CLUS_2 | CLUS_3 | CLUS_4 |
|---|---|---|---|---|
| ALL | 23 | 26 | 24 | 14 |
| DEL PEAK 6(4Q34.3) MUTATED | 3 | 22 | 7 | 9 |
| DEL PEAK 6(4Q34.3) WILD-TYPE | 20 | 4 | 17 | 5 |
Figure S8. Get High-res Image Gene #6: 'del_4q34.3' versus Molecular Subtype #1: 'CN_CNMF'
P value = 0.00024 (Fisher's exact test), Q value = 0.038
Table S9. Gene #6: 'del_4q34.3' versus Molecular Subtype #4: 'MRNASEQ_CHIERARCHICAL'
| nPatients | CLUS_1 | CLUS_2 | CLUS_3 | CLUS_4 |
|---|---|---|---|---|
| ALL | 21 | 35 | 13 | 16 |
| DEL PEAK 6(4Q34.3) MUTATED | 2 | 23 | 5 | 10 |
| DEL PEAK 6(4Q34.3) WILD-TYPE | 19 | 12 | 8 | 6 |
Figure S9. Get High-res Image Gene #6: 'del_4q34.3' versus Molecular Subtype #4: 'MRNASEQ_CHIERARCHICAL'
P value = 0.00021 (Fisher's exact test), Q value = 0.033
Table S10. Gene #7: 'del_5q23.2' versus Molecular Subtype #1: 'CN_CNMF'
| nPatients | CLUS_1 | CLUS_2 | CLUS_3 | CLUS_4 |
|---|---|---|---|---|
| ALL | 23 | 26 | 24 | 14 |
| DEL PEAK 7(5Q23.2) MUTATED | 0 | 10 | 7 | 0 |
| DEL PEAK 7(5Q23.2) WILD-TYPE | 23 | 16 | 17 | 14 |
Figure S10. Get High-res Image Gene #7: 'del_5q23.2' versus Molecular Subtype #1: 'CN_CNMF'
P value = 0.0014 (Fisher's exact test), Q value = 0.21
Table S11. Gene #8: 'del_6q22.1' versus Molecular Subtype #1: 'CN_CNMF'
| nPatients | CLUS_1 | CLUS_2 | CLUS_3 | CLUS_4 |
|---|---|---|---|---|
| ALL | 23 | 26 | 24 | 14 |
| DEL PEAK 8(6Q22.1) MUTATED | 12 | 19 | 8 | 2 |
| DEL PEAK 8(6Q22.1) WILD-TYPE | 11 | 7 | 16 | 12 |
Figure S11. Get High-res Image Gene #8: 'del_6q22.1' versus Molecular Subtype #1: 'CN_CNMF'
P value = 7e-05 (Fisher's exact test), Q value = 0.011
Table S12. Gene #9: 'del_6q26' versus Molecular Subtype #1: 'CN_CNMF'
| nPatients | CLUS_1 | CLUS_2 | CLUS_3 | CLUS_4 |
|---|---|---|---|---|
| ALL | 23 | 26 | 24 | 14 |
| DEL PEAK 9(6Q26) MUTATED | 11 | 19 | 4 | 2 |
| DEL PEAK 9(6Q26) WILD-TYPE | 12 | 7 | 20 | 12 |
Figure S12. Get High-res Image Gene #9: 'del_6q26' versus Molecular Subtype #1: 'CN_CNMF'
P value = 1e-05 (Fisher's exact test), Q value = 0.0017
Table S13. Gene #11: 'del_9p21.3' versus Molecular Subtype #1: 'CN_CNMF'
| nPatients | CLUS_1 | CLUS_2 | CLUS_3 | CLUS_4 |
|---|---|---|---|---|
| ALL | 23 | 26 | 24 | 14 |
| DEL PEAK 11(9P21.3) MUTATED | 2 | 24 | 20 | 5 |
| DEL PEAK 11(9P21.3) WILD-TYPE | 21 | 2 | 4 | 9 |
Figure S13. Get High-res Image Gene #11: 'del_9p21.3' versus Molecular Subtype #1: 'CN_CNMF'
P value = 1e-05 (Fisher's exact test), Q value = 0.0017
Table S14. Gene #11: 'del_9p21.3' versus Molecular Subtype #4: 'MRNASEQ_CHIERARCHICAL'
| nPatients | CLUS_1 | CLUS_2 | CLUS_3 | CLUS_4 |
|---|---|---|---|---|
| ALL | 21 | 35 | 13 | 16 |
| DEL PEAK 11(9P21.3) MUTATED | 3 | 28 | 9 | 11 |
| DEL PEAK 11(9P21.3) WILD-TYPE | 18 | 7 | 4 | 5 |
Figure S14. Get High-res Image Gene #11: 'del_9p21.3' versus Molecular Subtype #4: 'MRNASEQ_CHIERARCHICAL'
P value = 0.00041 (Fisher's exact test), Q value = 0.064
Table S15. Gene #14: 'del_11q23.2' versus Molecular Subtype #1: 'CN_CNMF'
| nPatients | CLUS_1 | CLUS_2 | CLUS_3 | CLUS_4 |
|---|---|---|---|---|
| ALL | 23 | 26 | 24 | 14 |
| DEL PEAK 14(11Q23.2) MUTATED | 0 | 3 | 10 | 5 |
| DEL PEAK 14(11Q23.2) WILD-TYPE | 23 | 23 | 14 | 9 |
Figure S15. Get High-res Image Gene #14: 'del_11q23.2' versus Molecular Subtype #1: 'CN_CNMF'
P value = 0.00016 (Fisher's exact test), Q value = 0.026
Table S16. Gene #17: 'del_14q32.31' versus Molecular Subtype #1: 'CN_CNMF'
| nPatients | CLUS_1 | CLUS_2 | CLUS_3 | CLUS_4 |
|---|---|---|---|---|
| ALL | 23 | 26 | 24 | 14 |
| DEL PEAK 17(14Q32.31) MUTATED | 4 | 18 | 7 | 10 |
| DEL PEAK 17(14Q32.31) WILD-TYPE | 19 | 8 | 17 | 4 |
Figure S16. Get High-res Image Gene #17: 'del_14q32.31' versus Molecular Subtype #1: 'CN_CNMF'
P value = 0.00055 (Fisher's exact test), Q value = 0.084
Table S17. Gene #17: 'del_14q32.31' versus Molecular Subtype #3: 'MRNASEQ_CNMF'
| nPatients | CLUS_1 | CLUS_2 | CLUS_3 | CLUS_4 |
|---|---|---|---|---|
| ALL | 25 | 21 | 18 | 21 |
| DEL PEAK 17(14Q32.31) MUTATED | 6 | 17 | 5 | 10 |
| DEL PEAK 17(14Q32.31) WILD-TYPE | 19 | 4 | 13 | 11 |
Figure S17. Get High-res Image Gene #17: 'del_14q32.31' versus Molecular Subtype #3: 'MRNASEQ_CNMF'
P value = 1e-05 (Fisher's exact test), Q value = 0.0017
Table S18. Gene #17: 'del_14q32.31' versus Molecular Subtype #4: 'MRNASEQ_CHIERARCHICAL'
| nPatients | CLUS_1 | CLUS_2 | CLUS_3 | CLUS_4 |
|---|---|---|---|---|
| ALL | 21 | 35 | 13 | 16 |
| DEL PEAK 17(14Q32.31) MUTATED | 3 | 27 | 1 | 7 |
| DEL PEAK 17(14Q32.31) WILD-TYPE | 18 | 8 | 12 | 9 |
Figure S18. Get High-res Image Gene #17: 'del_14q32.31' versus Molecular Subtype #4: 'MRNASEQ_CHIERARCHICAL'
P value = 3e-05 (Fisher's exact test), Q value = 0.0049
Table S19. Gene #18: 'del_15q15.1' versus Molecular Subtype #1: 'CN_CNMF'
| nPatients | CLUS_1 | CLUS_2 | CLUS_3 | CLUS_4 |
|---|---|---|---|---|
| ALL | 23 | 26 | 24 | 14 |
| DEL PEAK 18(15Q15.1) MUTATED | 0 | 9 | 15 | 4 |
| DEL PEAK 18(15Q15.1) WILD-TYPE | 23 | 17 | 9 | 10 |
Figure S19. Get High-res Image Gene #18: 'del_15q15.1' versus Molecular Subtype #1: 'CN_CNMF'
P value = 0.00113 (Fisher's exact test), Q value = 0.17
Table S20. Gene #18: 'del_15q15.1' versus Molecular Subtype #2: 'METHLYATION_CNMF'
| nPatients | CLUS_1 | CLUS_2 | CLUS_3 | CLUS_4 |
|---|---|---|---|---|
| ALL | 14 | 20 | 26 | 27 |
| DEL PEAK 18(15Q15.1) MUTATED | 1 | 12 | 11 | 4 |
| DEL PEAK 18(15Q15.1) WILD-TYPE | 13 | 8 | 15 | 23 |
Figure S20. Get High-res Image Gene #18: 'del_15q15.1' versus Molecular Subtype #2: 'METHLYATION_CNMF'
P value = 0.00099 (Fisher's exact test), Q value = 0.15
Table S21. Gene #21: 'del_22q12.2' versus Molecular Subtype #1: 'CN_CNMF'
| nPatients | CLUS_1 | CLUS_2 | CLUS_3 | CLUS_4 |
|---|---|---|---|---|
| ALL | 23 | 26 | 24 | 14 |
| DEL PEAK 21(22Q12.2) MUTATED | 12 | 23 | 23 | 10 |
| DEL PEAK 21(22Q12.2) WILD-TYPE | 11 | 3 | 1 | 4 |
Figure S21. Get High-res Image Gene #21: 'del_22q12.2' versus Molecular Subtype #1: 'CN_CNMF'
P value = 0.00016 (Fisher's exact test), Q value = 0.026
Table S22. Gene #21: 'del_22q12.2' versus Molecular Subtype #2: 'METHLYATION_CNMF'
| nPatients | CLUS_1 | CLUS_2 | CLUS_3 | CLUS_4 |
|---|---|---|---|---|
| ALL | 14 | 20 | 26 | 27 |
| DEL PEAK 21(22Q12.2) MUTATED | 10 | 19 | 25 | 14 |
| DEL PEAK 21(22Q12.2) WILD-TYPE | 4 | 1 | 1 | 13 |
Figure S22. Get High-res Image Gene #21: 'del_22q12.2' versus Molecular Subtype #2: 'METHLYATION_CNMF'
-
Copy number data file = transformed.cor.cli.txt
-
Molecular subtype file = MESO-TP.transferedmergedcluster.txt
-
Number of patients = 87
-
Number of significantly focal cnvs = 21
-
Number of molecular subtypes = 8
-
Exclude genes that fewer than K tumors have alterations, K = 3
For binary or multi-class clinical features (nominal or ordinal), two-tailed Fisher's exact tests (Fisher 1922) were used to estimate the P values using the 'fisher.test' function in R
For multiple hypothesis correction, Q value is the False Discovery Rate (FDR) analogue of the P value (Benjamini and Hochberg 1995), defined as the minimum FDR at which the test may be called significant. We used the 'Benjamini and Hochberg' method of 'p.adjust' function in R to convert P values into Q values.
In addition to the links below, the full results of the analysis summarized in this report can also be downloaded programmatically using firehose_get, or interactively from either the Broad GDAC website or TCGA Data Coordination Center Portal.