This pipeline computes the correlation between significant arm-level copy number variations (cnvs) and selected clinical features.
Testing the association between copy number variation 55 arm-level events and 7 clinical features across 39 patients, 2 significant findings detected with Q value < 0.25.
-
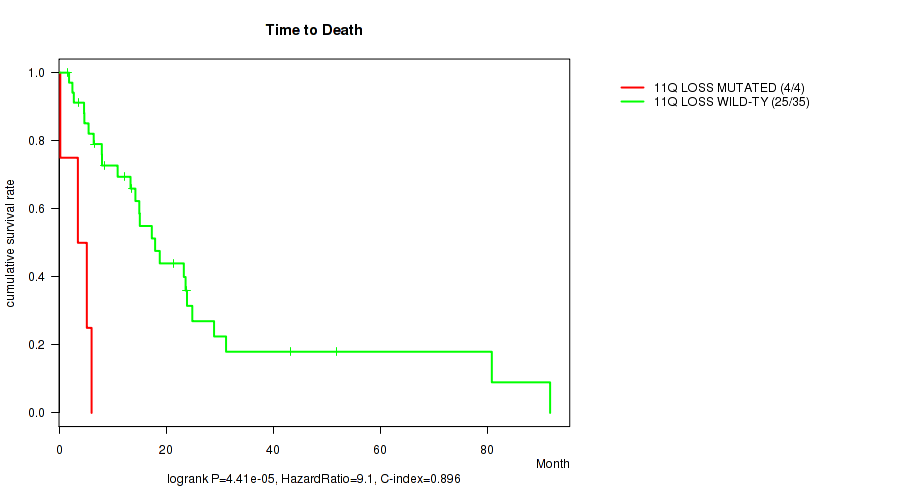
11q loss cnv correlated to 'Time to Death'.
-
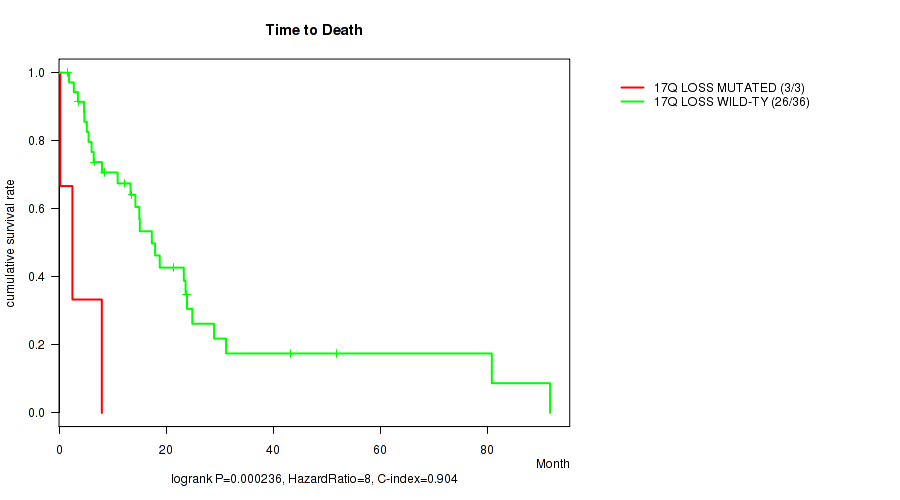
17q loss cnv correlated to 'Time to Death'.
Table 1. Get Full Table Overview of the association between significant copy number variation of 55 arm-level events and 7 clinical features. Shown in the table are P values (Q values). Thresholded by Q value < 0.25, 2 significant findings detected.
|
Clinical Features |
Time to Death |
AGE |
NEOPLASM DISEASESTAGE |
PATHOLOGY T STAGE |
PATHOLOGY N STAGE |
PATHOLOGY M STAGE |
GENDER | ||
| nCNV (%) | nWild-Type | logrank test | Wilcoxon-test | Fisher's exact test | Fisher's exact test | Fisher's exact test | Fisher's exact test | Fisher's exact test | |
| 11q loss | 4 (10%) | 35 |
4.41e-05 (0.0168) |
0.186 (1.00) |
0.0304 (1.00) |
0.0567 (1.00) |
1 (1.00) |
0.618 (1.00) |
0.556 (1.00) |
| 17q loss | 3 (8%) | 36 |
0.000236 (0.0896) |
0.279 (1.00) |
0.187 (1.00) |
0.28 (1.00) |
0.51 (1.00) |
1 (1.00) |
|
| 1p gain | 5 (13%) | 34 |
0.236 (1.00) |
0.866 (1.00) |
0.315 (1.00) |
1 (1.00) |
0.613 (1.00) |
0.672 (1.00) |
1 (1.00) |
| 1q gain | 12 (31%) | 27 |
0.351 (1.00) |
0.703 (1.00) |
0.282 (1.00) |
0.434 (1.00) |
0.483 (1.00) |
0.181 (1.00) |
1 (1.00) |
| 3p gain | 10 (26%) | 29 |
0.715 (1.00) |
0.872 (1.00) |
0.459 (1.00) |
0.344 (1.00) |
0.73 (1.00) |
1 (1.00) |
0.696 (1.00) |
| 3q gain | 12 (31%) | 27 |
0.543 (1.00) |
0.988 (1.00) |
0.369 (1.00) |
0.278 (1.00) |
0.745 (1.00) |
0.538 (1.00) |
0.693 (1.00) |
| 5p gain | 9 (23%) | 30 |
0.647 (1.00) |
0.0916 (1.00) |
0.617 (1.00) |
0.336 (1.00) |
0.847 (1.00) |
0.774 (1.00) |
0.669 (1.00) |
| 5q gain | 5 (13%) | 34 |
0.865 (1.00) |
0.199 (1.00) |
0.313 (1.00) |
0.379 (1.00) |
1 (1.00) |
0.376 (1.00) |
0.587 (1.00) |
| 7p gain | 10 (26%) | 29 |
0.258 (1.00) |
0.43 (1.00) |
0.695 (1.00) |
0.346 (1.00) |
0.0953 (1.00) |
1 (1.00) |
1 (1.00) |
| 7q gain | 9 (23%) | 30 |
0.417 (1.00) |
0.151 (1.00) |
1 (1.00) |
0.12 (1.00) |
0.0581 (1.00) |
1 (1.00) |
1 (1.00) |
| 8p gain | 7 (18%) | 32 |
0.111 (1.00) |
0.322 (1.00) |
0.737 (1.00) |
0.0351 (1.00) |
0.157 (1.00) |
1 (1.00) |
0.653 (1.00) |
| 8q gain | 8 (21%) | 31 |
0.0302 (1.00) |
0.577 (1.00) |
0.359 (1.00) |
0.0528 (1.00) |
0.156 (1.00) |
0.742 (1.00) |
0.653 (1.00) |
| 11q gain | 3 (8%) | 36 |
0.257 (1.00) |
0.0162 (1.00) |
0.795 (1.00) |
0.387 (1.00) |
0.677 (1.00) |
0.102 (1.00) |
1 (1.00) |
| 12p gain | 11 (28%) | 28 |
0.985 (1.00) |
0.888 (1.00) |
0.36 (1.00) |
0.409 (1.00) |
0.0947 (1.00) |
1 (1.00) |
0.228 (1.00) |
| 12q gain | 11 (28%) | 28 |
0.985 (1.00) |
0.888 (1.00) |
0.357 (1.00) |
0.409 (1.00) |
0.0944 (1.00) |
1 (1.00) |
0.228 (1.00) |
| 15q gain | 4 (10%) | 35 |
0.107 (1.00) |
0.0461 (1.00) |
0.375 (1.00) |
0.654 (1.00) |
0.551 (1.00) |
1 (1.00) |
1 (1.00) |
| 16p gain | 7 (18%) | 32 |
0.679 (1.00) |
0.133 (1.00) |
0.497 (1.00) |
1 (1.00) |
0.228 (1.00) |
1 (1.00) |
1 (1.00) |
| 16q gain | 8 (21%) | 31 |
0.377 (1.00) |
0.0647 (1.00) |
0.494 (1.00) |
0.875 (1.00) |
0.367 (1.00) |
1 (1.00) |
0.399 (1.00) |
| 17p gain | 3 (8%) | 36 |
0.519 (1.00) |
0.0813 (1.00) |
0.0631 (1.00) |
0.0379 (1.00) |
0.428 (1.00) |
1 (1.00) |
0.556 (1.00) |
| 17q gain | 10 (26%) | 29 |
0.682 (1.00) |
0.747 (1.00) |
0.693 (1.00) |
1 (1.00) |
0.0101 (1.00) |
1 (1.00) |
0.402 (1.00) |
| 18p gain | 3 (8%) | 36 |
0.0881 (1.00) |
0.937 (1.00) |
0.233 (1.00) |
0.778 (1.00) |
1 (1.00) |
1 (1.00) |
1 (1.00) |
| 18q gain | 3 (8%) | 36 |
0.0881 (1.00) |
0.937 (1.00) |
0.236 (1.00) |
0.776 (1.00) |
1 (1.00) |
1 (1.00) |
1 (1.00) |
| 19p gain | 5 (13%) | 34 |
0.236 (1.00) |
0.983 (1.00) |
0.35 (1.00) |
1 (1.00) |
0.615 (1.00) |
0.671 (1.00) |
1 (1.00) |
| 19q gain | 4 (10%) | 35 |
0.125 (1.00) |
0.889 (1.00) |
0.283 (1.00) |
0.652 (1.00) |
0.766 (1.00) |
1 (1.00) |
1 (1.00) |
| 20p gain | 5 (13%) | 34 |
0.00108 (0.408) |
0.333 (1.00) |
0.313 (1.00) |
1 (1.00) |
0.767 (1.00) |
1 (1.00) |
1 (1.00) |
| 20q gain | 6 (15%) | 33 |
0.404 (1.00) |
0.969 (1.00) |
0.254 (1.00) |
1 (1.00) |
0.616 (1.00) |
0.462 (1.00) |
0.308 (1.00) |
| 21q gain | 4 (10%) | 35 |
0.0146 (1.00) |
0.219 (1.00) |
0.87 (1.00) |
1 (1.00) |
0.768 (1.00) |
1 (1.00) |
1 (1.00) |
| 1p loss | 6 (15%) | 33 |
0.779 (1.00) |
0.815 (1.00) |
0.817 (1.00) |
0.528 (1.00) |
0.317 (1.00) |
1 (1.00) |
0.636 (1.00) |
| 2p loss | 3 (8%) | 36 |
0.151 (1.00) |
0.979 (1.00) |
1 (1.00) |
0.776 (1.00) |
1 (1.00) |
1 (1.00) |
0.156 (1.00) |
| 2q loss | 3 (8%) | 36 |
0.14 (1.00) |
0.224 (1.00) |
1 (1.00) |
0.779 (1.00) |
1 (1.00) |
1 (1.00) |
0.0131 (1.00) |
| 3p loss | 3 (8%) | 36 |
0.0313 (1.00) |
0.526 (1.00) |
0.233 (1.00) |
0.776 (1.00) |
0.506 (1.00) |
0.556 (1.00) |
|
| 4p loss | 18 (46%) | 21 |
0.147 (1.00) |
0.247 (1.00) |
0.266 (1.00) |
0.911 (1.00) |
0.451 (1.00) |
0.488 (1.00) |
0.465 (1.00) |
| 4q loss | 16 (41%) | 23 |
0.235 (1.00) |
0.241 (1.00) |
0.391 (1.00) |
0.909 (1.00) |
0.594 (1.00) |
0.209 (1.00) |
0.264 (1.00) |
| 5q loss | 3 (8%) | 36 |
0.3 (1.00) |
0.692 (1.00) |
1 (1.00) |
1 (1.00) |
0.431 (1.00) |
1 (1.00) |
0.556 (1.00) |
| 6p loss | 5 (13%) | 34 |
0.00205 (0.776) |
0.023 (1.00) |
0.0535 (1.00) |
0.305 (1.00) |
1 (1.00) |
1 (1.00) |
0.302 (1.00) |
| 6q loss | 13 (33%) | 26 |
0.826 (1.00) |
1 (1.00) |
0.0634 (1.00) |
0.746 (1.00) |
0.101 (1.00) |
0.835 (1.00) |
0.445 (1.00) |
| 8p loss | 4 (10%) | 35 |
0.11 (1.00) |
0.43 (1.00) |
0.0284 (1.00) |
0.218 (1.00) |
0.764 (1.00) |
0.619 (1.00) |
1 (1.00) |
| 9p loss | 14 (36%) | 25 |
0.0492 (1.00) |
0.271 (1.00) |
0.34 (1.00) |
0.121 (1.00) |
0.748 (1.00) |
0.832 (1.00) |
0.279 (1.00) |
| 9q loss | 12 (31%) | 27 |
0.111 (1.00) |
0.626 (1.00) |
0.327 (1.00) |
0.669 (1.00) |
0.2 (1.00) |
1 (1.00) |
0.693 (1.00) |
| 10p loss | 10 (26%) | 29 |
0.0666 (1.00) |
0.772 (1.00) |
0.567 (1.00) |
0.343 (1.00) |
1 (1.00) |
0.137 (1.00) |
0.402 (1.00) |
| 10q loss | 9 (23%) | 30 |
0.0258 (1.00) |
0.581 (1.00) |
0.62 (1.00) |
0.69 (1.00) |
0.589 (1.00) |
0.443 (1.00) |
1 (1.00) |
| 11p loss | 3 (8%) | 36 |
0.095 (1.00) |
0.0175 (1.00) |
0.0122 (1.00) |
0.0763 (1.00) |
0.508 (1.00) |
0.556 (1.00) |
|
| 13q loss | 20 (51%) | 19 |
0.114 (1.00) |
0.278 (1.00) |
0.801 (1.00) |
0.7 (1.00) |
0.0976 (1.00) |
0.0733 (1.00) |
0.48 (1.00) |
| 14q loss | 15 (38%) | 24 |
0.273 (1.00) |
0.347 (1.00) |
0.512 (1.00) |
0.39 (1.00) |
0.88 (1.00) |
0.365 (1.00) |
0.141 (1.00) |
| 15q loss | 7 (18%) | 32 |
0.0547 (1.00) |
0.7 (1.00) |
0.137 (1.00) |
0.649 (1.00) |
0.639 (1.00) |
0.543 (1.00) |
0.653 (1.00) |
| 16p loss | 5 (13%) | 34 |
0.0153 (1.00) |
0.0882 (1.00) |
0.207 (1.00) |
0.303 (1.00) |
0.447 (1.00) |
1 (1.00) |
1 (1.00) |
| 16q loss | 6 (15%) | 33 |
0.0274 (1.00) |
0.507 (1.00) |
0.254 (1.00) |
0.619 (1.00) |
0.803 (1.00) |
1 (1.00) |
0.636 (1.00) |
| 17p loss | 9 (23%) | 30 |
0.676 (1.00) |
0.867 (1.00) |
0.619 (1.00) |
1 (1.00) |
0.0657 (1.00) |
0.777 (1.00) |
0.4 (1.00) |
| 18p loss | 5 (13%) | 34 |
0.203 (1.00) |
0.628 (1.00) |
0.637 (1.00) |
0.829 (1.00) |
0.45 (1.00) |
1 (1.00) |
1 (1.00) |
| 18q loss | 7 (18%) | 32 |
0.282 (1.00) |
0.769 (1.00) |
0.944 (1.00) |
0.41 (1.00) |
0.408 (1.00) |
1 (1.00) |
0.344 (1.00) |
| 19q loss | 3 (8%) | 36 |
0.371 (1.00) |
0.476 (1.00) |
0.0447 (1.00) |
0.384 (1.00) |
0.00297 (1.00) |
0.556 (1.00) |
|
| 20p loss | 7 (18%) | 32 |
0.365 (1.00) |
0.409 (1.00) |
0.251 (1.00) |
0.748 (1.00) |
0.275 (1.00) |
0.541 (1.00) |
0.653 (1.00) |
| 21q loss | 5 (13%) | 34 |
0.127 (1.00) |
0.72 (1.00) |
0.0437 (1.00) |
0.375 (1.00) |
0.765 (1.00) |
0.381 (1.00) |
1 (1.00) |
| 22q loss | 31 (79%) | 8 |
0.768 (1.00) |
0.486 (1.00) |
0.532 (1.00) |
0.259 (1.00) |
0.681 (1.00) |
0.209 (1.00) |
1 (1.00) |
| xq loss | 12 (31%) | 27 |
0.361 (1.00) |
0.807 (1.00) |
0.438 (1.00) |
0.203 (1.00) |
0.565 (1.00) |
0.679 (1.00) |
0.693 (1.00) |
P value = 4.41e-05 (logrank test), Q value = 0.017
Table S1. Gene #41: '11q loss' versus Clinical Feature #1: 'Time to Death'
| nPatients | nDeath | Duration Range (Median), Month | |
|---|---|---|---|
| ALL | 39 | 29 | 0.2 - 91.7 (13.3) |
| 11Q LOSS MUTATED | 4 | 4 | 0.2 - 6.1 (4.4) |
| 11Q LOSS WILD-TYPE | 35 | 25 | 1.6 - 91.7 (14.3) |
Figure S1. Get High-res Image Gene #41: '11q loss' versus Clinical Feature #1: 'Time to Death'
P value = 0.000236 (logrank test), Q value = 0.09
Table S2. Gene #48: '17q loss' versus Clinical Feature #1: 'Time to Death'
| nPatients | nDeath | Duration Range (Median), Month | |
|---|---|---|---|
| ALL | 39 | 29 | 0.2 - 91.7 (13.3) |
| 17Q LOSS MUTATED | 3 | 3 | 0.2 - 8.0 (2.5) |
| 17Q LOSS WILD-TYPE | 36 | 26 | 1.6 - 91.7 (13.9) |
Figure S2. Get High-res Image Gene #48: '17q loss' versus Clinical Feature #1: 'Time to Death'
-
Copy number data file = transformed.cor.cli.txt
-
Clinical data file = MESO-TP.merged_data.txt
-
Number of patients = 39
-
Number of significantly arm-level cnvs = 55
-
Number of selected clinical features = 7
-
Exclude regions that fewer than K tumors have mutations, K = 3
For survival clinical features, the Kaplan-Meier survival curves of tumors with and without gene mutations were plotted and the statistical significance P values were estimated by logrank test (Bland and Altman 2004) using the 'survdiff' function in R
For binary or multi-class clinical features (nominal or ordinal), two-tailed Fisher's exact tests (Fisher 1922) were used to estimate the P values using the 'fisher.test' function in R
For multiple hypothesis correction, Q value is the False Discovery Rate (FDR) analogue of the P value (Benjamini and Hochberg 1995), defined as the minimum FDR at which the test may be called significant. We used the 'Benjamini and Hochberg' method of 'p.adjust' function in R to convert P values into Q values.
In addition to the links below, the full results of the analysis summarized in this report can also be downloaded programmatically using firehose_get, or interactively from either the Broad GDAC website or TCGA Data Coordination Center Portal.