This pipeline computes the correlation between significant copy number variation (cnv focal) genes and selected clinical features.
Testing the association between copy number variation 21 focal events and 7 clinical features across 39 patients, one significant finding detected with Q value < 0.25.
-
del_10p15.3 cnv correlated to 'Time to Death'.
Table 1. Get Full Table Overview of the association between significant copy number variation of 21 focal events and 7 clinical features. Shown in the table are P values (Q values). Thresholded by Q value < 0.25, one significant finding detected.
|
Clinical Features |
Time to Death |
AGE |
NEOPLASM DISEASESTAGE |
PATHOLOGY T STAGE |
PATHOLOGY N STAGE |
PATHOLOGY M STAGE |
GENDER | ||
| nCNV (%) | nWild-Type | logrank test | Wilcoxon-test | Fisher's exact test | Fisher's exact test | Fisher's exact test | Fisher's exact test | Fisher's exact test | |
| del 10p15 3 | 13 (33%) | 26 |
6.9e-06 (0.00101) |
0.56 (1.00) |
0.0296 (1.00) |
0.0028 (0.409) |
0.182 (1.00) |
0.553 (1.00) |
0.704 (1.00) |
| del 1p36 31 | 18 (46%) | 21 |
0.0419 (1.00) |
0.344 (1.00) |
0.266 (1.00) |
0.633 (1.00) |
0.775 (1.00) |
0.489 (1.00) |
1 (1.00) |
| del 1p21 3 | 18 (46%) | 21 |
0.855 (1.00) |
0.265 (1.00) |
0.105 (1.00) |
0.0794 (1.00) |
0.517 (1.00) |
0.22 (1.00) |
1 (1.00) |
| del 2q35 | 7 (18%) | 32 |
0.0484 (1.00) |
0.634 (1.00) |
0.501 (1.00) |
0.646 (1.00) |
0.212 (1.00) |
0.714 (1.00) |
0.00706 (1.00) |
| del 3p21 1 | 25 (64%) | 14 |
0.644 (1.00) |
0.379 (1.00) |
0.911 (1.00) |
0.2 (1.00) |
0.672 (1.00) |
1 (1.00) |
0.446 (1.00) |
| del 4q26 | 20 (51%) | 19 |
0.118 (1.00) |
0.778 (1.00) |
0.127 (1.00) |
0.308 (1.00) |
0.679 (1.00) |
0.182 (1.00) |
0.273 (1.00) |
| del 4q34 3 | 22 (56%) | 17 |
0.175 (1.00) |
0.192 (1.00) |
0.12 (1.00) |
0.914 (1.00) |
0.872 (1.00) |
0.093 (1.00) |
0.464 (1.00) |
| del 5q23 2 | 8 (21%) | 31 |
0.165 (1.00) |
0.113 (1.00) |
1 (1.00) |
0.343 (1.00) |
1 (1.00) |
0.207 (1.00) |
0.0862 (1.00) |
| del 6q22 1 | 20 (51%) | 19 |
0.469 (1.00) |
0.866 (1.00) |
0.311 (1.00) |
0.762 (1.00) |
0.21 (1.00) |
0.226 (1.00) |
0.155 (1.00) |
| del 6q26 | 17 (44%) | 22 |
0.912 (1.00) |
0.966 (1.00) |
0.38 (1.00) |
0.833 (1.00) |
0.059 (1.00) |
0.681 (1.00) |
1 (1.00) |
| del 8p23 2 | 7 (18%) | 32 |
0.0685 (1.00) |
0.521 (1.00) |
0.156 (1.00) |
0.0389 (1.00) |
0.276 (1.00) |
0.54 (1.00) |
0.653 (1.00) |
| del 9p21 3 | 25 (64%) | 14 |
0.00828 (1.00) |
0.837 (1.00) |
0.86 (1.00) |
0.202 (1.00) |
0.244 (1.00) |
0.077 (1.00) |
0.446 (1.00) |
| del 10q25 2 | 16 (41%) | 23 |
0.0993 (1.00) |
0.627 (1.00) |
0.955 (1.00) |
0.52 (1.00) |
0.206 (1.00) |
0.387 (1.00) |
0.711 (1.00) |
| del 11q23 2 | 8 (21%) | 31 |
0.0137 (1.00) |
0.958 (1.00) |
0.18 (1.00) |
0.506 (1.00) |
1 (1.00) |
1 (1.00) |
0.0862 (1.00) |
| del 12p13 31 | 6 (15%) | 33 |
0.406 (1.00) |
0.785 (1.00) |
0.452 (1.00) |
0.845 (1.00) |
0.796 (1.00) |
1 (1.00) |
1 (1.00) |
| del 13q14 11 | 23 (59%) | 16 |
0.483 (1.00) |
0.317 (1.00) |
0.83 (1.00) |
1 (1.00) |
0.0288 (1.00) |
0.033 (1.00) |
0.264 (1.00) |
| del 14q32 31 | 19 (49%) | 20 |
0.306 (1.00) |
0.778 (1.00) |
0.249 (1.00) |
1 (1.00) |
0.88 (1.00) |
0.284 (1.00) |
0.155 (1.00) |
| del 15q15 1 | 14 (36%) | 25 |
0.098 (1.00) |
0.93 (1.00) |
0.0931 (1.00) |
1 (1.00) |
1 (1.00) |
0.266 (1.00) |
0.721 (1.00) |
| del 16p13 3 | 5 (13%) | 34 |
0.339 (1.00) |
0.0882 (1.00) |
0.0951 (1.00) |
0.0142 (1.00) |
1 (1.00) |
1 (1.00) |
0.587 (1.00) |
| del 16q24 1 | 13 (33%) | 26 |
0.0136 (1.00) |
0.303 (1.00) |
0.9 (1.00) |
0.906 (1.00) |
0.868 (1.00) |
0.447 (1.00) |
0.704 (1.00) |
| del 22q12 2 | 32 (82%) | 7 |
0.507 (1.00) |
0.687 (1.00) |
0.443 (1.00) |
0.214 (1.00) |
0.683 (1.00) |
0.377 (1.00) |
1 (1.00) |
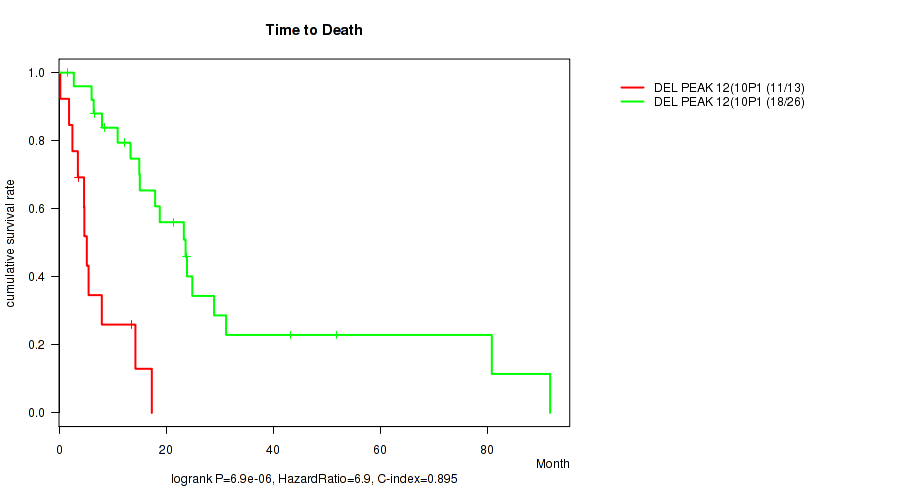
P value = 6.9e-06 (logrank test), Q value = 0.001
Table S1. Gene #12: 'del_10p15.3' versus Clinical Feature #1: 'Time to Death'
| nPatients | nDeath | Duration Range (Median), Month | |
|---|---|---|---|
| ALL | 39 | 29 | 0.2 - 91.7 (13.3) |
| DEL PEAK 12(10P15.3) MUTATED | 13 | 11 | 0.2 - 17.3 (4.7) |
| DEL PEAK 12(10P15.3) WILD-TYPE | 26 | 18 | 1.6 - 91.7 (18.4) |
Figure S1. Get High-res Image Gene #12: 'del_10p15.3' versus Clinical Feature #1: 'Time to Death'
-
Copy number data file = transformed.cor.cli.txt
-
Clinical data file = MESO-TP.merged_data.txt
-
Number of patients = 39
-
Number of significantly focal cnvs = 21
-
Number of selected clinical features = 7
-
Exclude genes that fewer than K tumors have mutations, K = 3
For survival clinical features, the Kaplan-Meier survival curves of tumors with and without gene mutations were plotted and the statistical significance P values were estimated by logrank test (Bland and Altman 2004) using the 'survdiff' function in R
For binary or multi-class clinical features (nominal or ordinal), two-tailed Fisher's exact tests (Fisher 1922) were used to estimate the P values using the 'fisher.test' function in R
For multiple hypothesis correction, Q value is the False Discovery Rate (FDR) analogue of the P value (Benjamini and Hochberg 1995), defined as the minimum FDR at which the test may be called significant. We used the 'Benjamini and Hochberg' method of 'p.adjust' function in R to convert P values into Q values.
In addition to the links below, the full results of the analysis summarized in this report can also be downloaded programmatically using firehose_get, or interactively from either the Broad GDAC website or TCGA Data Coordination Center Portal.