This pipeline computes the correlation between significant arm-level copy number variations (cnvs) and molecular subtypes.
Testing the association between copy number variation 72 arm-level events and 8 molecular subtypes across 87 patients, 12 significant findings detected with P value < 0.05 and Q value < 0.25.
-
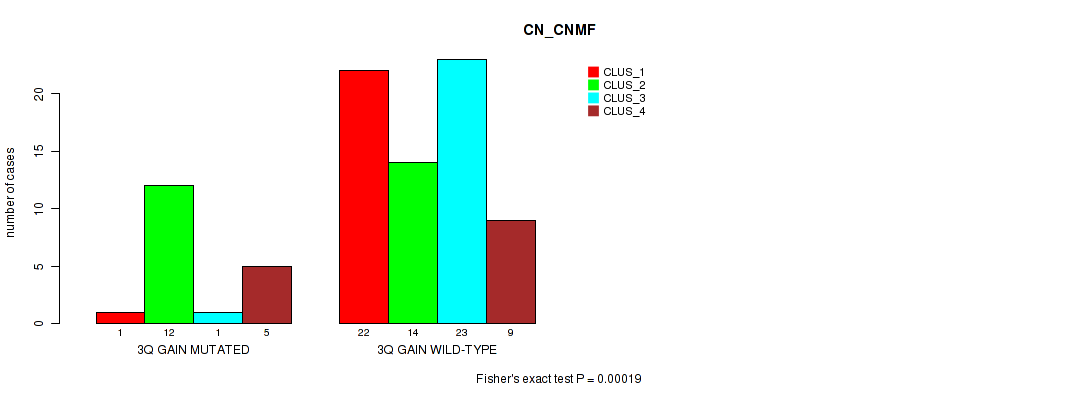
3q gain cnv correlated to 'CN_CNMF'.
-
12p gain cnv correlated to 'CN_CNMF'.
-
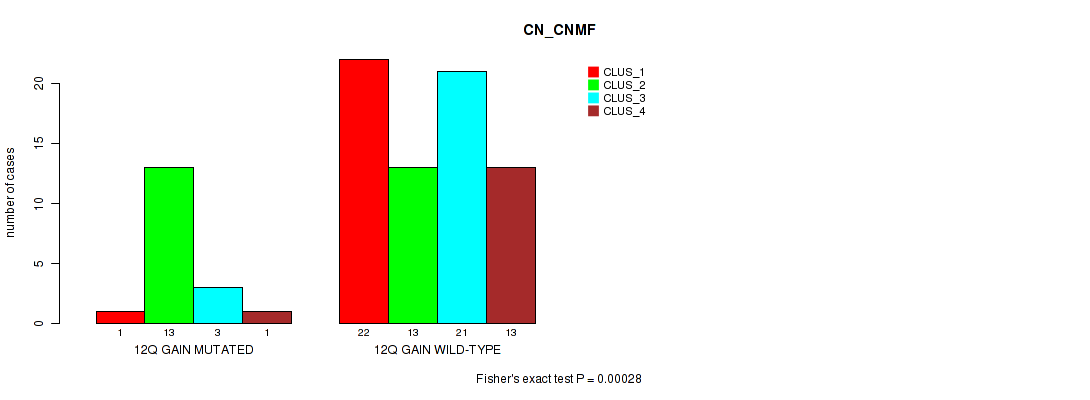
12q gain cnv correlated to 'CN_CNMF'.
-
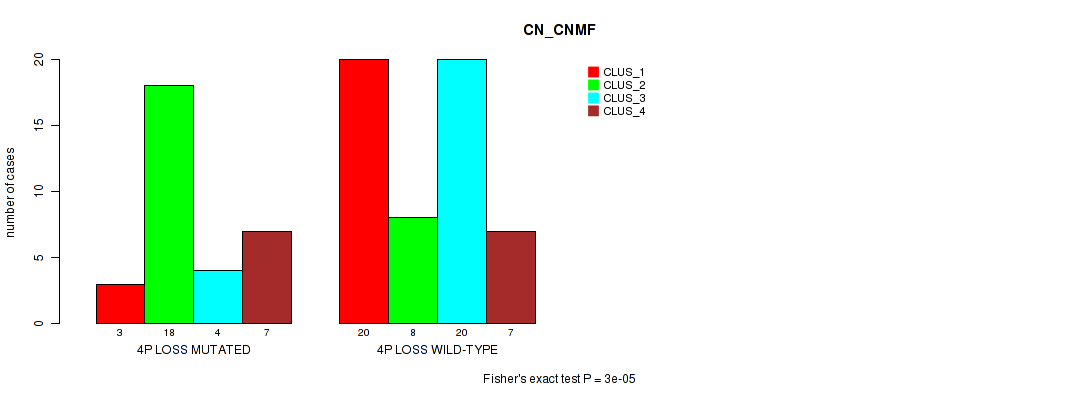
4p loss cnv correlated to 'CN_CNMF'.
-
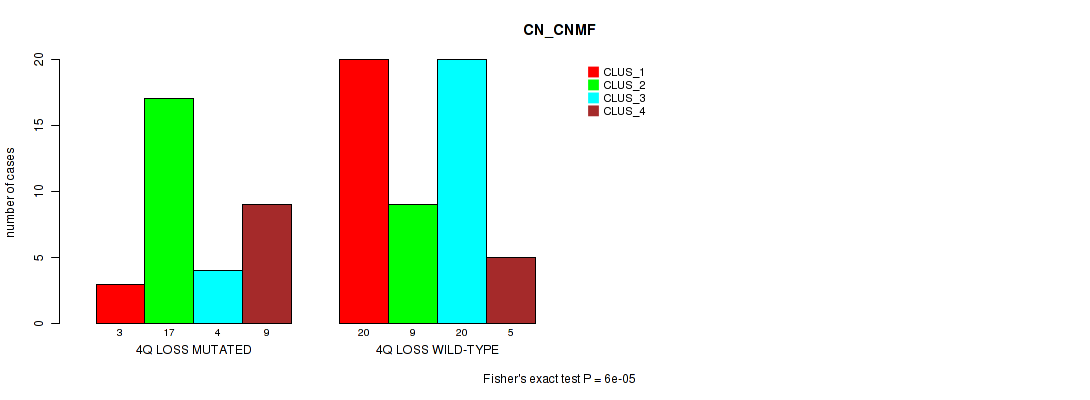
4q loss cnv correlated to 'CN_CNMF'.
-
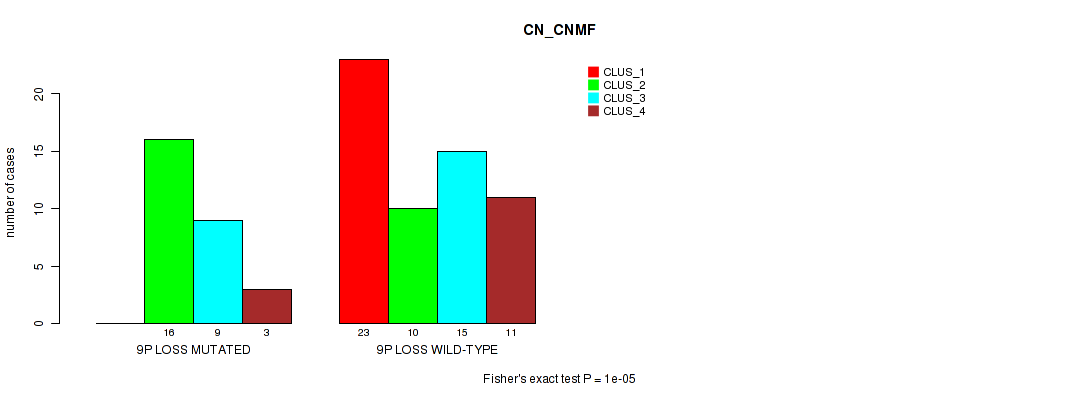
9p loss cnv correlated to 'CN_CNMF'.
-
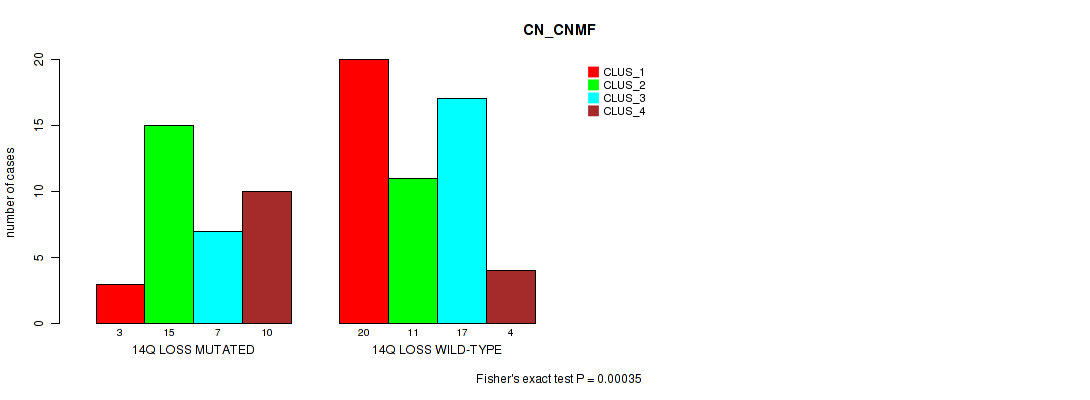
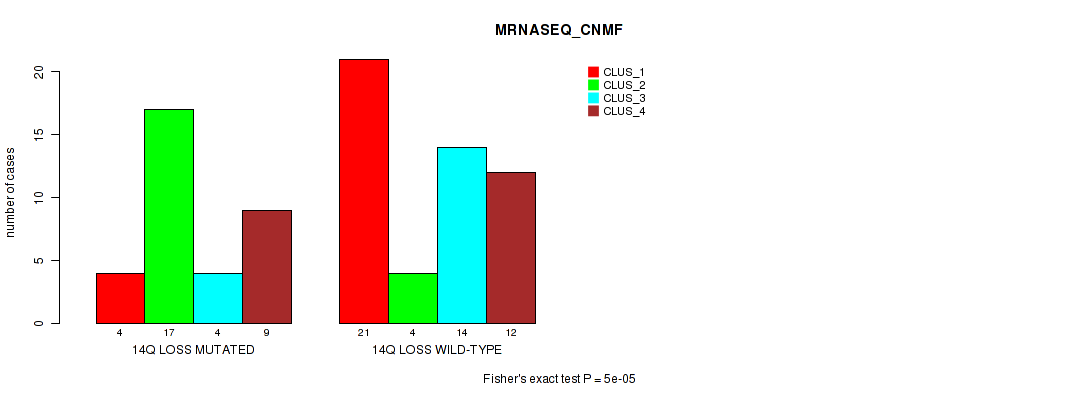
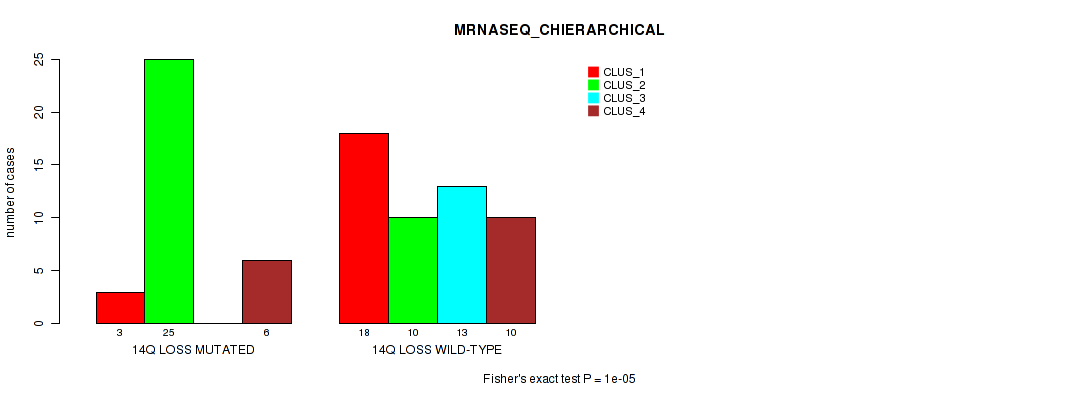
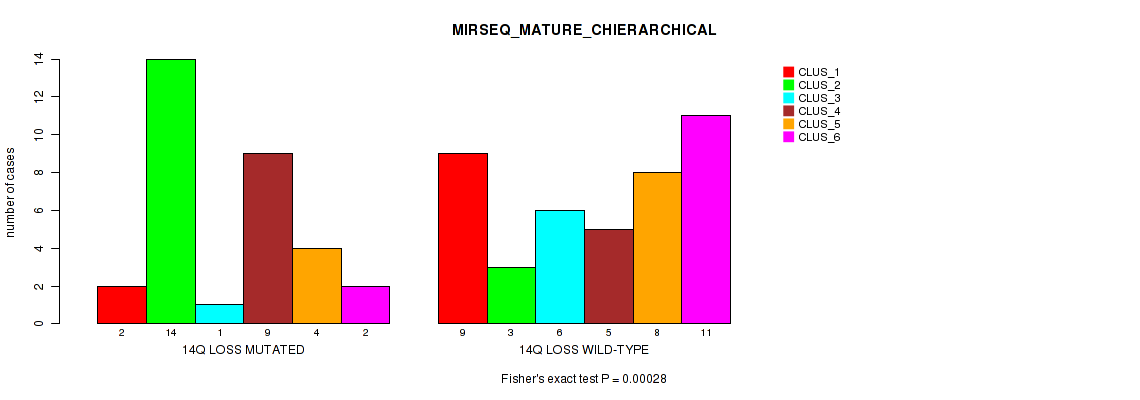
14q loss cnv correlated to 'CN_CNMF', 'MRNASEQ_CNMF', 'MRNASEQ_CHIERARCHICAL', and 'MIRSEQ_MATURE_CHIERARCHICAL'.
-
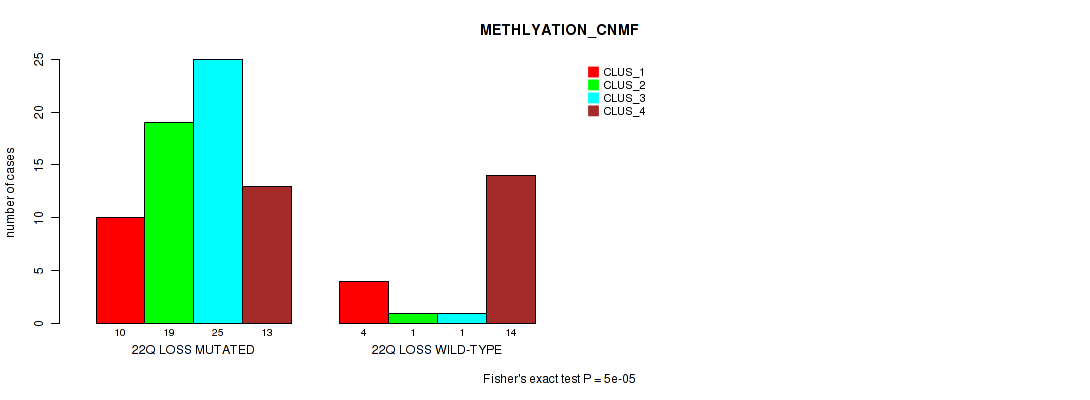
22q loss cnv correlated to 'METHLYATION_CNMF'.
-
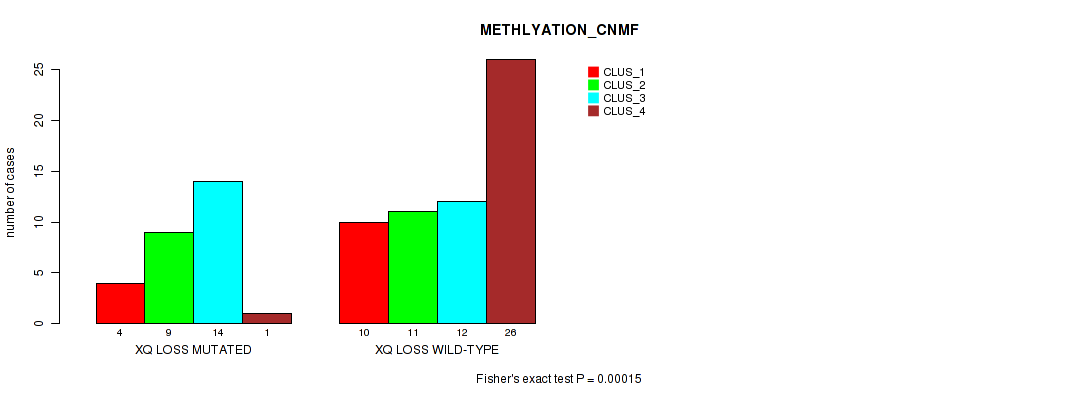
xq loss cnv correlated to 'METHLYATION_CNMF'.
Table 1. Get Full Table Overview of the association between significant copy number variation of 72 arm-level events and 8 molecular subtypes. Shown in the table are P values (Q values). Thresholded by P value < 0.05 and Q value < 0.25, 12 significant findings detected.
|
Clinical Features |
CN CNMF |
METHLYATION CNMF |
MRNASEQ CNMF |
MRNASEQ CHIERARCHICAL |
MIRSEQ CNMF |
MIRSEQ CHIERARCHICAL |
MIRSEQ MATURE CNMF |
MIRSEQ MATURE CHIERARCHICAL |
||
| nCNV (%) | nWild-Type | Fisher's exact test | Fisher's exact test | Fisher's exact test | Fisher's exact test | Fisher's exact test | Fisher's exact test | Fisher's exact test | Fisher's exact test | |
| 14q loss | 35 (40%) | 52 |
0.00035 (0.192) |
0.36 (1.00) |
5e-05 (0.0278) |
1e-05 (0.0056) |
0.00348 (1.00) |
0.0005 (0.273) |
0.00255 (1.00) |
0.00028 (0.155) |
| 3q gain | 19 (22%) | 68 |
0.00019 (0.105) |
0.767 (1.00) |
0.746 (1.00) |
0.528 (1.00) |
0.651 (1.00) |
0.936 (1.00) |
0.519 (1.00) |
0.762 (1.00) |
| 12p gain | 18 (21%) | 69 |
0.00038 (0.209) |
0.814 (1.00) |
0.835 (1.00) |
0.946 (1.00) |
0.479 (1.00) |
0.927 (1.00) |
0.935 (1.00) |
0.86 (1.00) |
| 12q gain | 18 (21%) | 69 |
0.00028 (0.155) |
0.813 (1.00) |
0.832 (1.00) |
0.946 (1.00) |
0.48 (1.00) |
0.926 (1.00) |
0.936 (1.00) |
0.858 (1.00) |
| 4p loss | 32 (37%) | 55 |
3e-05 (0.0167) |
0.325 (1.00) |
0.22 (1.00) |
0.00456 (1.00) |
0.175 (1.00) |
0.716 (1.00) |
0.207 (1.00) |
0.664 (1.00) |
| 4q loss | 33 (38%) | 54 |
6e-05 (0.0333) |
0.1 (1.00) |
0.00388 (1.00) |
0.0005 (0.273) |
0.118 (1.00) |
0.124 (1.00) |
0.656 (1.00) |
0.227 (1.00) |
| 9p loss | 28 (32%) | 59 |
1e-05 (0.0056) |
0.0141 (1.00) |
0.0557 (1.00) |
0.00687 (1.00) |
0.822 (1.00) |
0.322 (1.00) |
0.629 (1.00) |
0.359 (1.00) |
| 22q loss | 67 (77%) | 20 |
0.00511 (1.00) |
5e-05 (0.0278) |
0.0301 (1.00) |
0.00368 (1.00) |
1 (1.00) |
0.801 (1.00) |
0.0692 (1.00) |
0.0968 (1.00) |
| xq loss | 28 (32%) | 59 |
0.00195 (1.00) |
0.00015 (0.0831) |
0.0151 (1.00) |
0.00304 (1.00) |
0.335 (1.00) |
0.576 (1.00) |
0.0147 (1.00) |
0.0575 (1.00) |
| 1p gain | 10 (11%) | 77 |
0.0148 (1.00) |
0.783 (1.00) |
0.961 (1.00) |
0.61 (1.00) |
0.74 (1.00) |
0.398 (1.00) |
0.355 (1.00) |
0.755 (1.00) |
| 1q gain | 21 (24%) | 66 |
0.00898 (1.00) |
0.03 (1.00) |
0.0513 (1.00) |
0.225 (1.00) |
0.711 (1.00) |
0.412 (1.00) |
0.695 (1.00) |
0.248 (1.00) |
| 2p gain | 4 (5%) | 83 |
0.103 (1.00) |
0.376 (1.00) |
0.618 (1.00) |
0.902 (1.00) |
0.053 (1.00) |
0.614 (1.00) |
0.256 (1.00) |
0.481 (1.00) |
| 2q gain | 7 (8%) | 80 |
0.516 (1.00) |
0.461 (1.00) |
0.317 (1.00) |
0.537 (1.00) |
0.269 (1.00) |
0.806 (1.00) |
0.0129 (1.00) |
0.168 (1.00) |
| 3p gain | 17 (20%) | 70 |
0.00049 (0.269) |
0.931 (1.00) |
0.703 (1.00) |
0.727 (1.00) |
1 (1.00) |
1 (1.00) |
0.566 (1.00) |
0.819 (1.00) |
| 5p gain | 24 (28%) | 63 |
0.195 (1.00) |
0.329 (1.00) |
0.659 (1.00) |
0.583 (1.00) |
0.0221 (1.00) |
0.0937 (1.00) |
0.0449 (1.00) |
0.386 (1.00) |
| 5q gain | 15 (17%) | 72 |
0.0612 (1.00) |
0.354 (1.00) |
0.528 (1.00) |
0.955 (1.00) |
0.12 (1.00) |
0.124 (1.00) |
0.0477 (1.00) |
0.637 (1.00) |
| 6p gain | 7 (8%) | 80 |
0.0762 (1.00) |
0.0958 (1.00) |
0.316 (1.00) |
0.333 (1.00) |
0.0836 (1.00) |
0.357 (1.00) |
0.88 (1.00) |
0.935 (1.00) |
| 6q gain | 4 (5%) | 83 |
0.102 (1.00) |
0.636 (1.00) |
0.837 (1.00) |
0.745 (1.00) |
0.56 (1.00) |
0.45 (1.00) |
0.569 (1.00) |
0.912 (1.00) |
| 7p gain | 25 (29%) | 62 |
0.0146 (1.00) |
0.392 (1.00) |
0.241 (1.00) |
0.0399 (1.00) |
0.0324 (1.00) |
0.0354 (1.00) |
0.186 (1.00) |
0.135 (1.00) |
| 7q gain | 22 (25%) | 65 |
0.0242 (1.00) |
0.447 (1.00) |
0.444 (1.00) |
0.0203 (1.00) |
0.0668 (1.00) |
0.17 (1.00) |
0.404 (1.00) |
0.38 (1.00) |
| 8p gain | 12 (14%) | 75 |
0.0455 (1.00) |
0.522 (1.00) |
0.755 (1.00) |
0.488 (1.00) |
0.176 (1.00) |
0.254 (1.00) |
0.216 (1.00) |
0.368 (1.00) |
| 8q gain | 14 (16%) | 73 |
0.0493 (1.00) |
0.933 (1.00) |
0.737 (1.00) |
0.532 (1.00) |
0.296 (1.00) |
0.663 (1.00) |
0.399 (1.00) |
0.485 (1.00) |
| 9p gain | 3 (3%) | 84 |
0.703 (1.00) |
0.534 (1.00) |
0.329 (1.00) |
0.872 (1.00) |
0.183 (1.00) |
0.774 (1.00) |
0.336 (1.00) |
0.373 (1.00) |
| 9q gain | 4 (5%) | 83 |
0.502 (1.00) |
0.0709 (1.00) |
0.441 (1.00) |
0.615 (1.00) |
0.0607 (1.00) |
0.854 (1.00) |
1 (1.00) |
0.716 (1.00) |
| 10p gain | 3 (3%) | 84 |
0.08 (1.00) |
0.776 (1.00) |
0.239 (1.00) |
0.754 (1.00) |
||||
| 10q gain | 3 (3%) | 84 |
0.0795 (1.00) |
0.775 (1.00) |
0.237 (1.00) |
0.755 (1.00) |
||||
| 11p gain | 11 (13%) | 76 |
0.00814 (1.00) |
0.662 (1.00) |
0.517 (1.00) |
0.0621 (1.00) |
0.123 (1.00) |
0.827 (1.00) |
0.599 (1.00) |
0.618 (1.00) |
| 11q gain | 12 (14%) | 75 |
0.0098 (1.00) |
0.38 (1.00) |
0.199 (1.00) |
0.034 (1.00) |
0.114 (1.00) |
0.44 (1.00) |
0.315 (1.00) |
0.304 (1.00) |
| 13q gain | 5 (6%) | 82 |
0.423 (1.00) |
0.0964 (1.00) |
0.0239 (1.00) |
0.0961 (1.00) |
0.115 (1.00) |
0.893 (1.00) |
0.259 (1.00) |
0.716 (1.00) |
| 15q gain | 11 (13%) | 76 |
0.0253 (1.00) |
0.00406 (1.00) |
0.0141 (1.00) |
0.126 (1.00) |
0.0111 (1.00) |
0.18 (1.00) |
0.753 (1.00) |
0.671 (1.00) |
| 16p gain | 17 (20%) | 70 |
0.00696 (1.00) |
0.568 (1.00) |
0.0383 (1.00) |
0.148 (1.00) |
0.0323 (1.00) |
0.172 (1.00) |
0.578 (1.00) |
0.113 (1.00) |
| 16q gain | 16 (18%) | 71 |
0.00228 (1.00) |
0.803 (1.00) |
0.048 (1.00) |
0.116 (1.00) |
0.169 (1.00) |
0.513 (1.00) |
0.747 (1.00) |
0.51 (1.00) |
| 17p gain | 7 (8%) | 80 |
0.219 (1.00) |
1 (1.00) |
0.482 (1.00) |
0.779 (1.00) |
0.434 (1.00) |
0.0421 (1.00) |
0.85 (1.00) |
0.0691 (1.00) |
| 17q gain | 17 (20%) | 70 |
0.0951 (1.00) |
0.318 (1.00) |
0.00991 (1.00) |
0.0494 (1.00) |
0.0887 (1.00) |
0.375 (1.00) |
0.747 (1.00) |
0.705 (1.00) |
| 18p gain | 8 (9%) | 79 |
0.0676 (1.00) |
0.317 (1.00) |
0.113 (1.00) |
0.184 (1.00) |
0.05 (1.00) |
0.542 (1.00) |
0.137 (1.00) |
0.255 (1.00) |
| 18q gain | 4 (5%) | 83 |
0.0887 (1.00) |
1 (1.00) |
0.366 (1.00) |
0.619 (1.00) |
0.181 (1.00) |
0.845 (1.00) |
||
| 19p gain | 14 (16%) | 73 |
0.273 (1.00) |
0.0332 (1.00) |
0.153 (1.00) |
0.282 (1.00) |
0.397 (1.00) |
0.922 (1.00) |
0.789 (1.00) |
0.252 (1.00) |
| 19q gain | 10 (11%) | 77 |
0.805 (1.00) |
0.119 (1.00) |
0.449 (1.00) |
0.608 (1.00) |
0.55 (1.00) |
1 (1.00) |
0.717 (1.00) |
0.402 (1.00) |
| 20p gain | 8 (9%) | 79 |
0.69 (1.00) |
0.727 (1.00) |
0.244 (1.00) |
0.77 (1.00) |
0.609 (1.00) |
0.876 (1.00) |
0.881 (1.00) |
0.332 (1.00) |
| 20q gain | 10 (11%) | 77 |
0.204 (1.00) |
0.908 (1.00) |
0.464 (1.00) |
0.87 (1.00) |
0.356 (1.00) |
0.795 (1.00) |
0.624 (1.00) |
0.113 (1.00) |
| 21q gain | 6 (7%) | 81 |
0.252 (1.00) |
0.611 (1.00) |
0.231 (1.00) |
0.233 (1.00) |
0.114 (1.00) |
0.804 (1.00) |
0.0402 (1.00) |
0.0866 (1.00) |
| xq gain | 6 (7%) | 81 |
0.232 (1.00) |
0.496 (1.00) |
0.648 (1.00) |
0.875 (1.00) |
0.564 (1.00) |
0.913 (1.00) |
1 (1.00) |
0.847 (1.00) |
| 1p loss | 8 (9%) | 79 |
0.0248 (1.00) |
0.225 (1.00) |
0.41 (1.00) |
0.871 (1.00) |
0.119 (1.00) |
0.163 (1.00) |
0.136 (1.00) |
0.706 (1.00) |
| 2p loss | 6 (7%) | 81 |
0.685 (1.00) |
0.386 (1.00) |
0.104 (1.00) |
0.285 (1.00) |
0.114 (1.00) |
0.735 (1.00) |
0.258 (1.00) |
0.496 (1.00) |
| 2q loss | 4 (5%) | 83 |
0.637 (1.00) |
0.343 (1.00) |
0.697 (1.00) |
0.658 (1.00) |
0.671 (1.00) |
0.899 (1.00) |
0.783 (1.00) |
0.952 (1.00) |
| 3p loss | 8 (9%) | 79 |
0.369 (1.00) |
0.09 (1.00) |
0.151 (1.00) |
0.296 (1.00) |
0.722 (1.00) |
0.131 (1.00) |
0.194 (1.00) |
0.206 (1.00) |
| 3q loss | 6 (7%) | 81 |
0.719 (1.00) |
0.0923 (1.00) |
0.234 (1.00) |
0.555 (1.00) |
0.878 (1.00) |
0.217 (1.00) |
0.314 (1.00) |
0.846 (1.00) |
| 5p loss | 4 (5%) | 83 |
0.5 (1.00) |
0.691 (1.00) |
0.0313 (1.00) |
0.616 (1.00) |
0.479 (1.00) |
0.312 (1.00) |
||
| 5q loss | 9 (10%) | 78 |
0.025 (1.00) |
0.838 (1.00) |
0.28 (1.00) |
0.228 (1.00) |
0.723 (1.00) |
0.273 (1.00) |
0.351 (1.00) |
0.541 (1.00) |
| 6p loss | 9 (10%) | 78 |
0.834 (1.00) |
0.323 (1.00) |
0.275 (1.00) |
0.4 (1.00) |
0.887 (1.00) |
0.502 (1.00) |
0.61 (1.00) |
0.0365 (1.00) |
| 6q loss | 29 (33%) | 58 |
0.00327 (1.00) |
0.214 (1.00) |
0.332 (1.00) |
0.518 (1.00) |
1 (1.00) |
0.835 (1.00) |
0.103 (1.00) |
0.363 (1.00) |
| 8p loss | 13 (15%) | 74 |
0.87 (1.00) |
0.69 (1.00) |
0.975 (1.00) |
0.9 (1.00) |
0.402 (1.00) |
0.355 (1.00) |
0.399 (1.00) |
0.86 (1.00) |
| 8q loss | 4 (5%) | 83 |
0.104 (1.00) |
0.374 (1.00) |
0.442 (1.00) |
0.617 (1.00) |
0.357 (1.00) |
0.844 (1.00) |
0.61 (1.00) |
0.635 (1.00) |
| 9q loss | 21 (24%) | 66 |
0.00194 (1.00) |
0.207 (1.00) |
0.173 (1.00) |
0.152 (1.00) |
1 (1.00) |
0.282 (1.00) |
0.302 (1.00) |
0.138 (1.00) |
| 10p loss | 24 (28%) | 63 |
0.00428 (1.00) |
0.00063 (0.343) |
0.122 (1.00) |
0.141 (1.00) |
0.819 (1.00) |
0.658 (1.00) |
0.653 (1.00) |
0.89 (1.00) |
| 10q loss | 19 (22%) | 68 |
0.0237 (1.00) |
0.0163 (1.00) |
0.513 (1.00) |
0.378 (1.00) |
0.195 (1.00) |
0.866 (1.00) |
0.644 (1.00) |
0.805 (1.00) |
| 11p loss | 4 (5%) | 83 |
0.683 (1.00) |
0.831 (1.00) |
0.364 (1.00) |
0.151 (1.00) |
0.618 (1.00) |
0.565 (1.00) |
1 (1.00) |
0.953 (1.00) |
| 11q loss | 5 (6%) | 82 |
0.579 (1.00) |
0.615 (1.00) |
0.00722 (1.00) |
0.00304 (1.00) |
0.447 (1.00) |
0.183 (1.00) |
1 (1.00) |
0.339 (1.00) |
| 12p loss | 4 (5%) | 83 |
0.261 (1.00) |
0.0706 (1.00) |
0.442 (1.00) |
0.248 (1.00) |
0.36 (1.00) |
0.245 (1.00) |
0.464 (1.00) |
0.908 (1.00) |
| 13q loss | 33 (38%) | 54 |
0.103 (1.00) |
0.736 (1.00) |
0.246 (1.00) |
0.445 (1.00) |
0.83 (1.00) |
1 (1.00) |
0.00646 (1.00) |
0.309 (1.00) |
| 15q loss | 11 (13%) | 76 |
0.114 (1.00) |
0.759 (1.00) |
0.322 (1.00) |
0.198 (1.00) |
0.256 (1.00) |
0.0775 (1.00) |
0.786 (1.00) |
0.876 (1.00) |
| 16p loss | 7 (8%) | 80 |
0.00972 (1.00) |
0.195 (1.00) |
0.598 (1.00) |
0.123 (1.00) |
0.651 (1.00) |
0.595 (1.00) |
1 (1.00) |
0.939 (1.00) |
| 16q loss | 10 (11%) | 77 |
0.0498 (1.00) |
0.905 (1.00) |
0.255 (1.00) |
0.249 (1.00) |
0.67 (1.00) |
0.966 (1.00) |
0.599 (1.00) |
0.768 (1.00) |
| 17p loss | 23 (26%) | 64 |
0.348 (1.00) |
0.383 (1.00) |
0.764 (1.00) |
0.759 (1.00) |
0.0479 (1.00) |
0.171 (1.00) |
0.237 (1.00) |
0.0296 (1.00) |
| 17q loss | 7 (8%) | 80 |
0.557 (1.00) |
0.155 (1.00) |
0.67 (1.00) |
0.896 (1.00) |
0.317 (1.00) |
0.688 (1.00) |
0.361 (1.00) |
0.706 (1.00) |
| 18p loss | 9 (10%) | 78 |
0.14 (1.00) |
0.782 (1.00) |
0.92 (1.00) |
0.546 (1.00) |
0.361 (1.00) |
0.387 (1.00) |
0.435 (1.00) |
0.155 (1.00) |
| 18q loss | 14 (16%) | 73 |
0.403 (1.00) |
0.686 (1.00) |
0.764 (1.00) |
0.928 (1.00) |
0.0514 (1.00) |
0.111 (1.00) |
0.475 (1.00) |
0.222 (1.00) |
| 19p loss | 4 (5%) | 83 |
0.685 (1.00) |
0.202 (1.00) |
0.615 (1.00) |
0.107 (1.00) |
1 (1.00) |
0.474 (1.00) |
0.204 (1.00) |
0.28 (1.00) |
| 19q loss | 7 (8%) | 80 |
0.559 (1.00) |
0.0497 (1.00) |
1 (1.00) |
0.853 (1.00) |
1 (1.00) |
0.597 (1.00) |
0.315 (1.00) |
0.939 (1.00) |
| 20p loss | 14 (16%) | 73 |
0.0259 (1.00) |
0.11 (1.00) |
0.108 (1.00) |
0.645 (1.00) |
0.251 (1.00) |
0.086 (1.00) |
0.563 (1.00) |
0.0622 (1.00) |
| 20q loss | 3 (3%) | 84 |
0.239 (1.00) |
0.337 (1.00) |
0.89 (1.00) |
0.411 (1.00) |
||||
| 21q loss | 11 (13%) | 76 |
0.11 (1.00) |
0.0131 (1.00) |
0.239 (1.00) |
0.0754 (1.00) |
0.76 (1.00) |
0.929 (1.00) |
0.0996 (1.00) |
0.949 (1.00) |
P value = 0.00019 (Fisher's exact test), Q value = 0.11
Table S1. Gene #6: '3q gain' versus Molecular Subtype #1: 'CN_CNMF'
| nPatients | CLUS_1 | CLUS_2 | CLUS_3 | CLUS_4 |
|---|---|---|---|---|
| ALL | 23 | 26 | 24 | 14 |
| 3Q GAIN MUTATED | 1 | 12 | 1 | 5 |
| 3Q GAIN WILD-TYPE | 22 | 14 | 23 | 9 |
Figure S1. Get High-res Image Gene #6: '3q gain' versus Molecular Subtype #1: 'CN_CNMF'
P value = 0.00038 (Fisher's exact test), Q value = 0.21
Table S2. Gene #21: '12p gain' versus Molecular Subtype #1: 'CN_CNMF'
| nPatients | CLUS_1 | CLUS_2 | CLUS_3 | CLUS_4 |
|---|---|---|---|---|
| ALL | 23 | 26 | 24 | 14 |
| 12P GAIN MUTATED | 1 | 13 | 3 | 1 |
| 12P GAIN WILD-TYPE | 22 | 13 | 21 | 13 |
Figure S2. Get High-res Image Gene #21: '12p gain' versus Molecular Subtype #1: 'CN_CNMF'

P value = 0.00028 (Fisher's exact test), Q value = 0.15
Table S3. Gene #22: '12q gain' versus Molecular Subtype #1: 'CN_CNMF'
| nPatients | CLUS_1 | CLUS_2 | CLUS_3 | CLUS_4 |
|---|---|---|---|---|
| ALL | 23 | 26 | 24 | 14 |
| 12Q GAIN MUTATED | 1 | 13 | 3 | 1 |
| 12Q GAIN WILD-TYPE | 22 | 13 | 21 | 13 |
Figure S3. Get High-res Image Gene #22: '12q gain' versus Molecular Subtype #1: 'CN_CNMF'
P value = 3e-05 (Fisher's exact test), Q value = 0.017
Table S4. Gene #42: '4p loss' versus Molecular Subtype #1: 'CN_CNMF'
| nPatients | CLUS_1 | CLUS_2 | CLUS_3 | CLUS_4 |
|---|---|---|---|---|
| ALL | 23 | 26 | 24 | 14 |
| 4P LOSS MUTATED | 3 | 18 | 4 | 7 |
| 4P LOSS WILD-TYPE | 20 | 8 | 20 | 7 |
Figure S4. Get High-res Image Gene #42: '4p loss' versus Molecular Subtype #1: 'CN_CNMF'
P value = 6e-05 (Fisher's exact test), Q value = 0.033
Table S5. Gene #43: '4q loss' versus Molecular Subtype #1: 'CN_CNMF'
| nPatients | CLUS_1 | CLUS_2 | CLUS_3 | CLUS_4 |
|---|---|---|---|---|
| ALL | 23 | 26 | 24 | 14 |
| 4Q LOSS MUTATED | 3 | 17 | 4 | 9 |
| 4Q LOSS WILD-TYPE | 20 | 9 | 20 | 5 |
Figure S5. Get High-res Image Gene #43: '4q loss' versus Molecular Subtype #1: 'CN_CNMF'
P value = 1e-05 (Fisher's exact test), Q value = 0.0056
Table S6. Gene #50: '9p loss' versus Molecular Subtype #1: 'CN_CNMF'
| nPatients | CLUS_1 | CLUS_2 | CLUS_3 | CLUS_4 |
|---|---|---|---|---|
| ALL | 23 | 26 | 24 | 14 |
| 9P LOSS MUTATED | 0 | 16 | 9 | 3 |
| 9P LOSS WILD-TYPE | 23 | 10 | 15 | 11 |
Figure S6. Get High-res Image Gene #50: '9p loss' versus Molecular Subtype #1: 'CN_CNMF'
P value = 0.00035 (Fisher's exact test), Q value = 0.19
Table S7. Gene #58: '14q loss' versus Molecular Subtype #1: 'CN_CNMF'
| nPatients | CLUS_1 | CLUS_2 | CLUS_3 | CLUS_4 |
|---|---|---|---|---|
| ALL | 23 | 26 | 24 | 14 |
| 14Q LOSS MUTATED | 3 | 15 | 7 | 10 |
| 14Q LOSS WILD-TYPE | 20 | 11 | 17 | 4 |
Figure S7. Get High-res Image Gene #58: '14q loss' versus Molecular Subtype #1: 'CN_CNMF'
P value = 5e-05 (Fisher's exact test), Q value = 0.028
Table S8. Gene #58: '14q loss' versus Molecular Subtype #3: 'MRNASEQ_CNMF'
| nPatients | CLUS_1 | CLUS_2 | CLUS_3 | CLUS_4 |
|---|---|---|---|---|
| ALL | 25 | 21 | 18 | 21 |
| 14Q LOSS MUTATED | 4 | 17 | 4 | 9 |
| 14Q LOSS WILD-TYPE | 21 | 4 | 14 | 12 |
Figure S8. Get High-res Image Gene #58: '14q loss' versus Molecular Subtype #3: 'MRNASEQ_CNMF'
P value = 1e-05 (Fisher's exact test), Q value = 0.0056
Table S9. Gene #58: '14q loss' versus Molecular Subtype #4: 'MRNASEQ_CHIERARCHICAL'
| nPatients | CLUS_1 | CLUS_2 | CLUS_3 | CLUS_4 |
|---|---|---|---|---|
| ALL | 21 | 35 | 13 | 16 |
| 14Q LOSS MUTATED | 3 | 25 | 0 | 6 |
| 14Q LOSS WILD-TYPE | 18 | 10 | 13 | 10 |
Figure S9. Get High-res Image Gene #58: '14q loss' versus Molecular Subtype #4: 'MRNASEQ_CHIERARCHICAL'
P value = 0.00028 (Fisher's exact test), Q value = 0.15
Table S10. Gene #58: '14q loss' versus Molecular Subtype #8: 'MIRSEQ_MATURE_CHIERARCHICAL'
| nPatients | CLUS_1 | CLUS_2 | CLUS_3 | CLUS_4 | CLUS_5 | CLUS_6 |
|---|---|---|---|---|---|---|
| ALL | 11 | 17 | 7 | 14 | 12 | 13 |
| 14Q LOSS MUTATED | 2 | 14 | 1 | 9 | 4 | 2 |
| 14Q LOSS WILD-TYPE | 9 | 3 | 6 | 5 | 8 | 11 |
Figure S10. Get High-res Image Gene #58: '14q loss' versus Molecular Subtype #8: 'MIRSEQ_MATURE_CHIERARCHICAL'
P value = 5e-05 (Fisher's exact test), Q value = 0.028
Table S11. Gene #71: '22q loss' versus Molecular Subtype #2: 'METHLYATION_CNMF'
| nPatients | CLUS_1 | CLUS_2 | CLUS_3 | CLUS_4 |
|---|---|---|---|---|
| ALL | 14 | 20 | 26 | 27 |
| 22Q LOSS MUTATED | 10 | 19 | 25 | 13 |
| 22Q LOSS WILD-TYPE | 4 | 1 | 1 | 14 |
Figure S11. Get High-res Image Gene #71: '22q loss' versus Molecular Subtype #2: 'METHLYATION_CNMF'
P value = 0.00015 (Fisher's exact test), Q value = 0.083
Table S12. Gene #72: 'xq loss' versus Molecular Subtype #2: 'METHLYATION_CNMF'
| nPatients | CLUS_1 | CLUS_2 | CLUS_3 | CLUS_4 |
|---|---|---|---|---|
| ALL | 14 | 20 | 26 | 27 |
| XQ LOSS MUTATED | 4 | 9 | 14 | 1 |
| XQ LOSS WILD-TYPE | 10 | 11 | 12 | 26 |
Figure S12. Get High-res Image Gene #72: 'xq loss' versus Molecular Subtype #2: 'METHLYATION_CNMF'
-
Copy number data file = transformed.cor.cli.txt
-
Molecular subtypes file = MESO-TP.transferedmergedcluster.txt
-
Number of patients = 87
-
Number of significantly arm-level cnvs = 72
-
Number of molecular subtypes = 8
-
Exclude genes that fewer than K tumors have mutations, K = 3
For binary or multi-class clinical features (nominal or ordinal), two-tailed Fisher's exact tests (Fisher 1922) were used to estimate the P values using the 'fisher.test' function in R
For multiple hypothesis correction, Q value is the False Discovery Rate (FDR) analogue of the P value (Benjamini and Hochberg 1995), defined as the minimum FDR at which the test may be called significant. We used the 'Benjamini and Hochberg' method of 'p.adjust' function in R to convert P values into Q values.
In addition to the links below, the full results of the analysis summarized in this report can also be downloaded programmatically using firehose_get, or interactively from either the Broad GDAC website or TCGA Data Coordination Center Portal.