This pipeline computes the correlation between significant copy number variation (cnv focal) genes and selected clinical features.
Testing the association between copy number variation 71 focal events and 8 clinical features across 571 patients, 11 significant findings detected with Q value < 0.25.
-
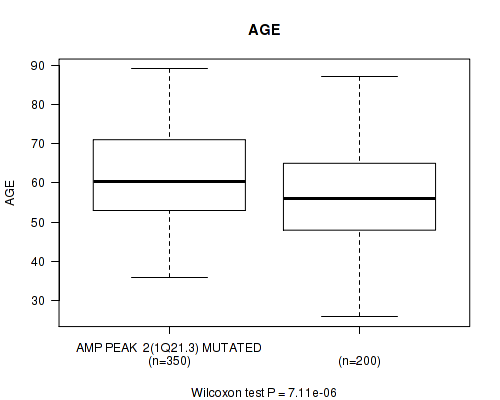
amp_1q21.3 cnv correlated to 'AGE'.
-
amp_10p15.3 cnv correlated to 'AGE'.
-
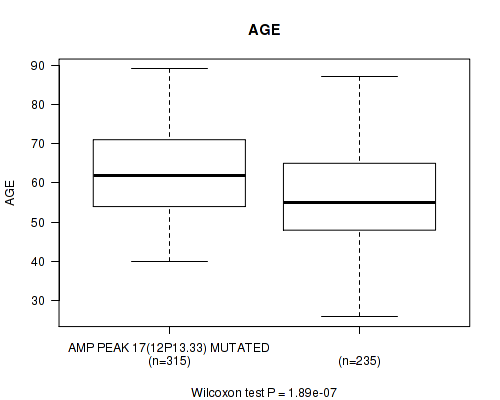
amp_12p13.33 cnv correlated to 'AGE'.
-
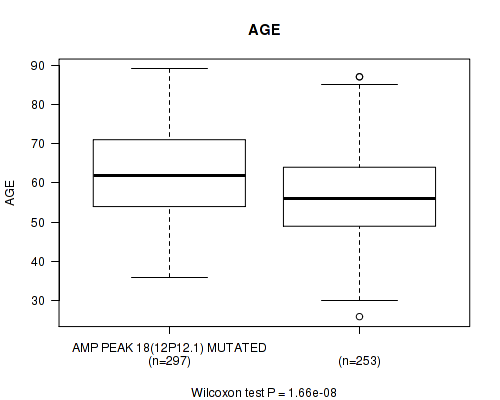
amp_12p12.1 cnv correlated to 'AGE'.
-
amp_12q15 cnv correlated to 'AGE'.
-
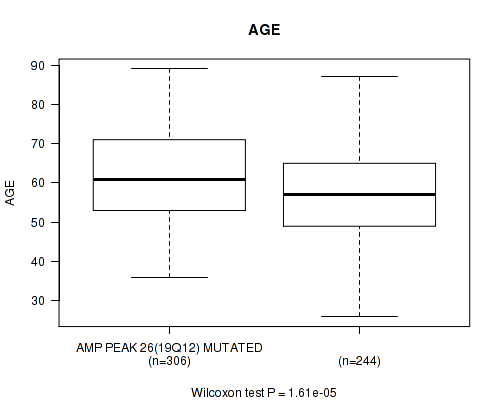
amp_19q12 cnv correlated to 'AGE'.
-
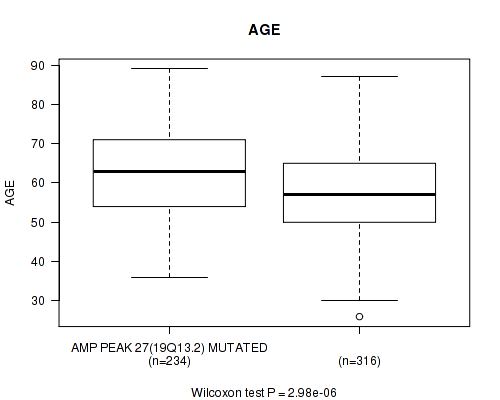
amp_19q13.2 cnv correlated to 'AGE'.
-
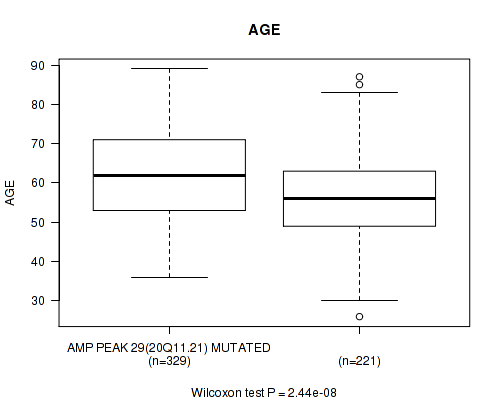
amp_20q11.21 cnv correlated to 'AGE'.
-
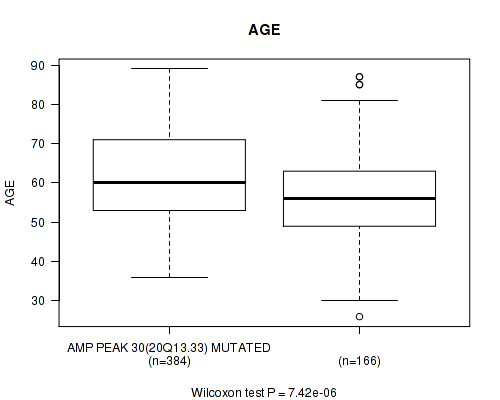
amp_20q13.33 cnv correlated to 'AGE'.
-
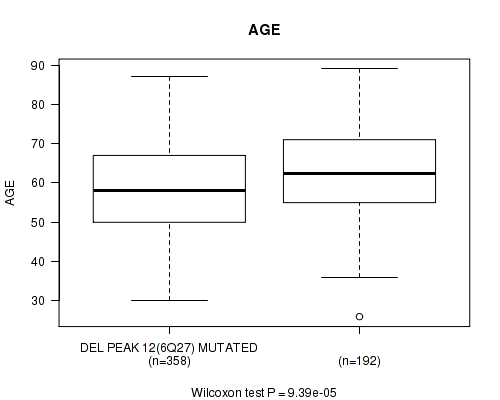
del_6q27 cnv correlated to 'AGE'.
-
del_16q23.1 cnv correlated to 'AGE'.
Table 1. Get Full Table Overview of the association between significant copy number variation of 71 focal events and 8 clinical features. Shown in the table are P values (Q values). Thresholded by Q value < 0.25, 11 significant findings detected.
|
Clinical Features |
Time to Death |
AGE |
PRIMARY SITE OF DISEASE |
KARNOFSKY PERFORMANCE SCORE |
RADIATIONS RADIATION REGIMENINDICATION |
COMPLETENESS OF RESECTION |
RACE | ETHNICITY | ||
| nCNV (%) | nWild-Type | logrank test | Wilcoxon-test | Fisher's exact test | Wilcoxon-test | Fisher's exact test | Fisher's exact test | Fisher's exact test | Fisher's exact test | |
| amp 1q21 3 | 363 (64%) | 208 |
0.227 (1.00) |
7.11e-06 (0.004) |
0.126 (1.00) |
0.437 (1.00) |
1 (1.00) |
0.106 (1.00) |
0.975 (1.00) |
1 (1.00) |
| amp 10p15 3 | 250 (44%) | 321 |
0.155 (1.00) |
0.000424 (0.236) |
0.159 (1.00) |
0.886 (1.00) |
0.584 (1.00) |
0.682 (1.00) |
0.21 (1.00) |
0.198 (1.00) |
| amp 12p13 33 | 327 (57%) | 244 |
0.77 (1.00) |
1.89e-07 (0.000107) |
0.76 (1.00) |
0.635 (1.00) |
1 (1.00) |
0.243 (1.00) |
1 (1.00) |
1 (1.00) |
| amp 12p12 1 | 311 (54%) | 260 |
0.0751 (1.00) |
1.66e-08 (9.44e-06) |
0.254 (1.00) |
0.609 (1.00) |
0.594 (1.00) |
1 (1.00) |
0.522 (1.00) |
1 (1.00) |
| amp 12q15 | 220 (39%) | 351 |
0.201 (1.00) |
4.47e-07 (0.000252) |
0.0202 (1.00) |
0.484 (1.00) |
1 (1.00) |
0.349 (1.00) |
0.926 (1.00) |
0.738 (1.00) |
| amp 19q12 | 317 (56%) | 254 |
0.442 (1.00) |
1.61e-05 (0.00905) |
0.162 (1.00) |
0.868 (1.00) |
1 (1.00) |
0.253 (1.00) |
0.499 (1.00) |
1 (1.00) |
| amp 19q13 2 | 241 (42%) | 330 |
0.0202 (1.00) |
2.98e-06 (0.00168) |
0.152 (1.00) |
0.96 (1.00) |
0.576 (1.00) |
0.667 (1.00) |
0.00936 (1.00) |
0.748 (1.00) |
| amp 20q11 21 | 342 (60%) | 229 |
0.1 (1.00) |
2.44e-08 (1.38e-05) |
1 (1.00) |
0.452 (1.00) |
1 (1.00) |
0.651 (1.00) |
0.34 (1.00) |
0.748 (1.00) |
| amp 20q13 33 | 397 (70%) | 174 |
0.455 (1.00) |
7.42e-06 (0.00417) |
1 (1.00) |
0.549 (1.00) |
1 (1.00) |
0.0788 (1.00) |
0.0786 (1.00) |
0.731 (1.00) |
| del 6q27 | 373 (65%) | 198 |
0.14 (1.00) |
9.39e-05 (0.0526) |
1 (1.00) |
0.949 (1.00) |
1 (1.00) |
0.808 (1.00) |
0.907 (1.00) |
1 (1.00) |
| del 16q23 1 | 446 (78%) | 125 |
0.219 (1.00) |
0.000392 (0.219) |
0.633 (1.00) |
0.0493 (1.00) |
1 (1.00) |
0.0385 (1.00) |
1 (1.00) |
0.247 (1.00) |
| amp 1p34 3 | 289 (51%) | 282 |
0.0156 (1.00) |
0.0176 (1.00) |
1 (1.00) |
0.516 (1.00) |
0.249 (1.00) |
0.532 (1.00) |
0.059 (1.00) |
1 (1.00) |
| amp 1q42 2 | 315 (55%) | 256 |
0.177 (1.00) |
0.000866 (0.482) |
0.255 (1.00) |
0.885 (1.00) |
0.59 (1.00) |
0.885 (1.00) |
0.856 (1.00) |
0.531 (1.00) |
| amp 2p23 2 | 246 (43%) | 325 |
0.706 (1.00) |
0.091 (1.00) |
0.76 (1.00) |
0.969 (1.00) |
1 (1.00) |
0.662 (1.00) |
0.871 (1.00) |
1 (1.00) |
| amp 2q31 2 | 259 (45%) | 312 |
0.155 (1.00) |
0.0227 (1.00) |
0.754 (1.00) |
0.978 (1.00) |
0.0927 (1.00) |
0.955 (1.00) |
0.771 (1.00) |
0.339 (1.00) |
| amp 3q26 2 | 477 (84%) | 94 |
0.863 (1.00) |
0.00217 (1.00) |
1 (1.00) |
0.0185 (1.00) |
1 (1.00) |
0.825 (1.00) |
0.536 (1.00) |
0.649 (1.00) |
| amp 4p16 3 | 158 (28%) | 413 |
0.541 (1.00) |
0.65 (1.00) |
0.726 (1.00) |
0.368 (1.00) |
0.187 (1.00) |
0.643 (1.00) |
0.535 (1.00) |
0.729 (1.00) |
| amp 4q13 3 | 113 (20%) | 458 |
0.177 (1.00) |
0.191 (1.00) |
0.592 (1.00) |
0.479 (1.00) |
0.485 (1.00) |
0.128 (1.00) |
0.502 (1.00) |
1 (1.00) |
| amp 5p15 33 | 305 (53%) | 266 |
0.0807 (1.00) |
0.0109 (1.00) |
0.753 (1.00) |
0.873 (1.00) |
0.6 (1.00) |
0.105 (1.00) |
0.885 (1.00) |
0.753 (1.00) |
| amp 6p22 3 | 298 (52%) | 273 |
0.0953 (1.00) |
0.00297 (1.00) |
1 (1.00) |
0.371 (1.00) |
1 (1.00) |
0.903 (1.00) |
0.589 (1.00) |
0.344 (1.00) |
| amp 7q36 3 | 314 (55%) | 257 |
0.146 (1.00) |
0.694 (1.00) |
1 (1.00) |
0.105 (1.00) |
0.591 (1.00) |
0.956 (1.00) |
0.0771 (1.00) |
0.344 (1.00) |
| amp 8p11 21 | 209 (37%) | 362 |
0.226 (1.00) |
0.000548 (0.305) |
0.123 (1.00) |
0.827 (1.00) |
0.558 (1.00) |
0.661 (1.00) |
1 (1.00) |
1 (1.00) |
| amp 8q24 21 | 453 (79%) | 118 |
0.484 (1.00) |
0.0953 (1.00) |
1 (1.00) |
0.721 (1.00) |
0.501 (1.00) |
0.921 (1.00) |
0.709 (1.00) |
0.43 (1.00) |
| amp 10q22 3 | 181 (32%) | 390 |
0.36 (1.00) |
0.116 (1.00) |
0.1 (1.00) |
0.96 (1.00) |
1 (1.00) |
0.399 (1.00) |
0.339 (1.00) |
1 (1.00) |
| amp 11q14 1 | 253 (44%) | 318 |
0.583 (1.00) |
0.553 (1.00) |
0.255 (1.00) |
0.631 (1.00) |
1 (1.00) |
0.822 (1.00) |
0.883 (1.00) |
0.525 (1.00) |
| amp 14q11 2 | 146 (26%) | 425 |
0.787 (1.00) |
0.0442 (1.00) |
0.129 (1.00) |
0.386 (1.00) |
0.162 (1.00) |
0.625 (1.00) |
0.433 (1.00) |
0.138 (1.00) |
| amp 14q32 33 | 155 (27%) | 416 |
0.483 (1.00) |
0.0173 (1.00) |
0.718 (1.00) |
0.895 (1.00) |
0.0197 (1.00) |
1 (1.00) |
0.73 (1.00) |
0.716 (1.00) |
| amp 15q26 3 | 159 (28%) | 412 |
0.086 (1.00) |
0.192 (1.00) |
0.733 (1.00) |
0.731 (1.00) |
0.564 (1.00) |
0.797 (1.00) |
0.516 (1.00) |
0.732 (1.00) |
| amp 17q25 3 | 212 (37%) | 359 |
0.15 (1.00) |
0.75 (1.00) |
0.26 (1.00) |
0.957 (1.00) |
1 (1.00) |
0.0737 (1.00) |
0.706 (1.00) |
1 (1.00) |
| amp 18q11 2 | 139 (24%) | 432 |
0.755 (1.00) |
0.106 (1.00) |
0.116 (1.00) |
0.363 (1.00) |
0.568 (1.00) |
0.891 (1.00) |
0.573 (1.00) |
0.263 (1.00) |
| amp 19p13 12 | 312 (55%) | 259 |
0.261 (1.00) |
0.0441 (1.00) |
0.456 (1.00) |
0.227 (1.00) |
0.593 (1.00) |
0.312 (1.00) |
0.956 (1.00) |
1 (1.00) |
| amp 20p13 | 314 (55%) | 257 |
0.305 (1.00) |
0.00503 (1.00) |
0.752 (1.00) |
0.224 (1.00) |
1 (1.00) |
0.731 (1.00) |
0.161 (1.00) |
0.523 (1.00) |
| amp 22q12 2 | 91 (16%) | 480 |
0.519 (1.00) |
0.0397 (1.00) |
0.509 (1.00) |
0.25 (1.00) |
1 (1.00) |
0.625 (1.00) |
0.977 (1.00) |
0.168 (1.00) |
| amp xp11 23 | 158 (28%) | 413 |
0.143 (1.00) |
0.104 (1.00) |
0.0674 (1.00) |
0.739 (1.00) |
0.564 (1.00) |
0.285 (1.00) |
0.932 (1.00) |
1 (1.00) |
| amp xq28 | 216 (38%) | 355 |
0.507 (1.00) |
0.627 (1.00) |
0.776 (1.00) |
0.337 (1.00) |
0.0537 (1.00) |
0.552 (1.00) |
0.827 (1.00) |
0.328 (1.00) |
| del 1p36 11 | 265 (46%) | 306 |
0.175 (1.00) |
0.282 (1.00) |
0.751 (1.00) |
0.678 (1.00) |
1 (1.00) |
0.716 (1.00) |
0.378 (1.00) |
0.523 (1.00) |
| del 1q41 | 94 (16%) | 477 |
0.899 (1.00) |
0.414 (1.00) |
1 (1.00) |
0.952 (1.00) |
0.418 (1.00) |
0.738 (1.00) |
0.0614 (1.00) |
0.375 (1.00) |
| del 2p25 3 | 120 (21%) | 451 |
0.911 (1.00) |
0.458 (1.00) |
0.618 (1.00) |
0.938 (1.00) |
0.508 (1.00) |
0.0255 (1.00) |
0.166 (1.00) |
0.453 (1.00) |
| del 2q22 1 | 134 (23%) | 437 |
0.351 (1.00) |
0.288 (1.00) |
0.663 (1.00) |
0.872 (1.00) |
1 (1.00) |
0.666 (1.00) |
0.433 (1.00) |
0.0628 (1.00) |
| del 2q37 3 | 172 (30%) | 399 |
0.423 (1.00) |
0.0204 (1.00) |
0.354 (1.00) |
0.126 (1.00) |
0.217 (1.00) |
0.645 (1.00) |
0.721 (1.00) |
1 (1.00) |
| del 3p26 2 | 206 (36%) | 365 |
0.749 (1.00) |
0.00396 (1.00) |
0.125 (1.00) |
0.328 (1.00) |
0.0465 (1.00) |
0.476 (1.00) |
0.467 (1.00) |
1 (1.00) |
| del 3q13 31 | 84 (15%) | 487 |
0.442 (1.00) |
0.801 (1.00) |
1 (1.00) |
0.256 (1.00) |
1 (1.00) |
0.521 (1.00) |
0.854 (1.00) |
1 (1.00) |
| del 4q22 1 | 389 (68%) | 182 |
0.553 (1.00) |
0.861 (1.00) |
0.792 (1.00) |
0.629 (1.00) |
1 (1.00) |
0.852 (1.00) |
0.828 (1.00) |
0.173 (1.00) |
| del 4q34 3 | 415 (73%) | 156 |
0.969 (1.00) |
0.475 (1.00) |
0.723 (1.00) |
0.184 (1.00) |
0.566 (1.00) |
0.484 (1.00) |
0.908 (1.00) |
0.0674 (1.00) |
| del 5q12 1 | 349 (61%) | 222 |
0.918 (1.00) |
0.682 (1.00) |
0.771 (1.00) |
0.149 (1.00) |
0.563 (1.00) |
0.369 (1.00) |
0.133 (1.00) |
1 (1.00) |
| del 5q13 2 | 413 (72%) | 158 |
0.238 (1.00) |
0.999 (1.00) |
0.728 (1.00) |
0.0767 (1.00) |
0.187 (1.00) |
0.171 (1.00) |
0.284 (1.00) |
1 (1.00) |
| del 7p22 1 | 250 (44%) | 321 |
0.07 (1.00) |
0.0089 (1.00) |
0.755 (1.00) |
0.383 (1.00) |
1 (1.00) |
0.413 (1.00) |
0.665 (1.00) |
0.75 (1.00) |
| del 8p23 3 | 383 (67%) | 188 |
0.202 (1.00) |
0.0649 (1.00) |
1 (1.00) |
0.637 (1.00) |
1 (1.00) |
0.576 (1.00) |
0.901 (1.00) |
0.175 (1.00) |
| del 8p21 2 | 400 (70%) | 171 |
0.61 (1.00) |
0.0731 (1.00) |
1 (1.00) |
0.658 (1.00) |
1 (1.00) |
0.718 (1.00) |
1 (1.00) |
0.293 (1.00) |
| del 9p24 3 | 259 (45%) | 312 |
0.627 (1.00) |
0.0142 (1.00) |
0.453 (1.00) |
0.648 (1.00) |
0.593 (1.00) |
0.73 (1.00) |
0.906 (1.00) |
1 (1.00) |
| del 9q34 13 | 340 (60%) | 231 |
0.993 (1.00) |
0.0592 (1.00) |
0.765 (1.00) |
0.837 (1.00) |
0.276 (1.00) |
0.757 (1.00) |
0.477 (1.00) |
1 (1.00) |
| del 10p15 3 | 117 (20%) | 454 |
0.363 (1.00) |
0.894 (1.00) |
0.601 (1.00) |
0.765 (1.00) |
0.498 (1.00) |
1 (1.00) |
0.274 (1.00) |
0.696 (1.00) |
| del 10q24 2 | 250 (44%) | 321 |
0.243 (1.00) |
0.0547 (1.00) |
1 (1.00) |
0.801 (1.00) |
0.584 (1.00) |
1 (1.00) |
0.104 (1.00) |
1 (1.00) |
| del 11p15 5 | 340 (60%) | 231 |
0.128 (1.00) |
0.383 (1.00) |
0.0263 (1.00) |
0.373 (1.00) |
1 (1.00) |
0.665 (1.00) |
0.602 (1.00) |
1 (1.00) |
| del 11q25 | 200 (35%) | 371 |
0.746 (1.00) |
0.0389 (1.00) |
0.232 (1.00) |
0.396 (1.00) |
0.282 (1.00) |
0.703 (1.00) |
0.948 (1.00) |
0.0379 (1.00) |
| del 12q24 33 | 214 (37%) | 357 |
0.852 (1.00) |
0.0796 (1.00) |
0.13 (1.00) |
0.778 (1.00) |
0.296 (1.00) |
0.0673 (1.00) |
0.635 (1.00) |
0.0366 (1.00) |
| del 13q14 2 | 358 (63%) | 213 |
0.0762 (1.00) |
0.401 (1.00) |
0.78 (1.00) |
0.969 (1.00) |
0.559 (1.00) |
0.226 (1.00) |
0.123 (1.00) |
0.746 (1.00) |
| del 14q23 3 | 301 (53%) | 270 |
0.969 (1.00) |
0.515 (1.00) |
0.47 (1.00) |
0.126 (1.00) |
0.105 (1.00) |
0.369 (1.00) |
0.255 (1.00) |
0.114 (1.00) |
| del 15q11 2 | 295 (52%) | 276 |
0.855 (1.00) |
0.00382 (1.00) |
0.25 (1.00) |
0.682 (1.00) |
0.25 (1.00) |
0.71 (1.00) |
0.29 (1.00) |
0.752 (1.00) |
| del 15q15 1 | 359 (63%) | 212 |
0.835 (1.00) |
0.00492 (1.00) |
0.41 (1.00) |
0.534 (1.00) |
0.298 (1.00) |
1 (1.00) |
0.739 (1.00) |
0.327 (1.00) |
| del 16p13 3 | 308 (54%) | 263 |
0.965 (1.00) |
0.699 (1.00) |
0.753 (1.00) |
0.399 (1.00) |
0.597 (1.00) |
0.966 (1.00) |
0.931 (1.00) |
0.521 (1.00) |
| del 16q22 1 | 456 (80%) | 115 |
0.725 (1.00) |
0.0129 (1.00) |
0.187 (1.00) |
0.111 (1.00) |
1 (1.00) |
0.0393 (1.00) |
0.952 (1.00) |
0.425 (1.00) |
| del 17p12 | 485 (85%) | 86 |
0.979 (1.00) |
0.784 (1.00) |
0.481 (1.00) |
0.816 (1.00) |
1 (1.00) |
0.714 (1.00) |
0.858 (1.00) |
0.653 (1.00) |
| del 17q11 2 | 466 (82%) | 105 |
0.762 (1.00) |
0.0126 (1.00) |
0.0665 (1.00) |
0.605 (1.00) |
1 (1.00) |
0.956 (1.00) |
0.624 (1.00) |
1 (1.00) |
| del 18q23 | 376 (66%) | 195 |
0.696 (1.00) |
0.617 (1.00) |
0.222 (1.00) |
0.852 (1.00) |
1 (1.00) |
0.0808 (1.00) |
0.246 (1.00) |
1 (1.00) |
| del 19p13 3 | 504 (88%) | 67 |
0.23 (1.00) |
0.027 (1.00) |
1 (1.00) |
0.0822 (1.00) |
1 (1.00) |
1 (1.00) |
0.0751 (1.00) |
1 (1.00) |
| del 19q13 33 | 294 (51%) | 277 |
0.445 (1.00) |
0.568 (1.00) |
1 (1.00) |
0.121 (1.00) |
0.249 (1.00) |
0.384 (1.00) |
0.16 (1.00) |
0.112 (1.00) |
| del 19q13 43 | 280 (49%) | 291 |
0.457 (1.00) |
0.0361 (1.00) |
1 (1.00) |
0.0607 (1.00) |
1 (1.00) |
0.442 (1.00) |
0.153 (1.00) |
0.207 (1.00) |
| del 21q22 3 | 223 (39%) | 348 |
0.436 (1.00) |
0.434 (1.00) |
0.773 (1.00) |
0.247 (1.00) |
1 (1.00) |
0.318 (1.00) |
0.691 (1.00) |
0.329 (1.00) |
| del 22q13 32 | 496 (87%) | 75 |
0.8 (1.00) |
0.856 (1.00) |
0.438 (1.00) |
0.387 (1.00) |
1 (1.00) |
0.813 (1.00) |
0.814 (1.00) |
1 (1.00) |
| del xp21 1 | 352 (62%) | 219 |
0.978 (1.00) |
0.374 (1.00) |
1 (1.00) |
0.754 (1.00) |
0.289 (1.00) |
0.785 (1.00) |
0.922 (1.00) |
0.746 (1.00) |
P value = 7.11e-06 (Wilcoxon-test), Q value = 0.004
Table S1. Gene #2: 'amp_1q21.3' versus Clinical Feature #2: 'AGE'
| nPatients | Mean (Std.Dev) | |
|---|---|---|
| ALL | 550 | 59.8 (11.6) |
| AMP PEAK 2(1Q21.3) MUTATED | 350 | 61.5 (10.9) |
| AMP PEAK 2(1Q21.3) WILD-TYPE | 200 | 56.8 (12.1) |
Figure S1. Get High-res Image Gene #2: 'amp_1q21.3' versus Clinical Feature #2: 'AGE'
P value = 0.000424 (Wilcoxon-test), Q value = 0.24
Table S2. Gene #14: 'amp_10p15.3' versus Clinical Feature #2: 'AGE'
| nPatients | Mean (Std.Dev) | |
|---|---|---|
| ALL | 550 | 59.8 (11.6) |
| AMP PEAK 14(10P15.3) MUTATED | 244 | 61.7 (11.2) |
| AMP PEAK 14(10P15.3) WILD-TYPE | 306 | 58.3 (11.7) |
Figure S2. Get High-res Image Gene #14: 'amp_10p15.3' versus Clinical Feature #2: 'AGE'

P value = 1.89e-07 (Wilcoxon-test), Q value = 0.00011
Table S3. Gene #17: 'amp_12p13.33' versus Clinical Feature #2: 'AGE'
| nPatients | Mean (Std.Dev) | |
|---|---|---|
| ALL | 550 | 59.8 (11.6) |
| AMP PEAK 17(12P13.33) MUTATED | 315 | 62.1 (10.8) |
| AMP PEAK 17(12P13.33) WILD-TYPE | 235 | 56.8 (11.9) |
Figure S3. Get High-res Image Gene #17: 'amp_12p13.33' versus Clinical Feature #2: 'AGE'
P value = 1.66e-08 (Wilcoxon-test), Q value = 9.4e-06
Table S4. Gene #18: 'amp_12p12.1' versus Clinical Feature #2: 'AGE'
| nPatients | Mean (Std.Dev) | |
|---|---|---|
| ALL | 550 | 59.8 (11.6) |
| AMP PEAK 18(12P12.1) MUTATED | 297 | 62.4 (11.2) |
| AMP PEAK 18(12P12.1) WILD-TYPE | 253 | 56.8 (11.3) |
Figure S4. Get High-res Image Gene #18: 'amp_12p12.1' versus Clinical Feature #2: 'AGE'
P value = 4.47e-07 (Wilcoxon-test), Q value = 0.00025
Table S5. Gene #19: 'amp_12q15' versus Clinical Feature #2: 'AGE'
| nPatients | Mean (Std.Dev) | |
|---|---|---|
| ALL | 550 | 59.8 (11.6) |
| AMP PEAK 19(12Q15) MUTATED | 206 | 63.0 (11.3) |
| AMP PEAK 19(12Q15) WILD-TYPE | 344 | 57.9 (11.4) |
Figure S5. Get High-res Image Gene #19: 'amp_12q15' versus Clinical Feature #2: 'AGE'

P value = 1.61e-05 (Wilcoxon-test), Q value = 0.009
Table S6. Gene #26: 'amp_19q12' versus Clinical Feature #2: 'AGE'
| nPatients | Mean (Std.Dev) | |
|---|---|---|
| ALL | 550 | 59.8 (11.6) |
| AMP PEAK 26(19Q12) MUTATED | 306 | 61.8 (11.1) |
| AMP PEAK 26(19Q12) WILD-TYPE | 244 | 57.4 (11.8) |
Figure S6. Get High-res Image Gene #26: 'amp_19q12' versus Clinical Feature #2: 'AGE'
P value = 2.98e-06 (Wilcoxon-test), Q value = 0.0017
Table S7. Gene #27: 'amp_19q13.2' versus Clinical Feature #2: 'AGE'
| nPatients | Mean (Std.Dev) | |
|---|---|---|
| ALL | 550 | 59.8 (11.6) |
| AMP PEAK 27(19Q13.2) MUTATED | 234 | 62.5 (11.2) |
| AMP PEAK 27(19Q13.2) WILD-TYPE | 316 | 57.8 (11.5) |
Figure S7. Get High-res Image Gene #27: 'amp_19q13.2' versus Clinical Feature #2: 'AGE'
P value = 2.44e-08 (Wilcoxon-test), Q value = 1.4e-05
Table S8. Gene #29: 'amp_20q11.21' versus Clinical Feature #2: 'AGE'
| nPatients | Mean (Std.Dev) | |
|---|---|---|
| ALL | 550 | 59.8 (11.6) |
| AMP PEAK 29(20Q11.21) MUTATED | 329 | 62.1 (11.5) |
| AMP PEAK 29(20Q11.21) WILD-TYPE | 221 | 56.4 (10.9) |
Figure S8. Get High-res Image Gene #29: 'amp_20q11.21' versus Clinical Feature #2: 'AGE'
P value = 7.42e-06 (Wilcoxon-test), Q value = 0.0042
Table S9. Gene #30: 'amp_20q13.33' versus Clinical Feature #2: 'AGE'
| nPatients | Mean (Std.Dev) | |
|---|---|---|
| ALL | 550 | 59.8 (11.6) |
| AMP PEAK 30(20Q13.33) MUTATED | 384 | 61.3 (11.5) |
| AMP PEAK 30(20Q13.33) WILD-TYPE | 166 | 56.5 (11.1) |
Figure S9. Get High-res Image Gene #30: 'amp_20q13.33' versus Clinical Feature #2: 'AGE'
P value = 9.39e-05 (Wilcoxon-test), Q value = 0.053
Table S10. Gene #45: 'del_6q27' versus Clinical Feature #2: 'AGE'
| nPatients | Mean (Std.Dev) | |
|---|---|---|
| ALL | 550 | 59.8 (11.6) |
| DEL PEAK 12(6Q27) MUTATED | 358 | 58.4 (11.4) |
| DEL PEAK 12(6Q27) WILD-TYPE | 192 | 62.4 (11.5) |
Figure S10. Get High-res Image Gene #45: 'del_6q27' versus Clinical Feature #2: 'AGE'
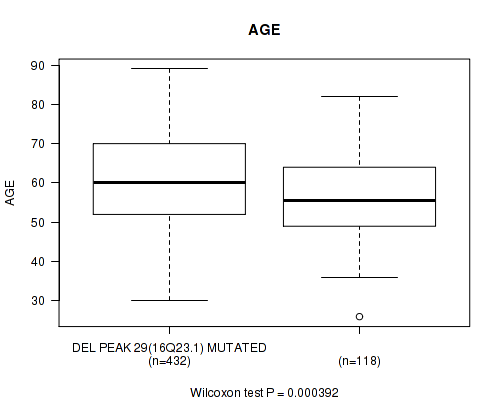
P value = 0.000392 (Wilcoxon-test), Q value = 0.22
Table S11. Gene #62: 'del_16q23.1' versus Clinical Feature #2: 'AGE'
| nPatients | Mean (Std.Dev) | |
|---|---|---|
| ALL | 550 | 59.8 (11.6) |
| DEL PEAK 29(16Q23.1) MUTATED | 432 | 60.8 (11.5) |
| DEL PEAK 29(16Q23.1) WILD-TYPE | 118 | 56.3 (11.3) |
Figure S11. Get High-res Image Gene #62: 'del_16q23.1' versus Clinical Feature #2: 'AGE'
-
Copy number data file = transformed.cor.cli.txt
-
Clinical data file = OV-TP.merged_data.txt
-
Number of patients = 571
-
Number of significantly focal cnvs = 71
-
Number of selected clinical features = 8
-
Exclude genes that fewer than K tumors have mutations, K = 3
For survival clinical features, the Kaplan-Meier survival curves of tumors with and without gene mutations were plotted and the statistical significance P values were estimated by logrank test (Bland and Altman 2004) using the 'survdiff' function in R
For binary or multi-class clinical features (nominal or ordinal), two-tailed Fisher's exact tests (Fisher 1922) were used to estimate the P values using the 'fisher.test' function in R
For multiple hypothesis correction, Q value is the False Discovery Rate (FDR) analogue of the P value (Benjamini and Hochberg 1995), defined as the minimum FDR at which the test may be called significant. We used the 'Benjamini and Hochberg' method of 'p.adjust' function in R to convert P values into Q values.
In addition to the links below, the full results of the analysis summarized in this report can also be downloaded programmatically using firehose_get, or interactively from either the Broad GDAC website or TCGA Data Coordination Center Portal.