This pipeline computes the correlation between significant arm-level copy number variations (cnvs) and selected clinical features.
Testing the association between copy number variation 63 arm-level events and 4 clinical features across 129 patients, one significant finding detected with Q value < 0.25.
-
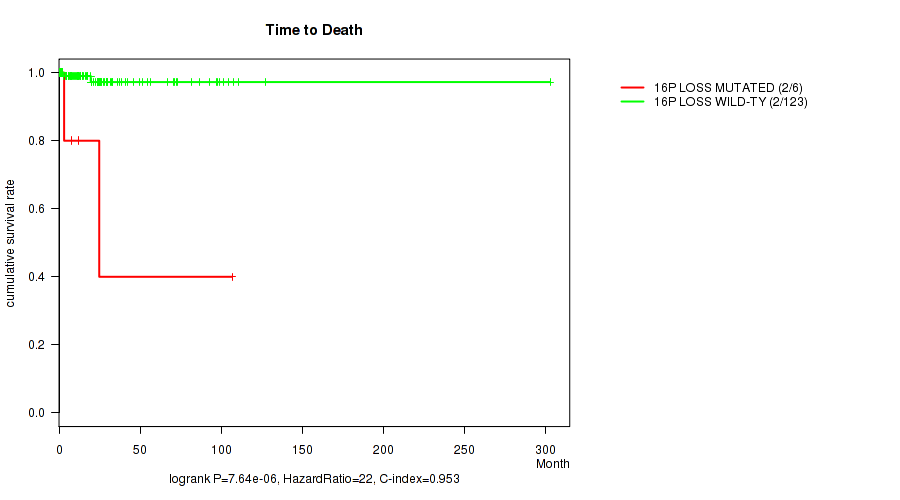
16p loss cnv correlated to 'Time to Death'.
Table 1. Get Full Table Overview of the association between significant copy number variation of 63 arm-level events and 4 clinical features. Shown in the table are P values (Q values). Thresholded by Q value < 0.25, one significant finding detected.
|
Clinical Features |
Time to Death |
AGE | GENDER | RACE | ||
| nCNV (%) | nWild-Type | logrank test | Wilcoxon-test | Fisher's exact test | Fisher's exact test | |
| 16p loss | 6 (5%) | 123 |
7.64e-06 (0.00193) |
0.524 (1.00) |
1 (1.00) |
1 (1.00) |
| 1p gain | 6 (5%) | 123 |
0.606 (1.00) |
0.395 (1.00) |
0.0847 (1.00) |
1 (1.00) |
| 1q gain | 15 (12%) | 114 |
0.616 (1.00) |
0.056 (1.00) |
0.0937 (1.00) |
0.777 (1.00) |
| 2p gain | 3 (2%) | 126 |
0.779 (1.00) |
0.667 (1.00) |
0.257 (1.00) |
0.126 (1.00) |
| 4p gain | 3 (2%) | 126 |
0.667 (1.00) |
0.537 (1.00) |
0.579 (1.00) |
0.128 (1.00) |
| 4q gain | 3 (2%) | 126 |
0.728 (1.00) |
0.399 (1.00) |
0.579 (1.00) |
1 (1.00) |
| 5p gain | 9 (7%) | 120 |
0.577 (1.00) |
0.227 (1.00) |
0.731 (1.00) |
1 (1.00) |
| 5q gain | 6 (5%) | 123 |
0.635 (1.00) |
0.893 (1.00) |
0.233 (1.00) |
1 (1.00) |
| 6p gain | 10 (8%) | 119 |
0.637 (1.00) |
0.0649 (1.00) |
0.512 (1.00) |
1 (1.00) |
| 6q gain | 4 (3%) | 125 |
0.782 (1.00) |
0.159 (1.00) |
0.632 (1.00) |
1 (1.00) |
| 7p gain | 22 (17%) | 107 |
0.432 (1.00) |
0.491 (1.00) |
0.637 (1.00) |
0.548 (1.00) |
| 7q gain | 18 (14%) | 111 |
0.517 (1.00) |
0.744 (1.00) |
0.127 (1.00) |
0.581 (1.00) |
| 8p gain | 7 (5%) | 122 |
0.576 (1.00) |
0.4 (1.00) |
0.698 (1.00) |
0.571 (1.00) |
| 8q gain | 10 (8%) | 119 |
0.285 (1.00) |
0.795 (1.00) |
0.746 (1.00) |
0.336 (1.00) |
| 9p gain | 3 (2%) | 126 |
0.732 (1.00) |
0.944 (1.00) |
1 (1.00) |
1 (1.00) |
| 10p gain | 9 (7%) | 120 |
0.623 (1.00) |
0.654 (1.00) |
0.731 (1.00) |
1 (1.00) |
| 10q gain | 8 (6%) | 121 |
0.621 (1.00) |
0.671 (1.00) |
0.727 (1.00) |
1 (1.00) |
| 11p gain | 5 (4%) | 124 |
0.778 (1.00) |
0.705 (1.00) |
0.387 (1.00) |
1 (1.00) |
| 12p gain | 7 (5%) | 122 |
0.637 (1.00) |
0.483 (1.00) |
0.698 (1.00) |
1 (1.00) |
| 12q gain | 10 (8%) | 119 |
0.564 (1.00) |
0.982 (1.00) |
0.512 (1.00) |
1 (1.00) |
| 13q gain | 7 (5%) | 122 |
0.688 (1.00) |
0.716 (1.00) |
1 (1.00) |
1 (1.00) |
| 15q gain | 10 (8%) | 119 |
0.579 (1.00) |
0.317 (1.00) |
0.746 (1.00) |
0.449 (1.00) |
| 16p gain | 5 (4%) | 124 |
0.711 (1.00) |
0.534 (1.00) |
1 (1.00) |
1 (1.00) |
| 16q gain | 4 (3%) | 125 |
0.732 (1.00) |
0.19 (1.00) |
1 (1.00) |
1 (1.00) |
| 17q gain | 4 (3%) | 125 |
0.732 (1.00) |
0.876 (1.00) |
0.316 (1.00) |
0.38 (1.00) |
| 18p gain | 4 (3%) | 125 |
0.655 (1.00) |
0.514 (1.00) |
0.632 (1.00) |
1 (1.00) |
| 18q gain | 7 (5%) | 122 |
0.563 (1.00) |
0.592 (1.00) |
0.698 (1.00) |
1 (1.00) |
| 19p gain | 16 (12%) | 113 |
0.618 (1.00) |
0.098 (1.00) |
0.42 (1.00) |
0.801 (1.00) |
| 19q gain | 11 (9%) | 118 |
0.492 (1.00) |
0.0822 (1.00) |
0.756 (1.00) |
1 (1.00) |
| 20p gain | 10 (8%) | 119 |
0.593 (1.00) |
0.459 (1.00) |
0.512 (1.00) |
1 (1.00) |
| 20q gain | 7 (5%) | 122 |
0.623 (1.00) |
0.181 (1.00) |
0.698 (1.00) |
1 (1.00) |
| xq gain | 4 (3%) | 125 |
0.692 (1.00) |
0.582 (1.00) |
0.632 (1.00) |
1 (1.00) |
| 1p loss | 78 (60%) | 51 |
0.169 (1.00) |
0.609 (1.00) |
1 (1.00) |
0.743 (1.00) |
| 1q loss | 17 (13%) | 112 |
0.526 (1.00) |
0.953 (1.00) |
0.439 (1.00) |
0.372 (1.00) |
| 2p loss | 7 (5%) | 122 |
0.782 (1.00) |
0.218 (1.00) |
1 (1.00) |
0.569 (1.00) |
| 2q loss | 8 (6%) | 121 |
0.0582 (1.00) |
0.718 (1.00) |
0.727 (1.00) |
0.622 (1.00) |
| 3p loss | 47 (36%) | 82 |
0.11 (1.00) |
0.334 (1.00) |
0.268 (1.00) |
0.0474 (1.00) |
| 3q loss | 70 (54%) | 59 |
0.259 (1.00) |
0.0683 (1.00) |
0.722 (1.00) |
0.809 (1.00) |
| 4p loss | 8 (6%) | 121 |
0.697 (1.00) |
0.83 (1.00) |
0.727 (1.00) |
1 (1.00) |
| 4q loss | 8 (6%) | 121 |
0.662 (1.00) |
0.718 (1.00) |
0.727 (1.00) |
1 (1.00) |
| 5p loss | 4 (3%) | 125 |
0.808 (1.00) |
0.649 (1.00) |
0.316 (1.00) |
1 (1.00) |
| 5q loss | 6 (5%) | 123 |
0.669 (1.00) |
0.389 (1.00) |
0.402 (1.00) |
0.51 (1.00) |
| 6q loss | 16 (12%) | 113 |
0.45 (1.00) |
0.825 (1.00) |
0.177 (1.00) |
1 (1.00) |
| 7q loss | 4 (3%) | 125 |
0.651 (1.00) |
0.957 (1.00) |
0.632 (1.00) |
0.00181 (0.454) |
| 8p loss | 15 (12%) | 114 |
0.553 (1.00) |
0.532 (1.00) |
0.267 (1.00) |
0.398 (1.00) |
| 8q loss | 9 (7%) | 120 |
0.222 (1.00) |
0.93 (1.00) |
0.731 (1.00) |
1 (1.00) |
| 9p loss | 7 (5%) | 122 |
0.101 (1.00) |
0.783 (1.00) |
0.138 (1.00) |
0.572 (1.00) |
| 9q loss | 8 (6%) | 121 |
0.249 (1.00) |
0.488 (1.00) |
0.465 (1.00) |
0.247 (1.00) |
| 11p loss | 41 (32%) | 88 |
0.882 (1.00) |
0.573 (1.00) |
0.448 (1.00) |
0.25 (1.00) |
| 11q loss | 34 (26%) | 95 |
0.807 (1.00) |
0.386 (1.00) |
1 (1.00) |
0.826 (1.00) |
| 13q loss | 6 (5%) | 123 |
0.688 (1.00) |
0.599 (1.00) |
0.697 (1.00) |
0.161 (1.00) |
| 14q loss | 16 (12%) | 113 |
0.473 (1.00) |
0.453 (1.00) |
0.789 (1.00) |
1 (1.00) |
| 15q loss | 3 (2%) | 126 |
0.707 (1.00) |
0.399 (1.00) |
0.257 (1.00) |
0.0327 (1.00) |
| 16q loss | 4 (3%) | 125 |
0.753 (1.00) |
0.447 (1.00) |
0.632 (1.00) |
1 (1.00) |
| 17p loss | 50 (39%) | 79 |
0.536 (1.00) |
0.672 (1.00) |
0.275 (1.00) |
0.138 (1.00) |
| 17q loss | 16 (12%) | 113 |
0.414 (1.00) |
0.319 (1.00) |
0.293 (1.00) |
1 (1.00) |
| 18p loss | 10 (8%) | 119 |
0.644 (1.00) |
0.481 (1.00) |
0.329 (1.00) |
0.449 (1.00) |
| 18q loss | 3 (2%) | 126 |
0.89 (1.00) |
0.365 (1.00) |
1 (1.00) |
0.298 (1.00) |
| 19q loss | 4 (3%) | 125 |
0.651 (1.00) |
0.467 (1.00) |
0.632 (1.00) |
0.173 (1.00) |
| 20q loss | 3 (2%) | 126 |
0.844 (1.00) |
0.913 (1.00) |
1 (1.00) |
1 (1.00) |
| 21q loss | 30 (23%) | 99 |
0.315 (1.00) |
0.286 (1.00) |
0.0982 (1.00) |
0.395 (1.00) |
| 22q loss | 47 (36%) | 82 |
0.0767 (1.00) |
0.512 (1.00) |
0.713 (1.00) |
0.548 (1.00) |
| xq loss | 38 (29%) | 91 |
0.932 (1.00) |
0.723 (1.00) |
0.697 (1.00) |
0.0911 (1.00) |
P value = 7.64e-06 (logrank test), Q value = 0.0019
Table S1. Gene #53: '16p loss' versus Clinical Feature #1: 'Time to Death'
| nPatients | nDeath | Duration Range (Median), Month | |
|---|---|---|---|
| ALL | 129 | 4 | 0.1 - 303.1 (15.0) |
| 16P LOSS MUTATED | 6 | 2 | 0.8 - 106.8 (9.8) |
| 16P LOSS WILD-TYPE | 123 | 2 | 0.1 - 303.1 (16.6) |
Figure S1. Get High-res Image Gene #53: '16p loss' versus Clinical Feature #1: 'Time to Death'
-
Copy number data file = transformed.cor.cli.txt
-
Clinical data file = PCPG-TP.merged_data.txt
-
Number of patients = 129
-
Number of significantly arm-level cnvs = 63
-
Number of selected clinical features = 4
-
Exclude regions that fewer than K tumors have mutations, K = 3
For survival clinical features, the Kaplan-Meier survival curves of tumors with and without gene mutations were plotted and the statistical significance P values were estimated by logrank test (Bland and Altman 2004) using the 'survdiff' function in R
For binary or multi-class clinical features (nominal or ordinal), two-tailed Fisher's exact tests (Fisher 1922) were used to estimate the P values using the 'fisher.test' function in R
For multiple hypothesis correction, Q value is the False Discovery Rate (FDR) analogue of the P value (Benjamini and Hochberg 1995), defined as the minimum FDR at which the test may be called significant. We used the 'Benjamini and Hochberg' method of 'p.adjust' function in R to convert P values into Q values.
In addition to the links below, the full results of the analysis summarized in this report can also be downloaded programmatically using firehose_get, or interactively from either the Broad GDAC website or TCGA Data Coordination Center Portal.