This pipeline computes the correlation between significant copy number variation (cnv focal) genes and selected clinical features.
Testing the association between copy number variation 28 focal events and 4 clinical features across 129 patients, one significant finding detected with Q value < 0.25.
-
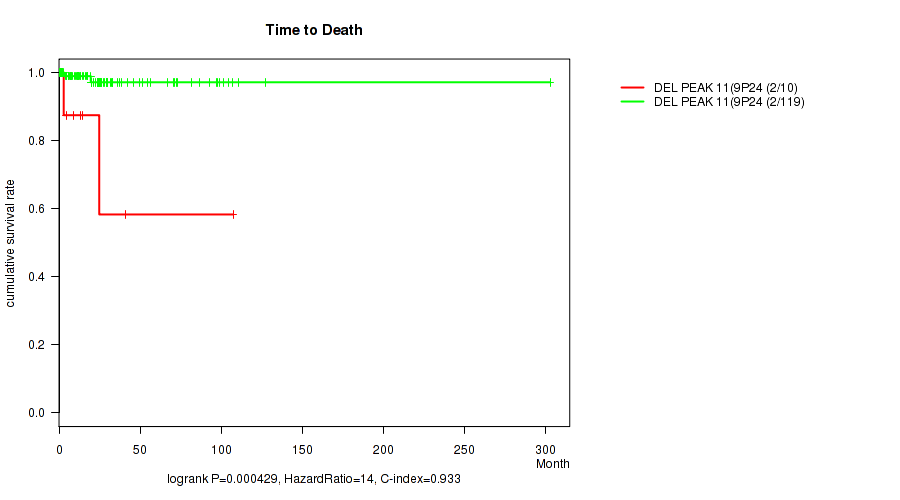
del_9p24.2 cnv correlated to 'Time to Death'.
Table 1. Get Full Table Overview of the association between significant copy number variation of 28 focal events and 4 clinical features. Shown in the table are P values (Q values). Thresholded by Q value < 0.25, one significant finding detected.
|
Clinical Features |
Time to Death |
AGE | GENDER | RACE | ||
| nCNV (%) | nWild-Type | logrank test | Wilcoxon-test | Fisher's exact test | Fisher's exact test | |
| del 9p24 2 | 10 (8%) | 119 |
0.000429 (0.0481) |
0.489 (1.00) |
1 (1.00) |
0.706 (1.00) |
| amp 1q21 3 | 21 (16%) | 108 |
0.16 (1.00) |
0.287 (1.00) |
0.0289 (1.00) |
0.519 (1.00) |
| amp 4q25 | 6 (5%) | 123 |
0.667 (1.00) |
0.929 (1.00) |
0.402 (1.00) |
0.514 (1.00) |
| amp 4q31 1 | 11 (9%) | 118 |
0.549 (1.00) |
0.28 (1.00) |
0.531 (1.00) |
1 (1.00) |
| amp 11p15 2 | 8 (6%) | 121 |
0.604 (1.00) |
0.922 (1.00) |
0.465 (1.00) |
0.0484 (1.00) |
| amp 12q13 3 | 12 (9%) | 117 |
0.504 (1.00) |
0.156 (1.00) |
0.551 (1.00) |
0.423 (1.00) |
| amp 14q24 3 | 7 (5%) | 122 |
0.589 (1.00) |
0.457 (1.00) |
1 (1.00) |
0.0191 (1.00) |
| amp 17q21 31 | 13 (10%) | 116 |
0.0216 (1.00) |
0.427 (1.00) |
0.016 (1.00) |
0.766 (1.00) |
| del 1p12 | 92 (71%) | 37 |
0.329 (1.00) |
0.983 (1.00) |
1 (1.00) |
0.683 (1.00) |
| del 1q42 13 | 12 (9%) | 117 |
0.54 (1.00) |
0.282 (1.00) |
0.362 (1.00) |
0.741 (1.00) |
| del 3p24 1 | 49 (38%) | 80 |
0.497 (1.00) |
0.241 (1.00) |
0.274 (1.00) |
0.368 (1.00) |
| del 3q26 1 | 75 (58%) | 54 |
0.21 (1.00) |
0.139 (1.00) |
0.374 (1.00) |
0.435 (1.00) |
| del 4q28 3 | 8 (6%) | 121 |
0.697 (1.00) |
0.961 (1.00) |
0.727 (1.00) |
0.624 (1.00) |
| del 5q15 | 11 (9%) | 118 |
0.564 (1.00) |
0.797 (1.00) |
0.531 (1.00) |
0.382 (1.00) |
| del 6p12 3 | 6 (5%) | 123 |
0.652 (1.00) |
0.767 (1.00) |
0.0356 (1.00) |
0.45 (1.00) |
| del 6q16 1 | 18 (14%) | 111 |
0.412 (1.00) |
0.668 (1.00) |
0.0717 (1.00) |
0.816 (1.00) |
| del 8p22 | 20 (16%) | 109 |
0.796 (1.00) |
0.369 (1.00) |
0.226 (1.00) |
0.853 (1.00) |
| del 8q23 3 | 10 (8%) | 119 |
0.271 (1.00) |
0.975 (1.00) |
0.512 (1.00) |
1 (1.00) |
| del 9q21 12 | 10 (8%) | 119 |
0.324 (1.00) |
0.996 (1.00) |
0.512 (1.00) |
0.338 (1.00) |
| del 11p15 4 | 45 (35%) | 84 |
0.143 (1.00) |
0.33 (1.00) |
0.71 (1.00) |
1 (1.00) |
| del 11q22 1 | 39 (30%) | 90 |
0.942 (1.00) |
0.204 (1.00) |
0.847 (1.00) |
0.455 (1.00) |
| del 12q21 33 | 5 (4%) | 124 |
0.708 (1.00) |
0.798 (1.00) |
0.387 (1.00) |
1 (1.00) |
| del 13q22 3 | 5 (4%) | 124 |
0.708 (1.00) |
0.393 (1.00) |
1 (1.00) |
0.22 (1.00) |
| del 16q21 | 4 (3%) | 125 |
0.707 (1.00) |
1 (1.00) |
0.632 (1.00) |
0.381 (1.00) |
| del 17p13 2 | 53 (41%) | 76 |
0.641 (1.00) |
0.916 (1.00) |
0.477 (1.00) |
0.38 (1.00) |
| del 17q11 2 | 36 (28%) | 93 |
0.251 (1.00) |
0.902 (1.00) |
0.845 (1.00) |
0.828 (1.00) |
| del 22q13 31 | 54 (42%) | 75 |
0.142 (1.00) |
0.36 (1.00) |
1 (1.00) |
0.396 (1.00) |
| del xp21 1 | 36 (28%) | 93 |
0.966 (1.00) |
0.483 (1.00) |
0.558 (1.00) |
0.0645 (1.00) |
P value = 0.000429 (logrank test), Q value = 0.048
Table S1. Gene #18: 'del_9p24.2' versus Clinical Feature #1: 'Time to Death'
| nPatients | nDeath | Duration Range (Median), Month | |
|---|---|---|---|
| ALL | 129 | 4 | 0.1 - 303.1 (15.0) |
| DEL PEAK 11(9P24.2) MUTATED | 10 | 2 | 1.6 - 107.5 (11.2) |
| DEL PEAK 11(9P24.2) WILD-TYPE | 119 | 2 | 0.1 - 303.1 (17.2) |
Figure S1. Get High-res Image Gene #18: 'del_9p24.2' versus Clinical Feature #1: 'Time to Death'
-
Copy number data file = transformed.cor.cli.txt
-
Clinical data file = PCPG-TP.merged_data.txt
-
Number of patients = 129
-
Number of significantly focal cnvs = 28
-
Number of selected clinical features = 4
-
Exclude genes that fewer than K tumors have mutations, K = 3
For survival clinical features, the Kaplan-Meier survival curves of tumors with and without gene mutations were plotted and the statistical significance P values were estimated by logrank test (Bland and Altman 2004) using the 'survdiff' function in R
For binary or multi-class clinical features (nominal or ordinal), two-tailed Fisher's exact tests (Fisher 1922) were used to estimate the P values using the 'fisher.test' function in R
For multiple hypothesis correction, Q value is the False Discovery Rate (FDR) analogue of the P value (Benjamini and Hochberg 1995), defined as the minimum FDR at which the test may be called significant. We used the 'Benjamini and Hochberg' method of 'p.adjust' function in R to convert P values into Q values.
In addition to the links below, the full results of the analysis summarized in this report can also be downloaded programmatically using firehose_get, or interactively from either the Broad GDAC website or TCGA Data Coordination Center Portal.