This pipeline computes the correlation between significantly recurrent gene mutations and selected clinical features.
Testing the association between mutation status of 6 genes and 5 clinical features across 132 patients, one significant finding detected with Q value < 0.25.
-
RET mutation correlated to 'RACE'.
Table 1. Get Full Table Overview of the association between mutation status of 6 genes and 5 clinical features. Shown in the table are P values (Q values). Thresholded by Q value < 0.25, one significant finding detected.
|
Clinical Features |
Time to Death |
AGE | GENDER | RACE | ETHNICITY | ||
| nMutated (%) | nWild-Type | logrank test | Wilcoxon-test | Fisher's exact test | Fisher's exact test | Fisher's exact test | |
| RET | 6 (5%) | 126 |
0.694 (1.00) |
0.698 (1.00) |
0.698 (1.00) |
0.00607 (0.182) |
1 (1.00) |
| HRAS | 14 (11%) | 118 |
0.491 (1.00) |
0.258 (1.00) |
0.776 (1.00) |
0.211 (1.00) |
1 (1.00) |
| EPAS1 | 7 (5%) | 125 |
0.659 (1.00) |
0.685 (1.00) |
0.698 (1.00) |
0.215 (1.00) |
1 (1.00) |
| NF1 | 13 (10%) | 119 |
0.574 (1.00) |
0.0337 (0.977) |
1 (1.00) |
0.787 (1.00) |
1 (1.00) |
| CSDE1 | 4 (3%) | 128 |
0.699 (1.00) |
0.222 (1.00) |
0.315 (1.00) |
1 (1.00) |
1 (1.00) |
| AMMECR1 | 3 (2%) | 129 |
0.812 (1.00) |
0.376 (1.00) |
1 (1.00) |
0.312 (1.00) |
1 (1.00) |
P value = 0.00607 (Fisher's exact test), Q value = 0.18
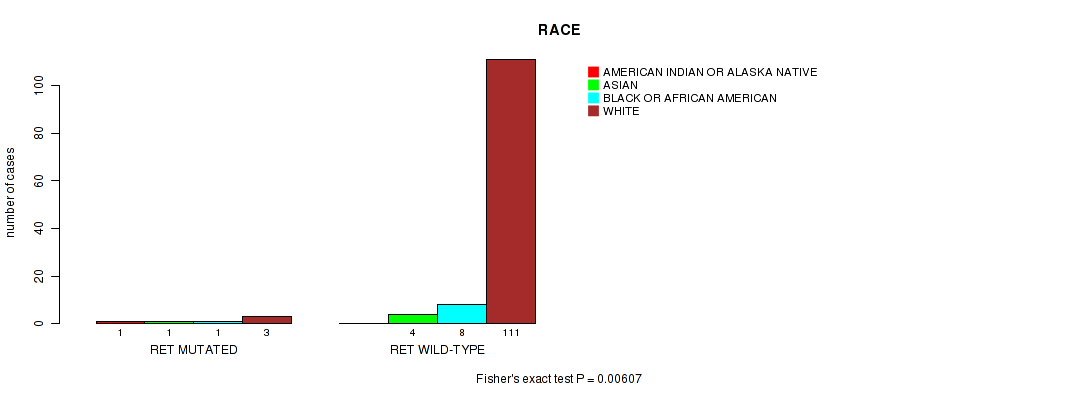
Table S1. Gene #4: 'RET MUTATION STATUS' versus Clinical Feature #4: 'RACE'
| nPatients | AMERICAN INDIAN OR ALASKA NATIVE | ASIAN | BLACK OR AFRICAN AMERICAN | WHITE |
|---|---|---|---|---|
| ALL | 1 | 5 | 9 | 114 |
| RET MUTATED | 1 | 1 | 1 | 3 |
| RET WILD-TYPE | 0 | 4 | 8 | 111 |
Figure S1. Get High-res Image Gene #4: 'RET MUTATION STATUS' versus Clinical Feature #4: 'RACE'
-
Mutation data file = transformed.cor.cli.txt
-
Clinical data file = PCPG-TP.merged_data.txt
-
Number of patients = 132
-
Number of significantly mutated genes = 6
-
Number of selected clinical features = 5
-
Exclude genes that fewer than K tumors have mutations, K = 3
For survival clinical features, the Kaplan-Meier survival curves of tumors with and without gene mutations were plotted and the statistical significance P values were estimated by logrank test (Bland and Altman 2004) using the 'survdiff' function in R
For binary or multi-class clinical features (nominal or ordinal), two-tailed Fisher's exact tests (Fisher 1922) were used to estimate the P values using the 'fisher.test' function in R
For multiple hypothesis correction, Q value is the False Discovery Rate (FDR) analogue of the P value (Benjamini and Hochberg 1995), defined as the minimum FDR at which the test may be called significant. We used the 'Benjamini and Hochberg' method of 'p.adjust' function in R to convert P values into Q values.
In addition to the links below, the full results of the analysis summarized in this report can also be downloaded programmatically using firehose_get, or interactively from either the Broad GDAC website or TCGA Data Coordination Center Portal.