This report serves to describe the mutational landscape and properties of a given individual set, as well as rank genes and genesets according to mutational significance. MutSig v2.0 was used to generate the results found in this report.
-
Working with individual set: PCPG-TP
-
Number of patients in set: 178
The input for this pipeline is a set of individuals with the following files associated for each:
-
An annotated .maf file describing the mutations called for the respective individual, and their properties.
-
A .wig file that contains information about the coverage of the sample.
-
MAF used for this analysis:PCPG-TP.final_analysis_set.maf
-
Blacklist used for this analysis: pancan_mutation_blacklist.v14.hg19.txt
-
Significantly mutated genes (q ≤ 0.1): 9
-
Mutations seen in COSMIC: 36
-
Significantly mutated genes in COSMIC territory: 4
-
Significantly mutated genesets: 62
-
Significantly mutated genesets: (excluding sig. mutated genes):0
-
Read 178 MAFs of type "Broad"
-
Total number of mutations in input MAFs: 4472
-
After removing 857 blacklisted mutations: 3615
-
After removing 407 noncoding mutations: 3208
-
After collapsing adjacent/redundant mutations: 3172
-
Number of mutations before filtering: 3172
-
After removing 154 mutations outside gene set: 3018
-
After removing 4 mutations outside category set: 3014
-
After removing 1 "impossible" mutations in
-
gene-patient-category bins of zero coverage: 2855
Table 1. Get Full Table Table representing breakdown of mutations by type.
| type | count |
|---|---|
| Frame_Shift_Del | 228 |
| Frame_Shift_Ins | 29 |
| In_Frame_Del | 45 |
| In_Frame_Ins | 9 |
| Missense_Mutation | 1799 |
| Nonsense_Mutation | 71 |
| Nonstop_Mutation | 3 |
| Silent | 704 |
| Splice_Site | 103 |
| Translation_Start_Site | 23 |
| Total | 3014 |
Table 2. Get Full Table A breakdown of mutation rates per category discovered for this individual set.
| category | n | N | rate | rate_per_mb | relative_rate | exp_ns_s_ratio |
|---|---|---|---|---|---|---|
| *CpG->T | 435 | 273564027 | 1.6e-06 | 1.6 | 3.5 | 2.1 |
| *Cp(A/C/T)->T | 416 | 2298422652 | 1.8e-07 | 0.18 | 0.4 | 1.7 |
| A->G | 342 | 2507671680 | 1.4e-07 | 0.14 | 0.3 | 2.3 |
| transver | 625 | 5079658359 | 1.2e-07 | 0.12 | 0.27 | 5.1 |
| indel+null | 488 | 5079658359 | 9.6e-08 | 0.096 | 0.21 | NaN |
| double_null | 3 | 5079658359 | 5.9e-10 | 0.00059 | 0.0013 | NaN |
| Total | 2309 | 5079658359 | 4.5e-07 | 0.45 | 1 | 3.5 |
The x axis represents the samples. The y axis represents the exons, one row per exon, and they are sorted by average coverage across samples. For exons with exactly the same average coverage, they are sorted next by the %GC of the exon. (The secondary sort is especially useful for the zero-coverage exons at the bottom). If the figure is unpopulated, then full coverage is assumed (e.g. MutSig CV doesn't use WIGs and assumes full coverage).
Figure 1.
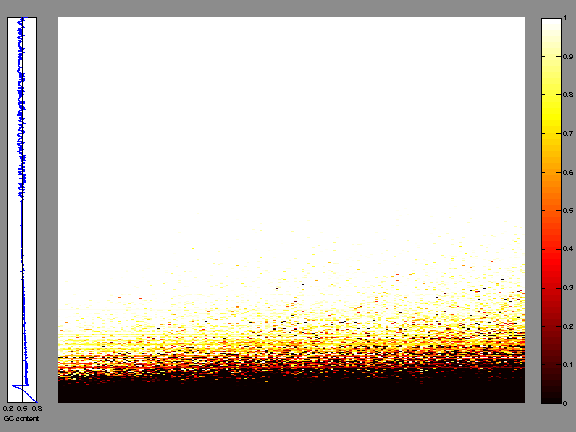
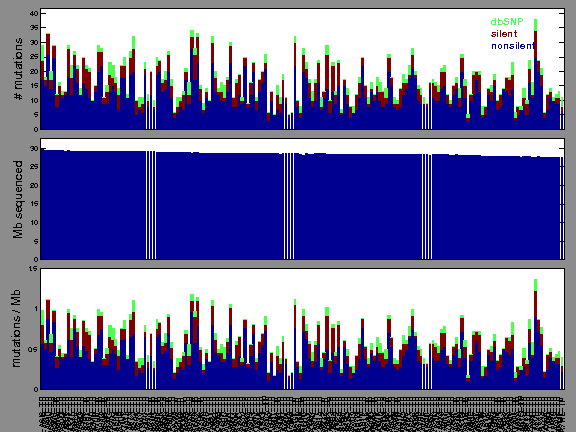
Figure 2. Patients counts and rates file used to generate this plot: PCPG-TP.patients.counts_and_rates.txt
The mutation spectrum is depicted in the lego plots below in which the 96 possible mutation types are subdivided into six large blocks, color-coded to reflect the base substitution type. Each large block is further subdivided into the 16 possible pairs of 5' and 3' neighbors, as listed in the 4x4 trinucleotide context legend. The height of each block corresponds to the mutation frequency for that kind of mutation (counts of mutations normalized by the base coverage in a given bin). The shape of the spectrum is a signature for dominant mutational mechanisms in different tumor types.
Figure 3. Get High-res Image SNV Mutation rate lego plot for entire set. Each bin is normalized by base coverage for that bin. Colors represent the six SNV types on the upper right. The three-base context for each mutation is labeled in the 4x4 legend on the lower right. The fractional breakdown of SNV counts is shown in the pie chart on the upper left. If this figure is blank, not enough information was provided in the MAF to generate it.
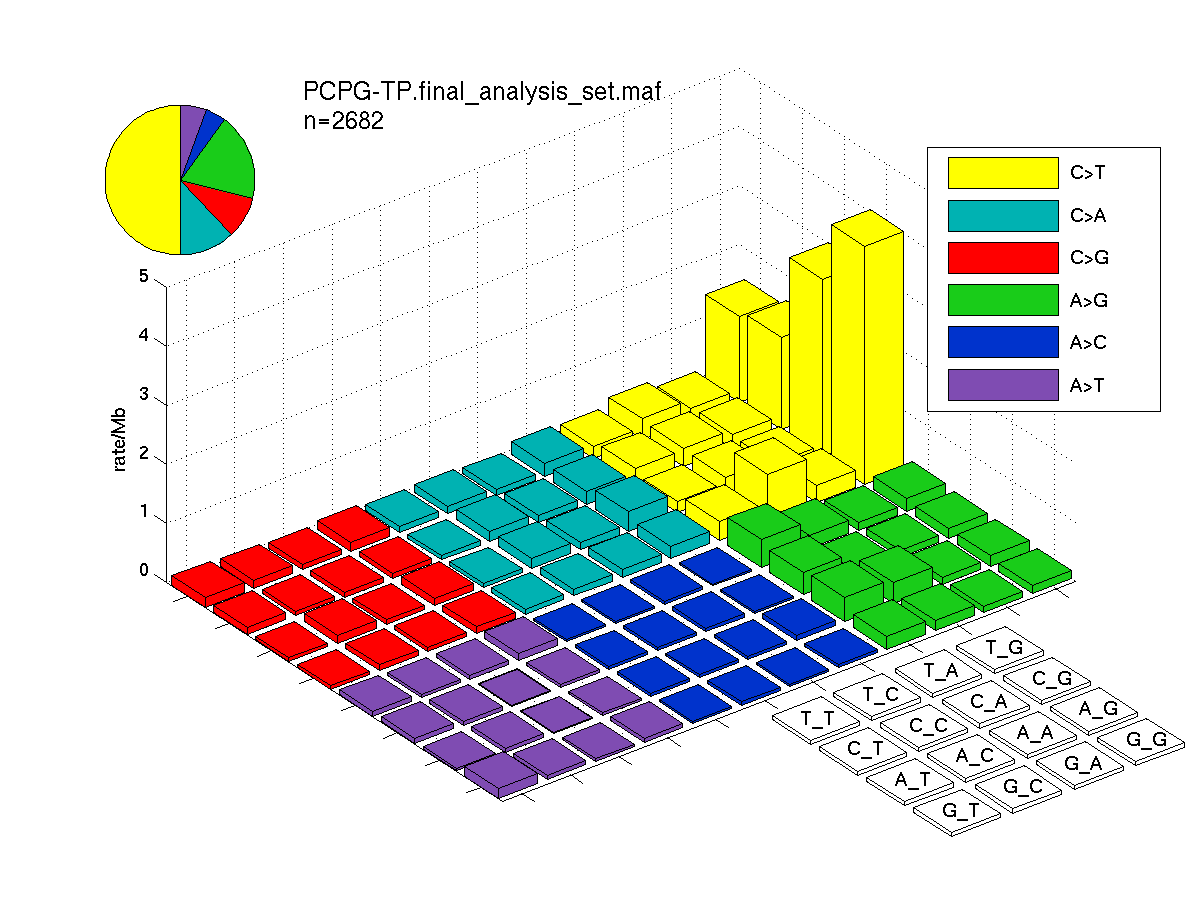
Figure 4. Get High-res Image SNV Mutation rate lego plots for 4 slices of mutation allele fraction (0<=AF<0.1, 0.1<=AF<0.25, 0.25<=AF<0.5, & 0.5<=AF) . The color code and three-base context legends are the same as the previous figure. If this figure is blank, not enough information was provided in the MAF to generate it.
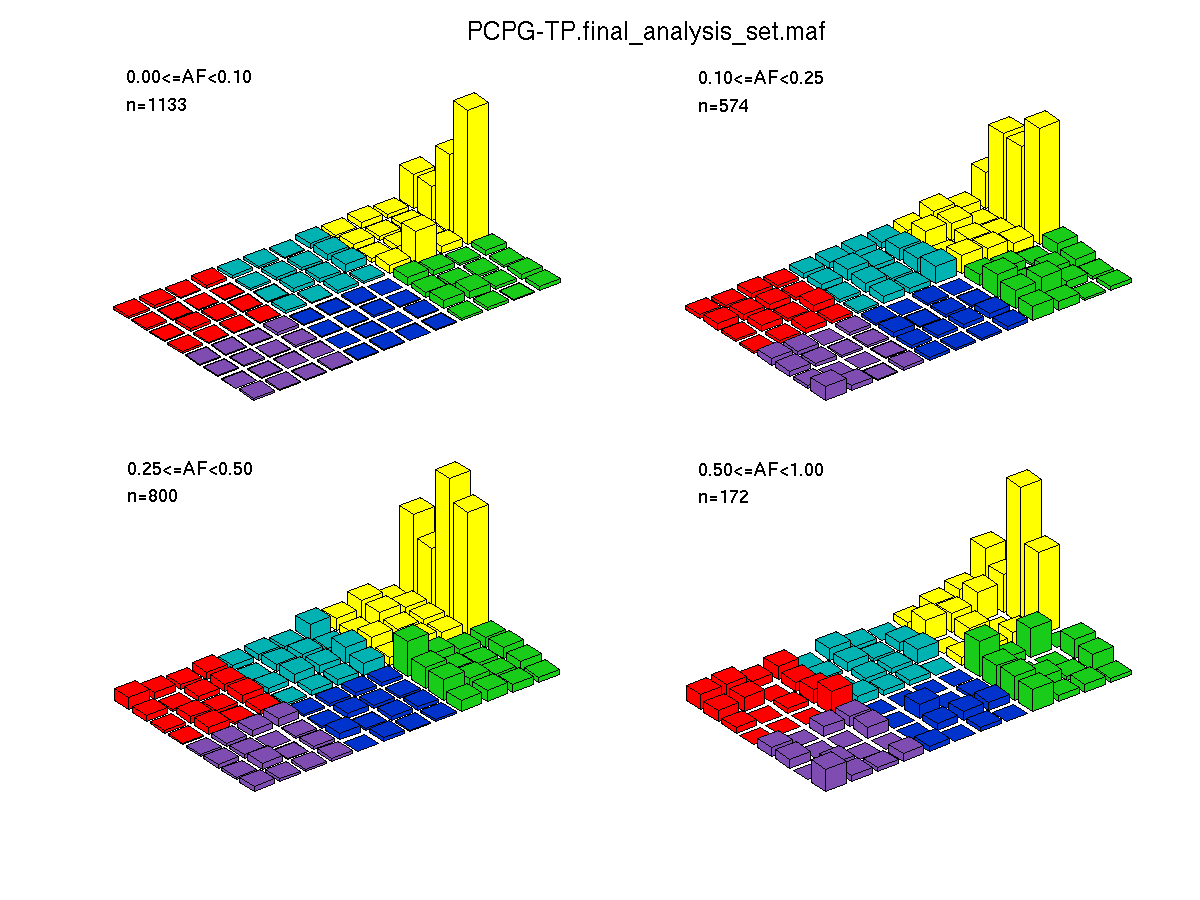
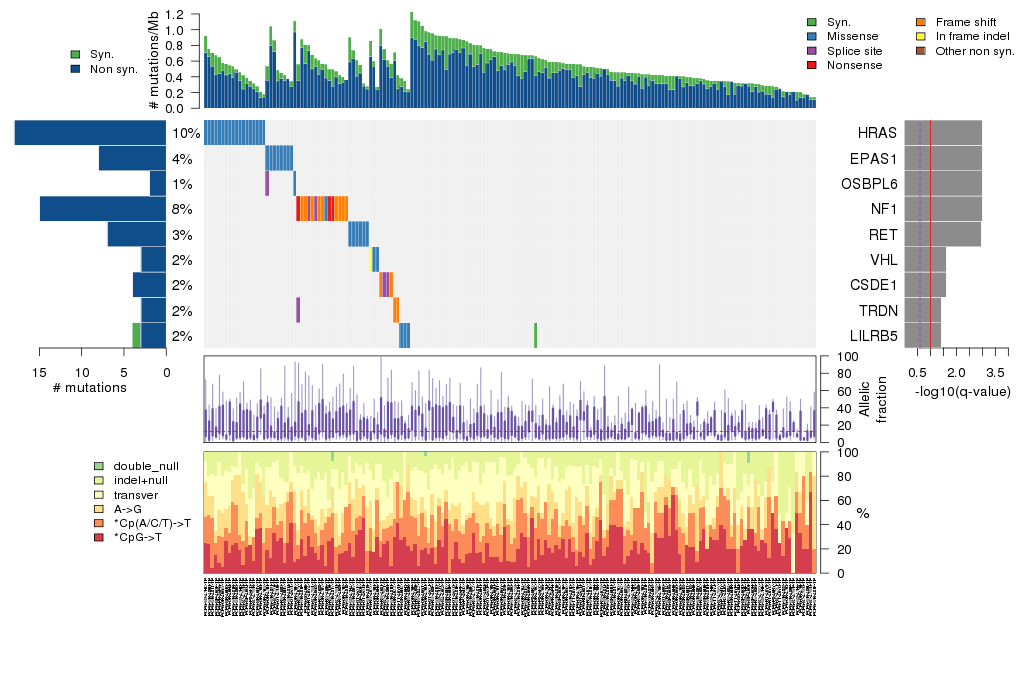
Figure 5. Get High-res Image The matrix in the center of the figure represents individual mutations in patient samples, color-coded by type of mutation, for the significantly mutated genes. The rate of synonymous and non-synonymous mutations is displayed at the top of the matrix. The barplot on the left of the matrix shows the number of mutations in each gene. The percentages represent the fraction of tumors with at least one mutation in the specified gene. The barplot to the right of the matrix displays the q-values for the most significantly mutated genes. The purple boxplots below the matrix (only displayed if required columns are present in the provided MAF) represent the distributions of allelic fractions observed in each sample. The plot at the bottom represents the base substitution distribution of individual samples, using the same categories that were used to calculate significance.
Column Descriptions:
-
N = number of sequenced bases in this gene across the individual set
-
n = number of (nonsilent) mutations in this gene across the individual set
-
npat = number of patients (individuals) with at least one nonsilent mutation
-
nsite = number of unique sites having a non-silent mutation
-
nsil = number of silent mutations in this gene across the individual set
-
n1 = number of nonsilent mutations of type: *CpG->T
-
n2 = number of nonsilent mutations of type: *Cp(A/C/T)->T
-
n3 = number of nonsilent mutations of type: A->G
-
n4 = number of nonsilent mutations of type: transver
-
n5 = number of nonsilent mutations of type: indel+null
-
n6 = number of nonsilent mutations of type: double_null
-
p_classic = p-value for the observed amount of nonsilent mutations being elevated in this gene
-
p_ns_s = p-value for the observed nonsilent/silent ratio being elevated in this gene
-
p_cons = p-value for enrichment of mutations at evolutionarily most-conserved sites in gene
-
p_joint = p-value for clustering + conservation
-
p = p-value (overall)
-
q = q-value, False Discovery Rate (Benjamini-Hochberg procedure)
Table 3. Get Full Table A Ranked List of Significantly Mutated Genes. Number of significant genes found: 9. Number of genes displayed: 35. Click on a gene name to display its stick figure depicting the distribution of mutations and mutation types across the chosen gene (this feature may not be available for all significant genes).
| rank | gene | description | N | n | npat | nsite | nsil | n1 | n2 | n3 | n4 | n5 | n6 | p_classic | p_ns_s | p_clust | p_cons | p_joint | p | q |
|---|---|---|---|---|---|---|---|---|---|---|---|---|---|---|---|---|---|---|---|---|
| 1 | HRAS | v-Ha-ras Harvey rat sarcoma viral oncogene homolog | 111290 | 18 | 18 | 3 | 0 | 0 | 0 | 13 | 5 | 0 | 0 | 1.3e-15 | 0.047 | 0 | 6e-05 | 0 | <1.00e-15 | <6.00e-12 |
| 2 | EPAS1 | endothelial PAS domain protein 1 | 439829 | 8 | 8 | 4 | 0 | 0 | 5 | 2 | 1 | 0 | 0 | 1.4e-11 | 0.027 | 0 | 0.00012 | 0 | <1.00e-15 | <6.00e-12 |
| 3 | OSBPL6 | oxysterol binding protein-like 6 | 534332 | 2 | 2 | 2 | 0 | 0 | 0 | 0 | 1 | 1 | 0 | 0.012 | 0.64 | 0.93 | 0 | 0 | <1.00e-15 | <6.00e-12 |
| 4 | NF1 | neurofibromin 1 (neurofibromatosis, von Recklinghausen disease, Watson disease) | 1534688 | 15 | 15 | 15 | 0 | 0 | 0 | 0 | 1 | 13 | 1 | 1.1e-14 | 0.29 | 0.24 | 0.46 | 0.43 | 1.57e-13 | 7.06e-10 |
| 5 | RET | ret proto-oncogene | 526097 | 7 | 6 | 4 | 0 | 0 | 0 | 5 | 2 | 0 | 0 | 3.5e-08 | 0.22 | 0.022 | 0.019 | 0.018 | 1.43e-08 | 5.17e-05 |
| 6 | VHL | von Hippel-Lindau tumor suppressor | 68676 | 3 | 3 | 3 | 0 | 1 | 0 | 0 | 1 | 1 | 0 | 1.6e-06 | 0.56 | 0.15 | 0.81 | 0.32 | 8.08e-06 | 0.0232 |
| 7 | CSDE1 | cold shock domain containing E1, RNA-binding | 438683 | 4 | 4 | 4 | 0 | 0 | 0 | 0 | 0 | 4 | 0 | 0.000037 | 0.58 | 0.0096 | 0.23 | 0.016 | 9.00e-06 | 0.0232 |
| 8 | TRDN | triadin | 173170 | 3 | 3 | 2 | 0 | 0 | 0 | 0 | 0 | 3 | 0 | 0.000016 | 1 | NaN | NaN | NaN | 1.57e-05 | 0.0352 |
| 9 | LILRB5 | leukocyte immunoglobulin-like receptor, subfamily B (with TM and ITIM domains), member 5 | 305151 | 3 | 3 | 2 | 1 | 0 | 0 | 2 | 1 | 0 | 0 | 0.000018 | 0.77 | NaN | NaN | NaN | 1.79e-05 | 0.0359 |
| 10 | NDUFAF2 | NADH dehydrogenase (ubiquinone) 1 alpha subcomplex, assembly factor 2 | 80976 | 2 | 2 | 1 | 0 | 2 | 0 | 0 | 0 | 0 | 0 | 8e-05 | 0.44 | NaN | NaN | NaN | 7.95e-05 | 0.143 |
| 11 | GPR128 | G protein-coupled receptor 128 | 437162 | 4 | 4 | 4 | 0 | 1 | 1 | 0 | 2 | 0 | 0 | 7.8e-06 | 0.32 | 1 | 0.94 | 1 | 9.91e-05 | 0.162 |
| 12 | GYPE | glycophorin E | 37271 | 1 | 2 | 1 | 0 | 1 | 0 | 0 | 0 | 0 | 0 | 0.00014 | 0.79 | NaN | NaN | NaN | 0.000138 | 0.208 |
| 13 | SOX4 | SRY (sex determining region Y)-box 4 | 61381 | 2 | 2 | 2 | 0 | 0 | 0 | 0 | 0 | 2 | 0 | 0.000039 | 1 | 0.4 | 0.56 | 0.7 | 0.000318 | 0.441 |
| 14 | C20orf85 | chromosome 20 open reading frame 85 | 63825 | 1 | 1 | 1 | 0 | 0 | 0 | 1 | 0 | 0 | 0 | 0.00058 | 0.74 | NaN | NaN | NaN | 0.000585 | 0.713 |
| 15 | ABCA13 | ATP-binding cassette, sub-family A (ABC1), member 13 | 2329219 | 6 | 6 | 6 | 0 | 1 | 3 | 0 | 2 | 0 | 0 | 0.000072 | 0.12 | 0.57 | 0.87 | 0.81 | 0.000630 | 0.713 |
| 16 | FAM83D | family with sequence similarity 83, member D | 258458 | 3 | 3 | 3 | 0 | 1 | 0 | 0 | 1 | 1 | 0 | 0.000059 | 0.53 | 0.63 | 0.64 | 1 | 0.000633 | 0.713 |
| 17 | NRL | neural retina leucine zipper | 68101 | 1 | 1 | 1 | 0 | 0 | 0 | 1 | 0 | 0 | 0 | 0.00072 | 0.7 | NaN | NaN | NaN | 0.000716 | 0.758 |
| 18 | MGST1 | microsomal glutathione S-transferase 1 | 85434 | 1 | 1 | 1 | 0 | 1 | 0 | 0 | 0 | 0 | 0 | 0.00078 | 0.83 | NaN | NaN | NaN | 0.000781 | 0.781 |
| 19 | MDK | midkine (neurite growth-promoting factor 2) | 51803 | 1 | 1 | 1 | 0 | 0 | 0 | 0 | 1 | 0 | 0 | 0.00084 | 0.84 | NaN | NaN | NaN | 0.000838 | 0.794 |
| 20 | IFNA7 | interferon, alpha 7 | 102172 | 1 | 1 | 1 | 0 | 1 | 0 | 0 | 0 | 0 | 0 | 0.001 | 0.83 | NaN | NaN | NaN | 0.00101 | 0.840 |
| 21 | KCNH5 | potassium voltage-gated channel, subfamily H (eag-related), member 5 | 538181 | 3 | 3 | 3 | 1 | 1 | 1 | 0 | 0 | 1 | 0 | 0.00012 | 0.56 | 0.79 | 0.94 | 0.86 | 0.00104 | 0.840 |
| 22 | PRMT1 | protein arginine methyltransferase 1 | 181624 | 2 | 2 | 2 | 0 | 0 | 0 | 0 | 1 | 1 | 0 | 0.0027 | 0.72 | 0.8 | 0.02 | 0.038 | 0.00104 | 0.840 |
| 23 | HNRNPM | heterogeneous nuclear ribonucleoprotein M | 379271 | 3 | 3 | 3 | 0 | 1 | 1 | 0 | 0 | 1 | 0 | 0.00055 | 0.34 | 0.24 | 0.049 | 0.2 | 0.00113 | 0.840 |
| 24 | ATP6V1G3 | ATPase, H+ transporting, lysosomal 13kDa, V1 subunit G3 | 74565 | 2 | 2 | 2 | 0 | 0 | 0 | 1 | 1 | 0 | 0 | 0.00043 | 0.69 | 0.28 | 0.22 | 0.3 | 0.00130 | 0.840 |
| 25 | AMMECR1 | Alport syndrome, mental retardation, midface hypoplasia and elliptocytosis chromosomal region, gene 1 | 113432 | 2 | 2 | 1 | 0 | 0 | 0 | 0 | 0 | 2 | 0 | 0.0004 | 1 | 0.015 | 1 | 0.33 | 0.00130 | 0.840 |
| 26 | MAP3K4 | mitogen-activated protein kinase kinase kinase 4 | 847011 | 3 | 3 | 2 | 0 | 0 | 2 | 1 | 0 | 0 | 0 | 0.002 | 0.3 | 0.048 | 0.88 | 0.065 | 0.00131 | 0.840 |
| 27 | AQP7 | aquaporin 7 | 166783 | 2 | 2 | 2 | 0 | 0 | 1 | 1 | 0 | 0 | 0 | 0.0013 | 0.46 | NaN | NaN | NaN | 0.00131 | 0.840 |
| 28 | ATRX | alpha thalassemia/mental retardation syndrome X-linked (RAD54 homolog, S. cerevisiae) | 1350672 | 5 | 5 | 5 | 0 | 0 | 1 | 0 | 1 | 3 | 0 | 0.0002 | 0.64 | 0.69 | 0.34 | 0.68 | 0.00132 | 0.840 |
| 29 | C2orf73 | chromosome 2 open reading frame 73 | 54439 | 1 | 1 | 1 | 0 | 0 | 1 | 0 | 0 | 0 | 0 | 0.0014 | 0.72 | NaN | NaN | NaN | 0.00135 | 0.840 |
| 30 | SHC1 | SHC (Src homology 2 domain containing) transforming protein 1 | 316427 | 2 | 2 | 2 | 0 | 1 | 0 | 0 | 1 | 0 | 0 | 0.0054 | 0.57 | 0.66 | 0.018 | 0.029 | 0.00151 | 0.873 |
| 31 | NKX6-3 | NK6 homeobox 3 | 22281 | 1 | 1 | 1 | 0 | 0 | 0 | 0 | 0 | 1 | 0 | 0.0016 | 1 | NaN | NaN | NaN | 0.00155 | 0.873 |
| 32 | TSPAN13 | tetraspanin 13 | 112695 | 1 | 1 | 1 | 0 | 0 | 1 | 0 | 0 | 0 | 0 | 0.0017 | 0.62 | NaN | NaN | NaN | 0.00173 | 0.873 |
| 33 | PTPRCAP | protein tyrosine phosphatase, receptor type, C-associated protein | 55531 | 1 | 1 | 1 | 0 | 0 | 0 | 0 | 0 | 1 | 0 | 0.0018 | 1 | NaN | NaN | NaN | 0.00175 | 0.873 |
| 34 | CARD18 | caspase recruitment domain family, member 18 | 49299 | 1 | 1 | 1 | 0 | 1 | 0 | 0 | 0 | 0 | 0 | 0.0018 | 1 | NaN | NaN | NaN | 0.00175 | 0.873 |
| 35 | MACROD1 | MACRO domain containing 1 | 55659 | 1 | 1 | 1 | 0 | 0 | 0 | 1 | 0 | 0 | 0 | 0.0018 | 0.89 | NaN | NaN | NaN | 0.00179 | 0.873 |
Figure S1. This figure depicts the distribution of mutations and mutation types across the HRAS significant gene.
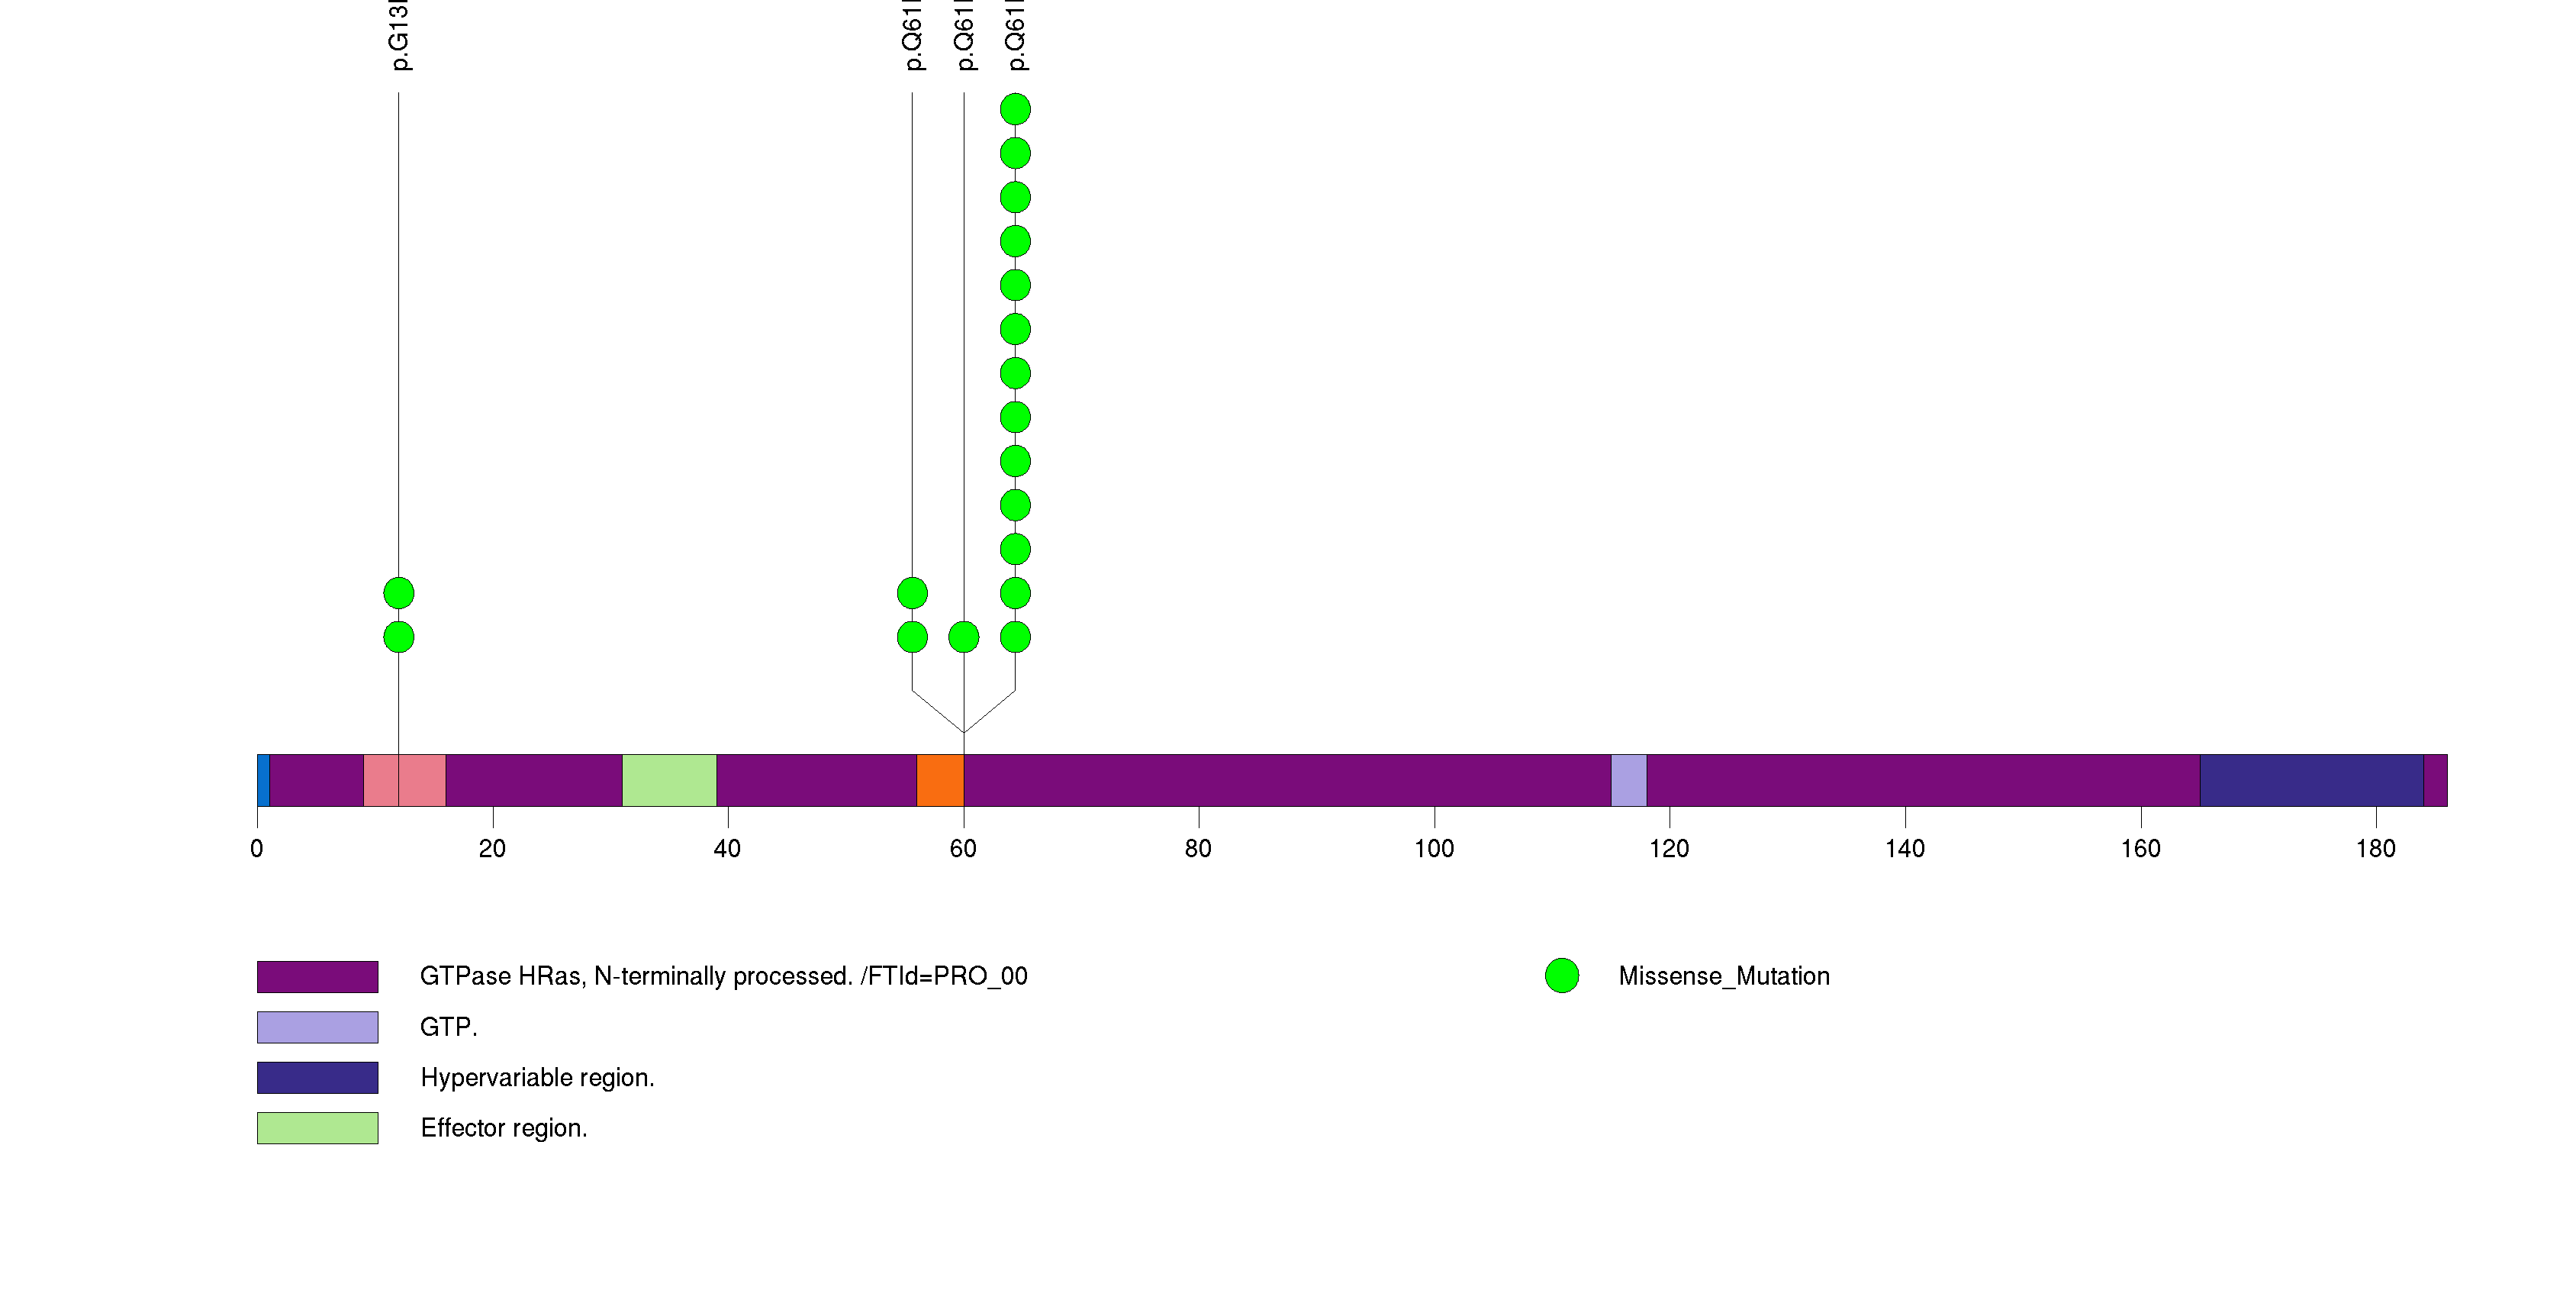
Figure S2. This figure depicts the distribution of mutations and mutation types across the EPAS1 significant gene.
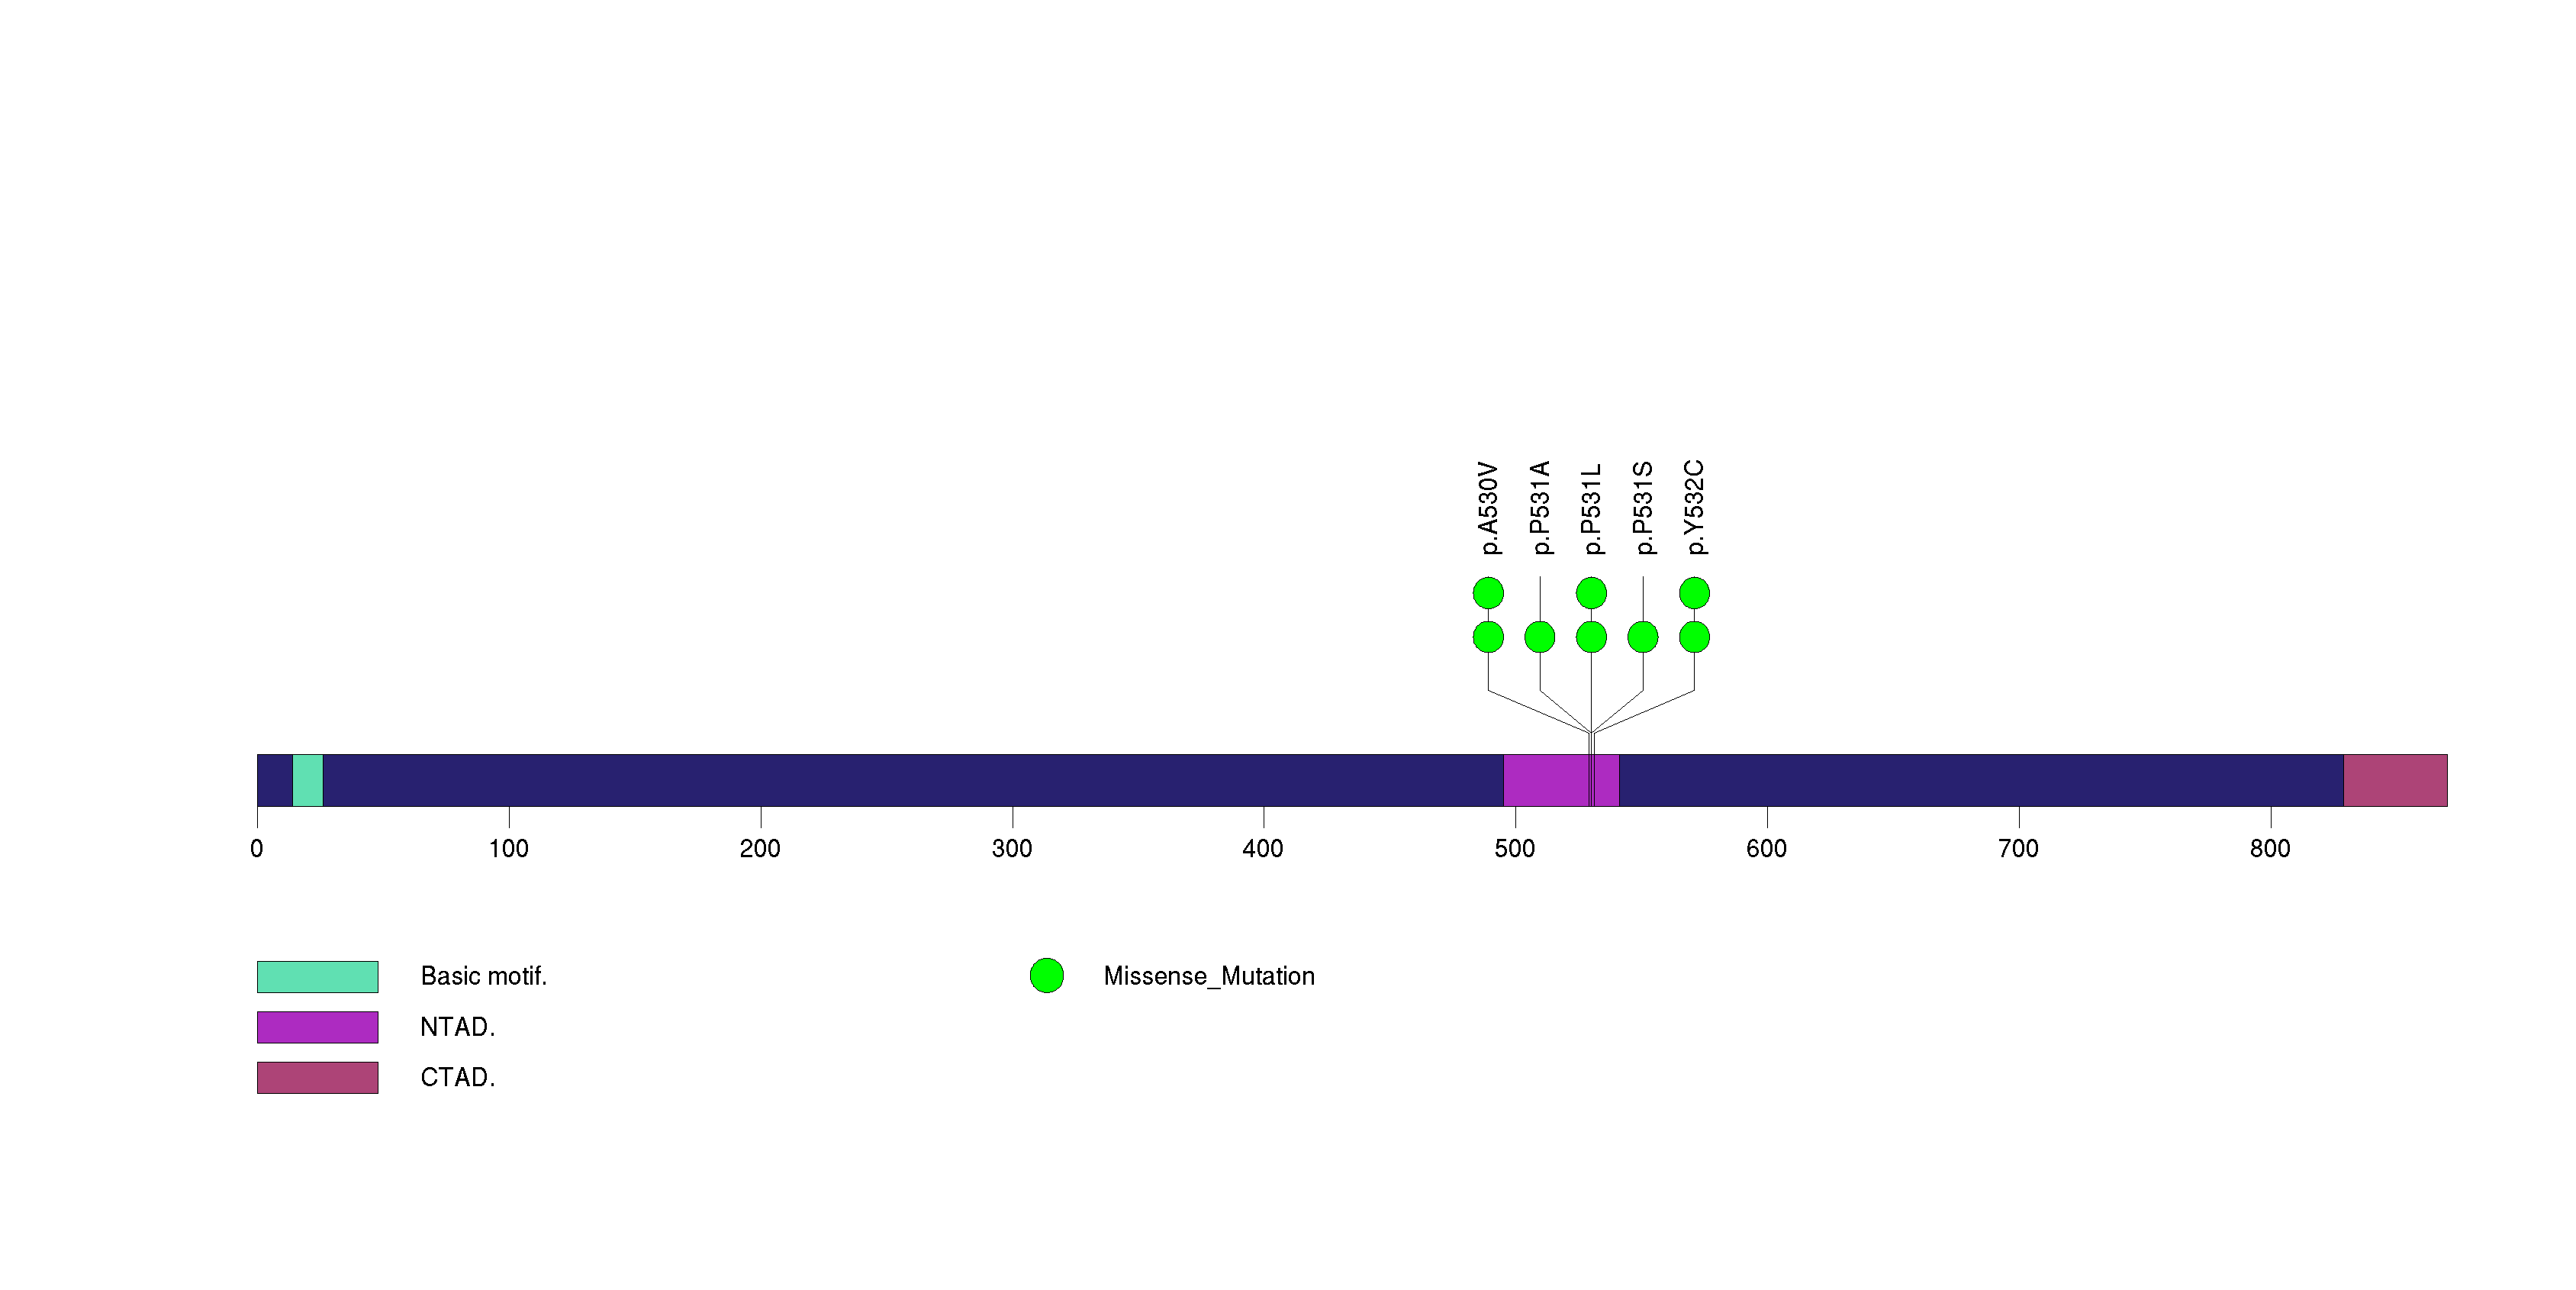
Figure S3. This figure depicts the distribution of mutations and mutation types across the OSBPL6 significant gene.
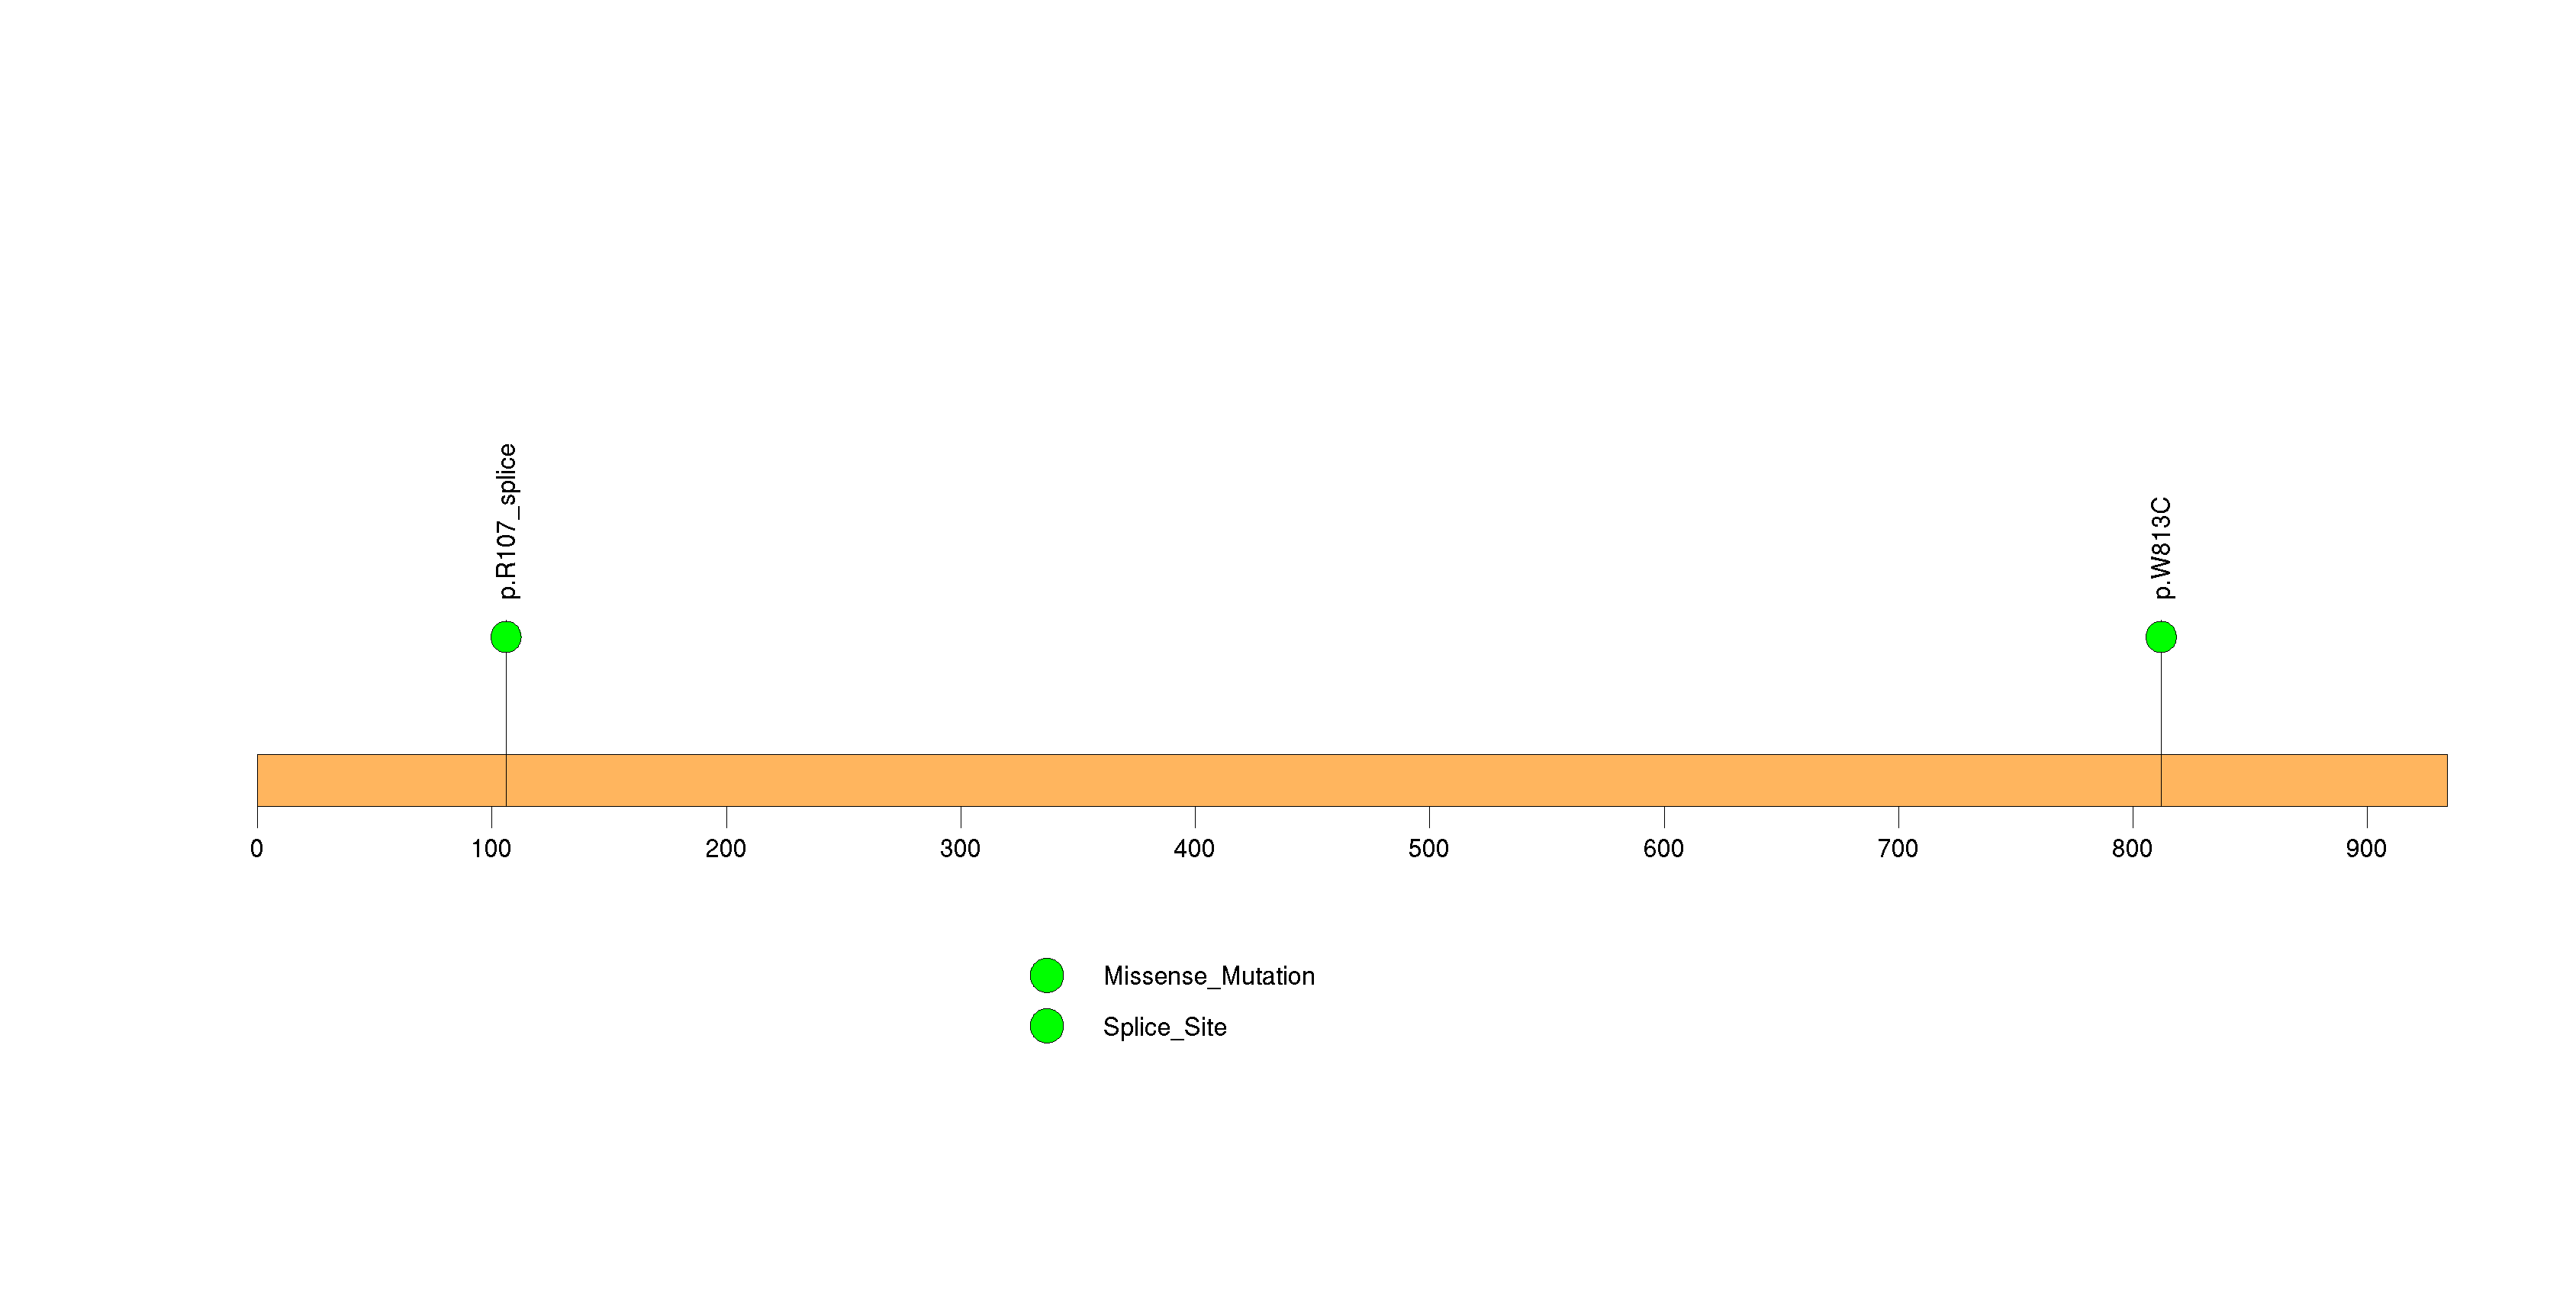
Figure S4. This figure depicts the distribution of mutations and mutation types across the NF1 significant gene.
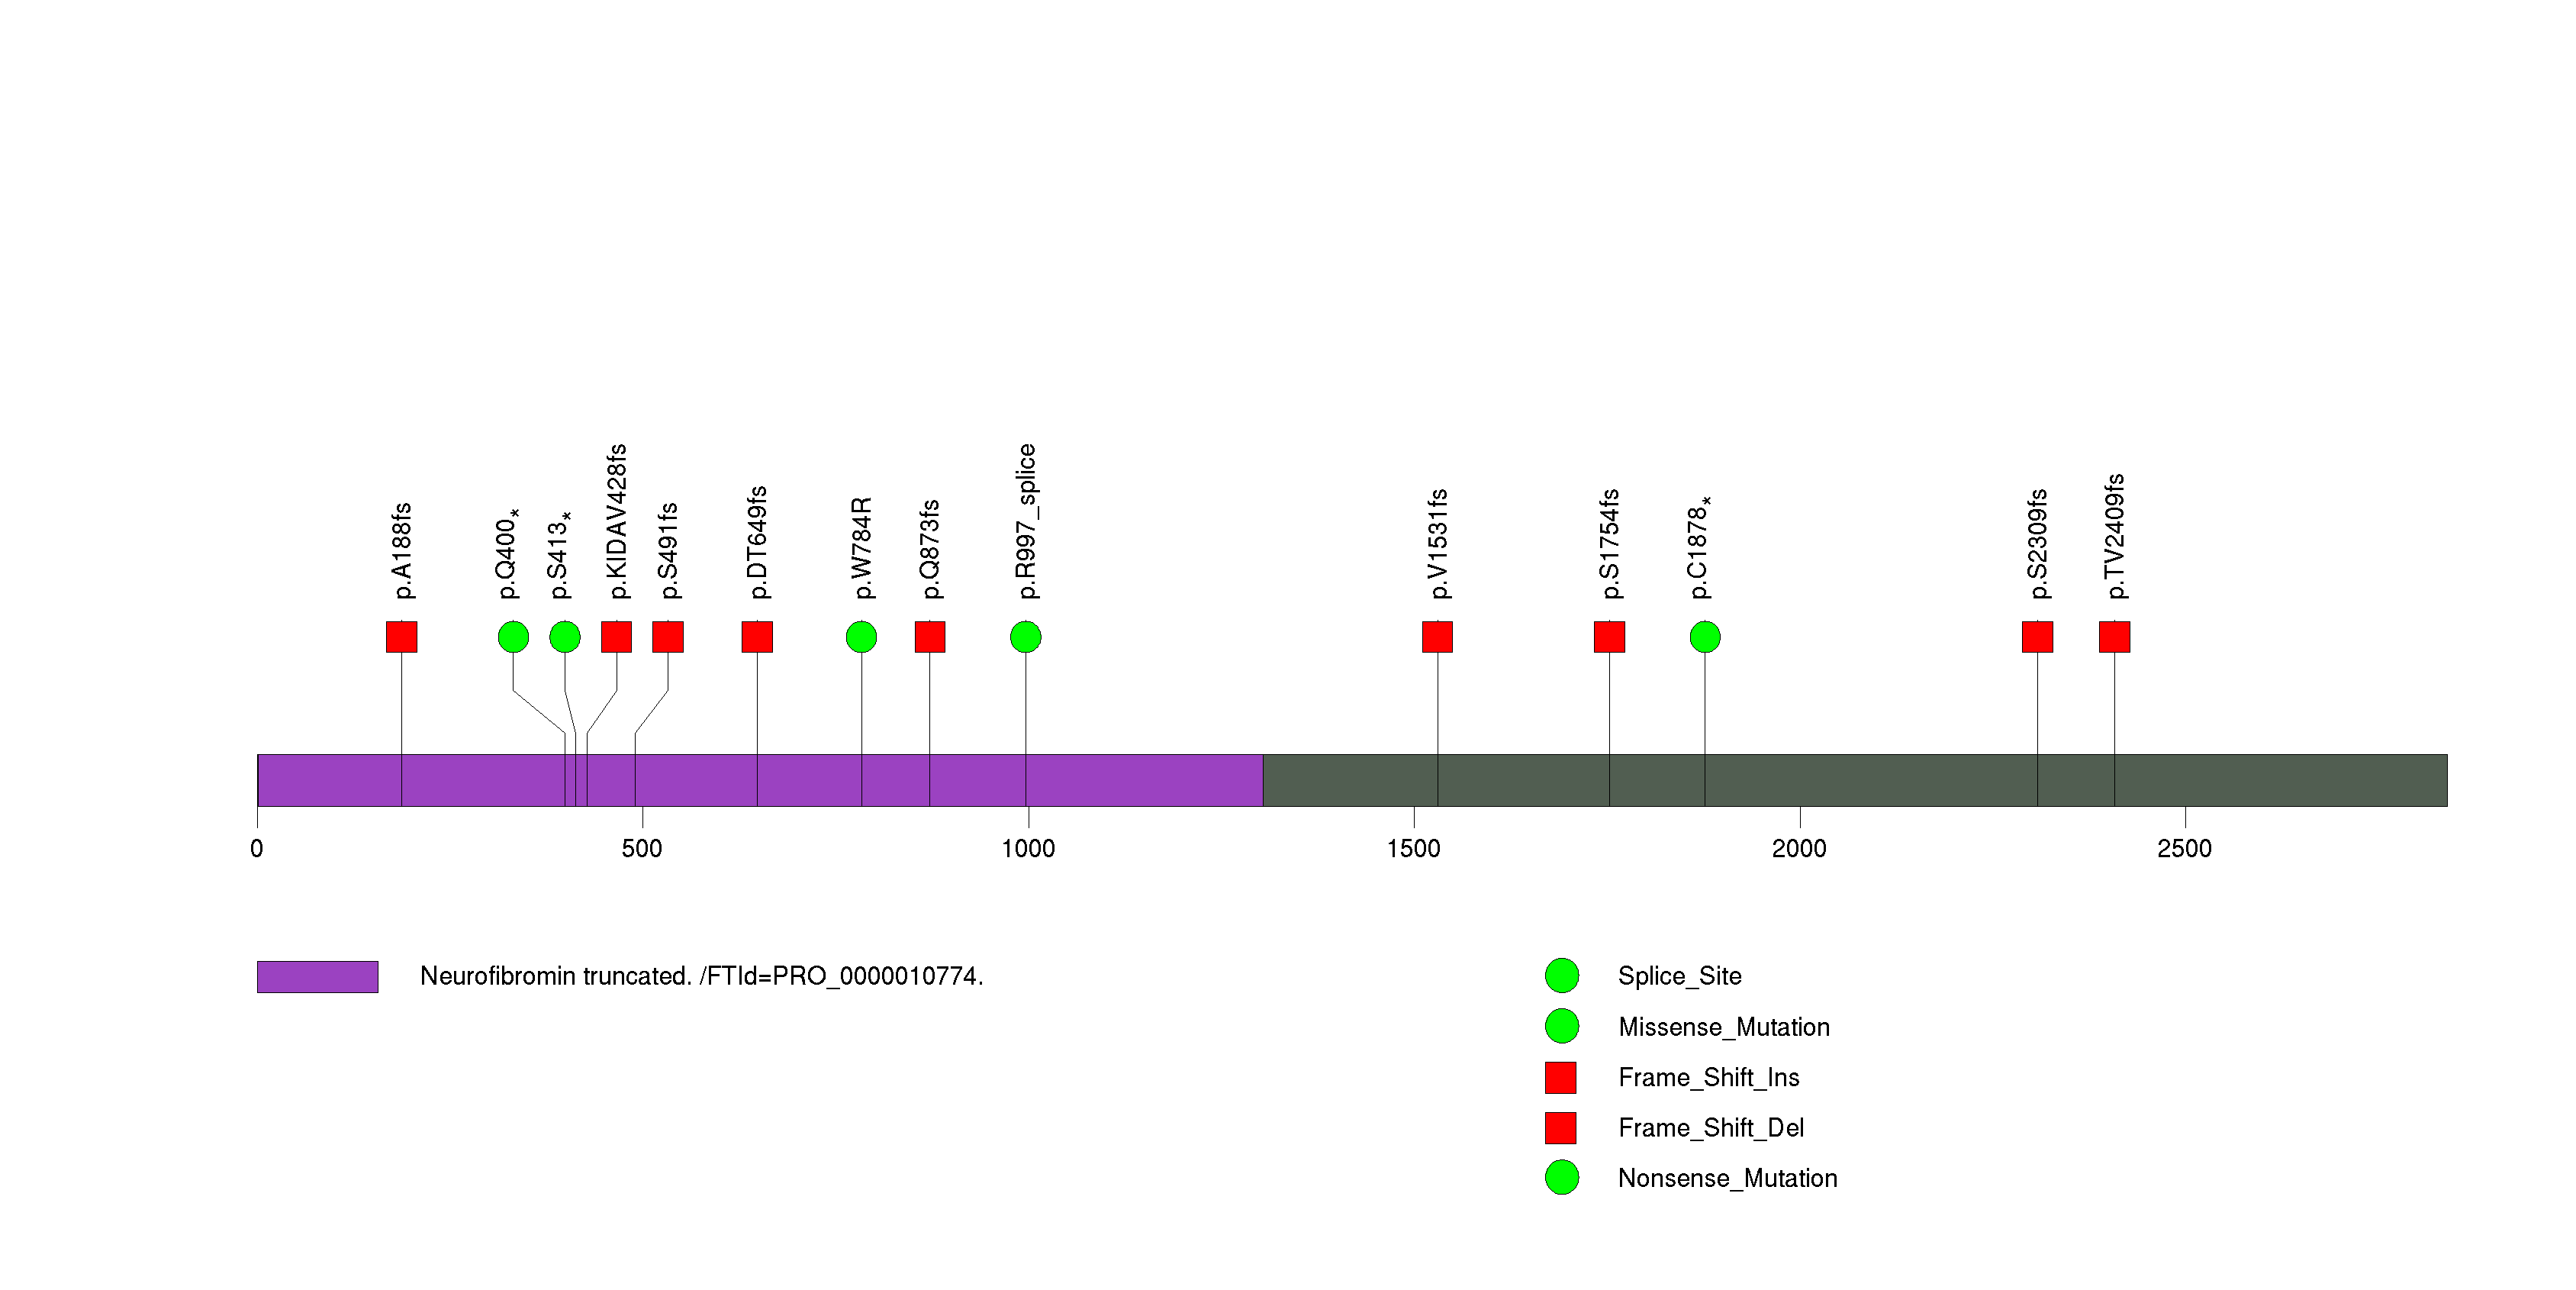
Figure S5. This figure depicts the distribution of mutations and mutation types across the RET significant gene.
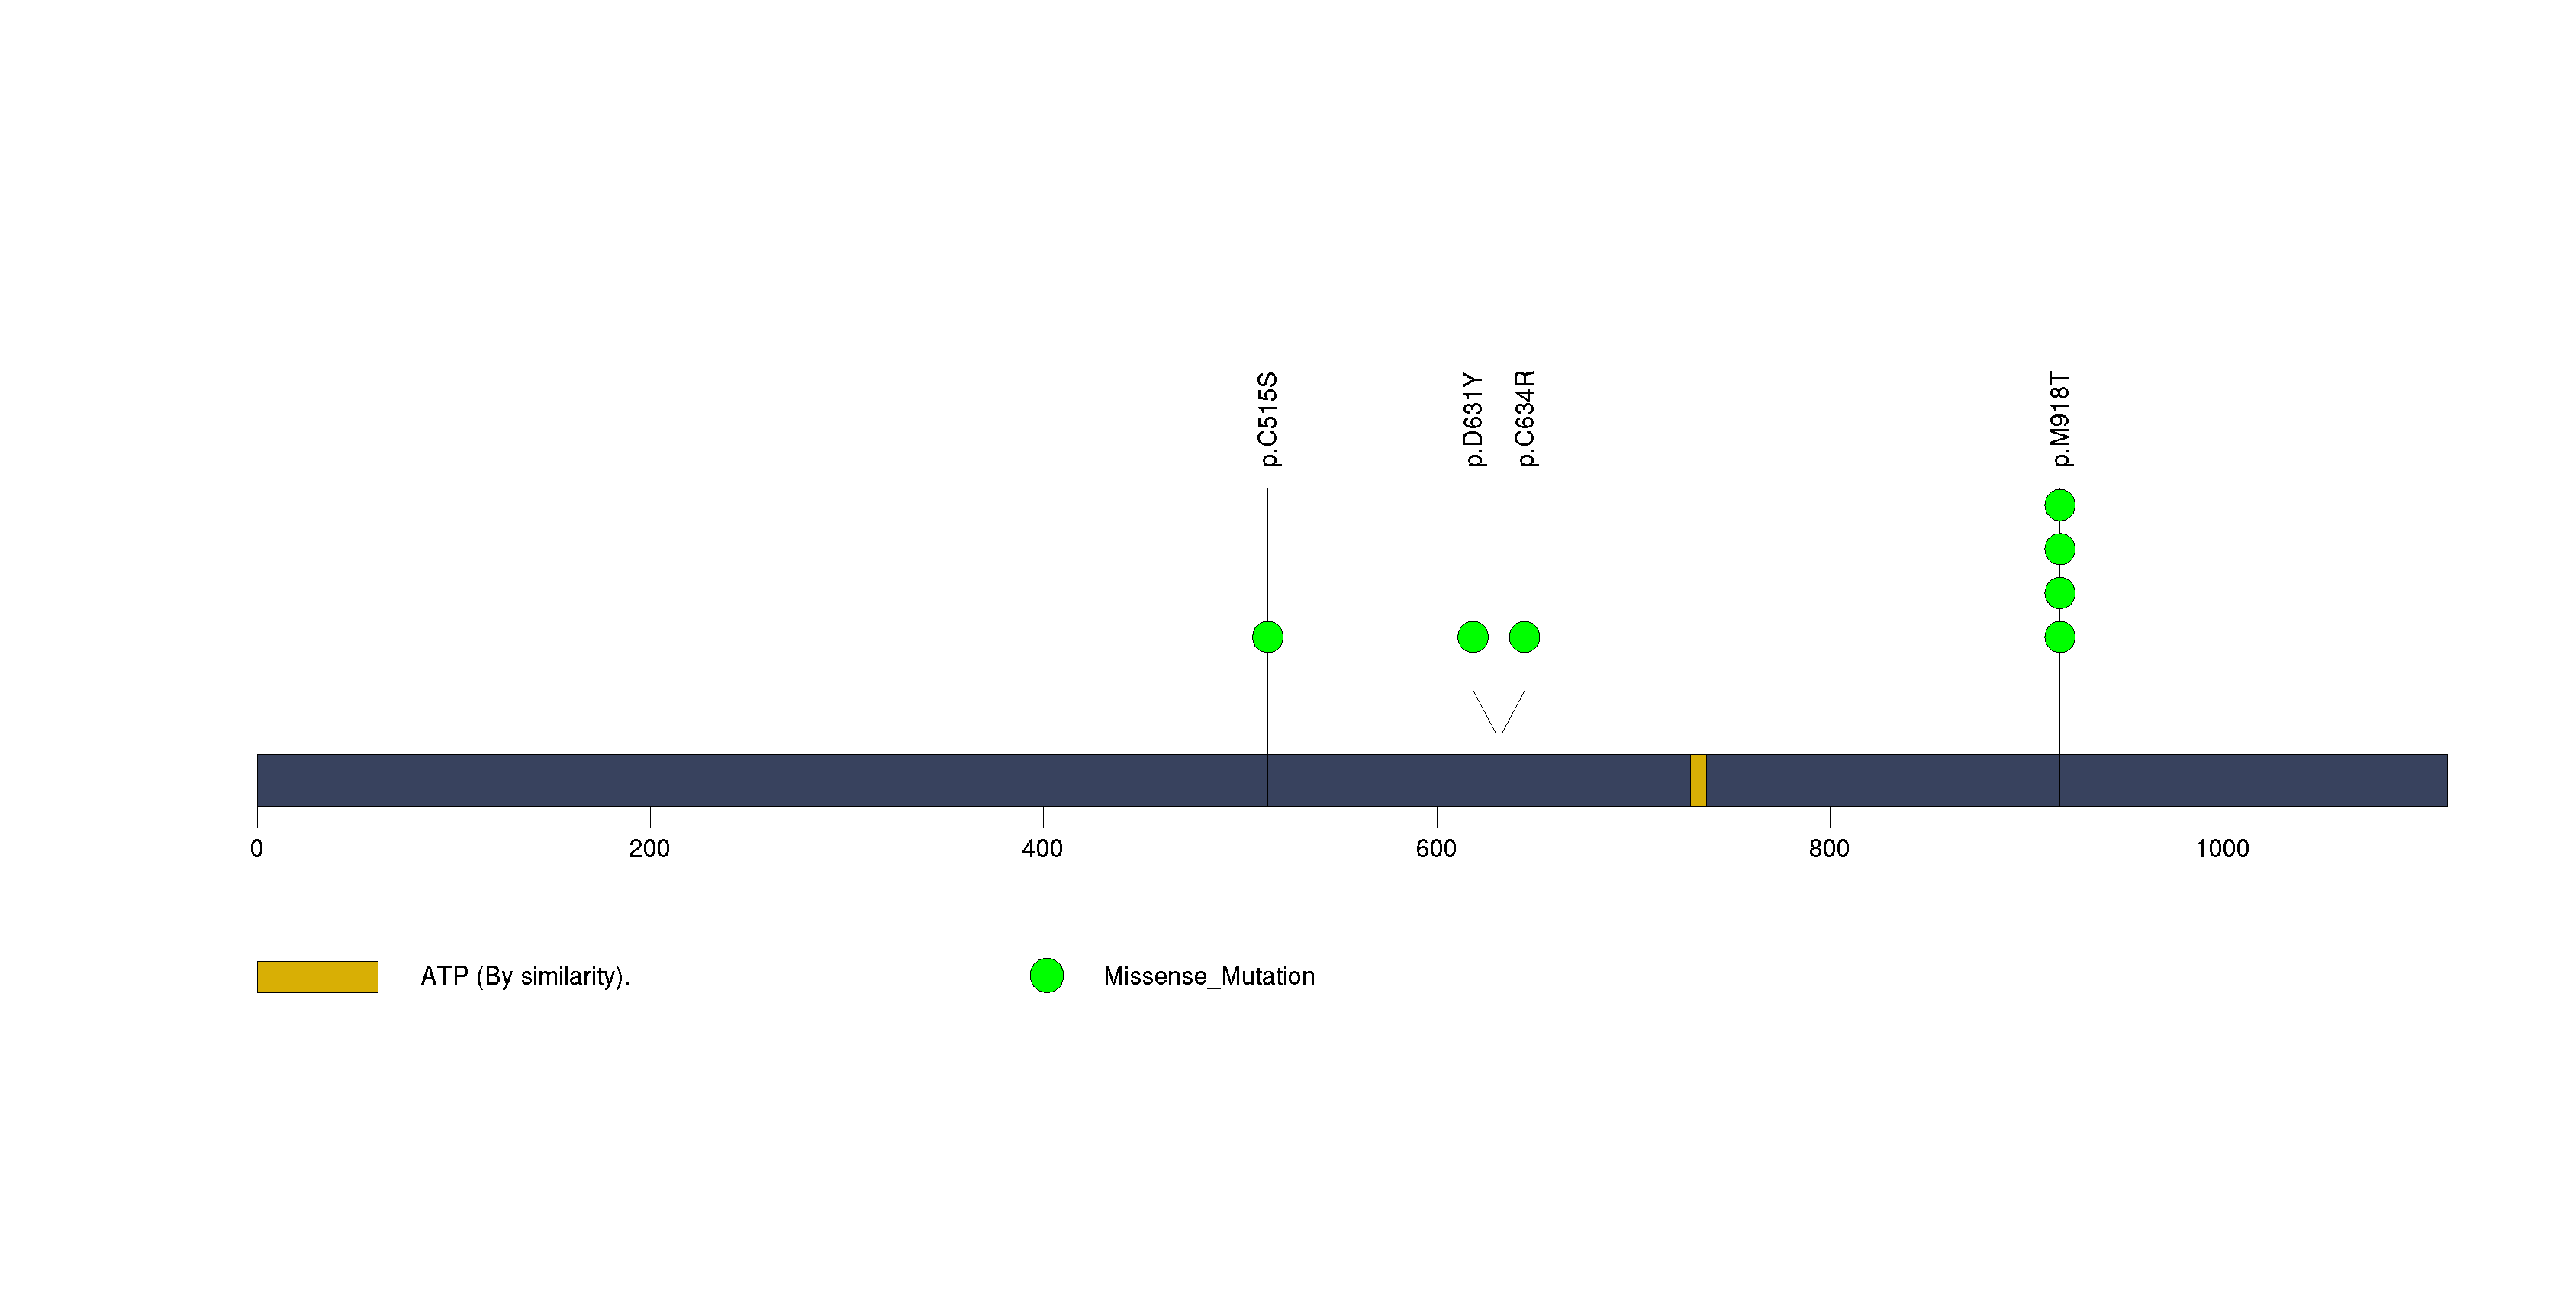
Figure S6. This figure depicts the distribution of mutations and mutation types across the VHL significant gene.
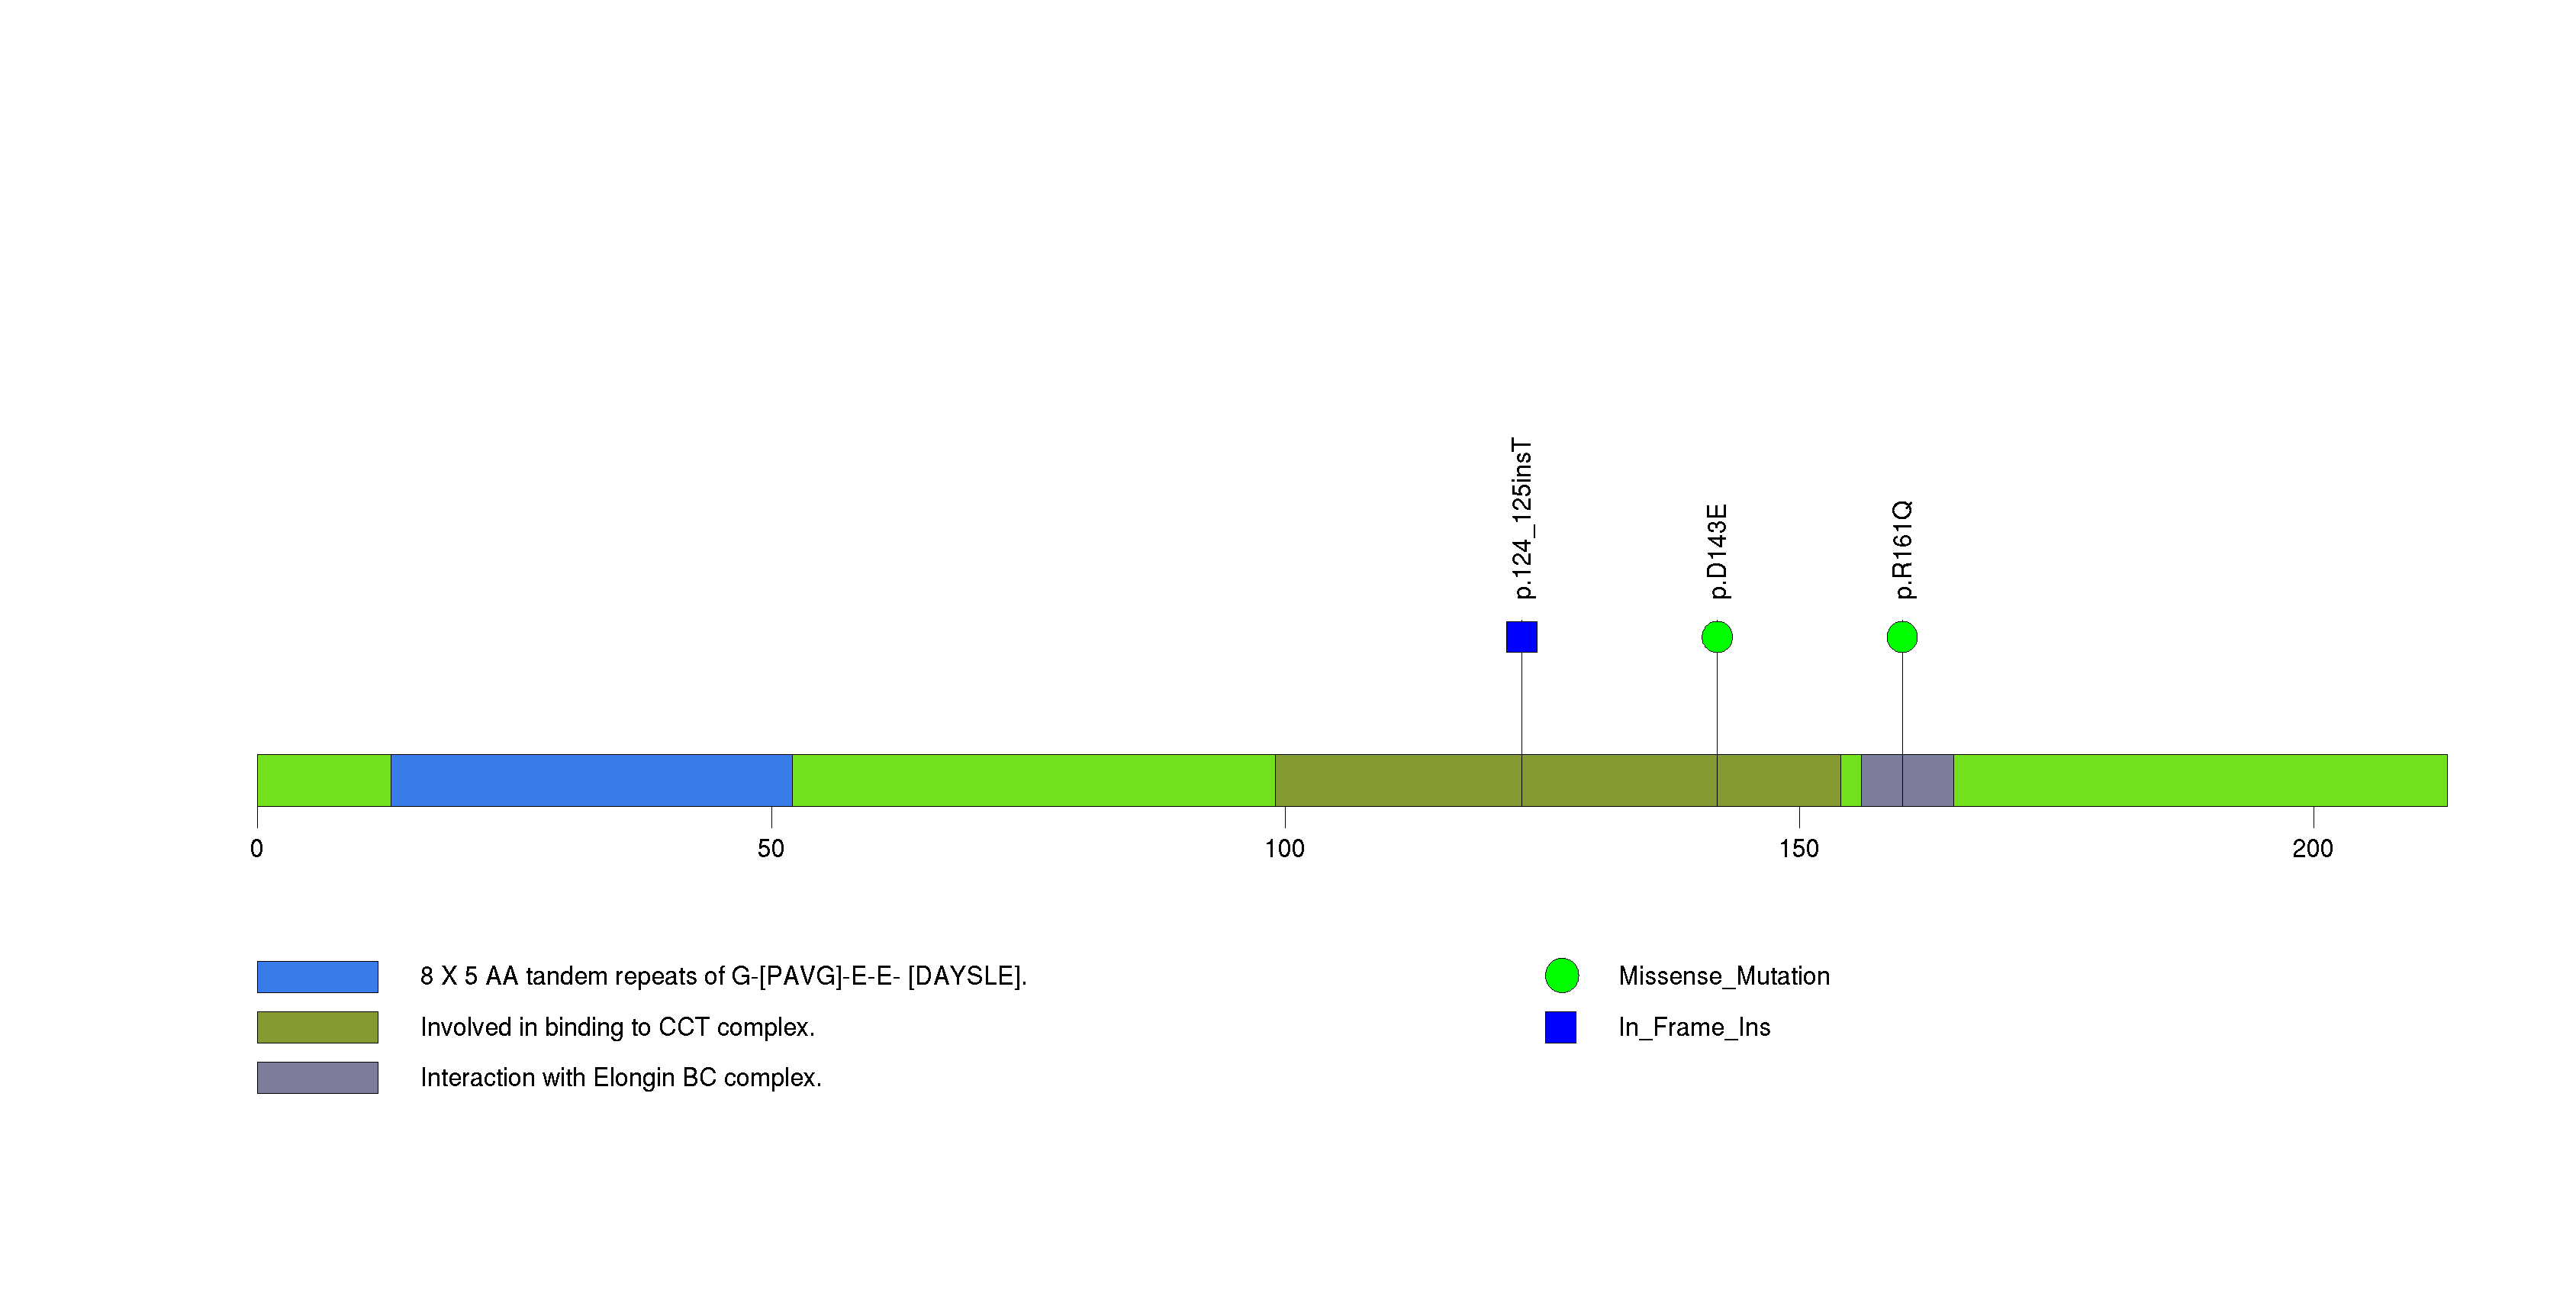
Figure S7. This figure depicts the distribution of mutations and mutation types across the CSDE1 significant gene.
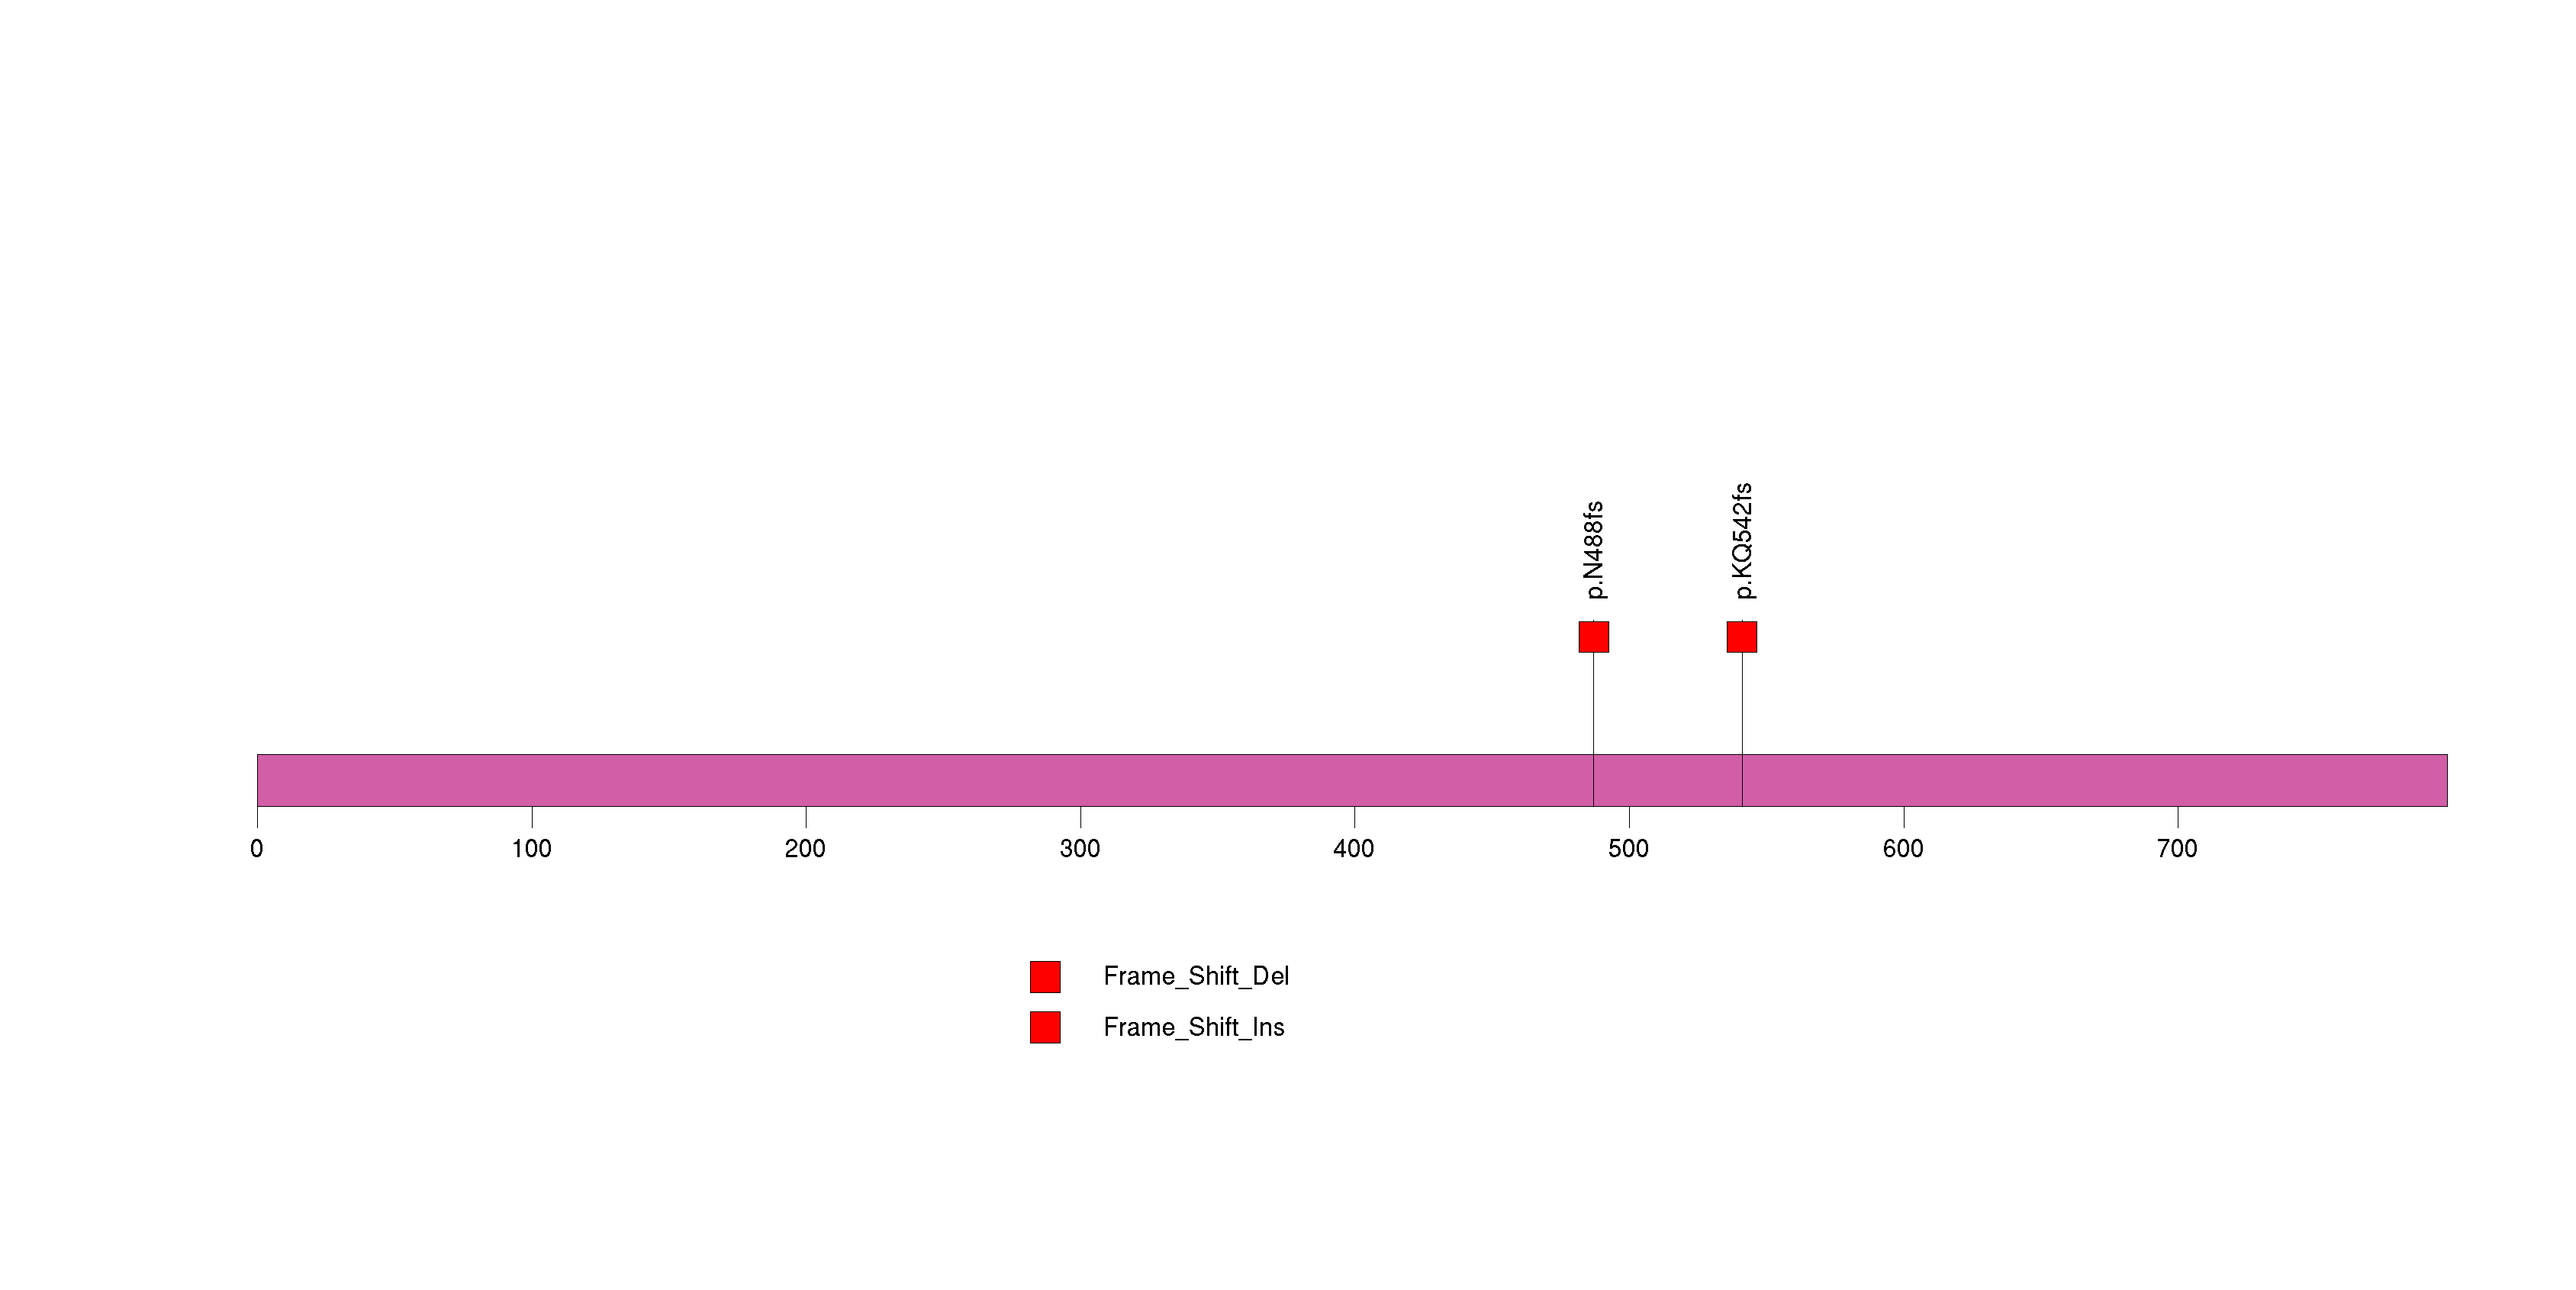
Figure S8. This figure depicts the distribution of mutations and mutation types across the TRDN significant gene.
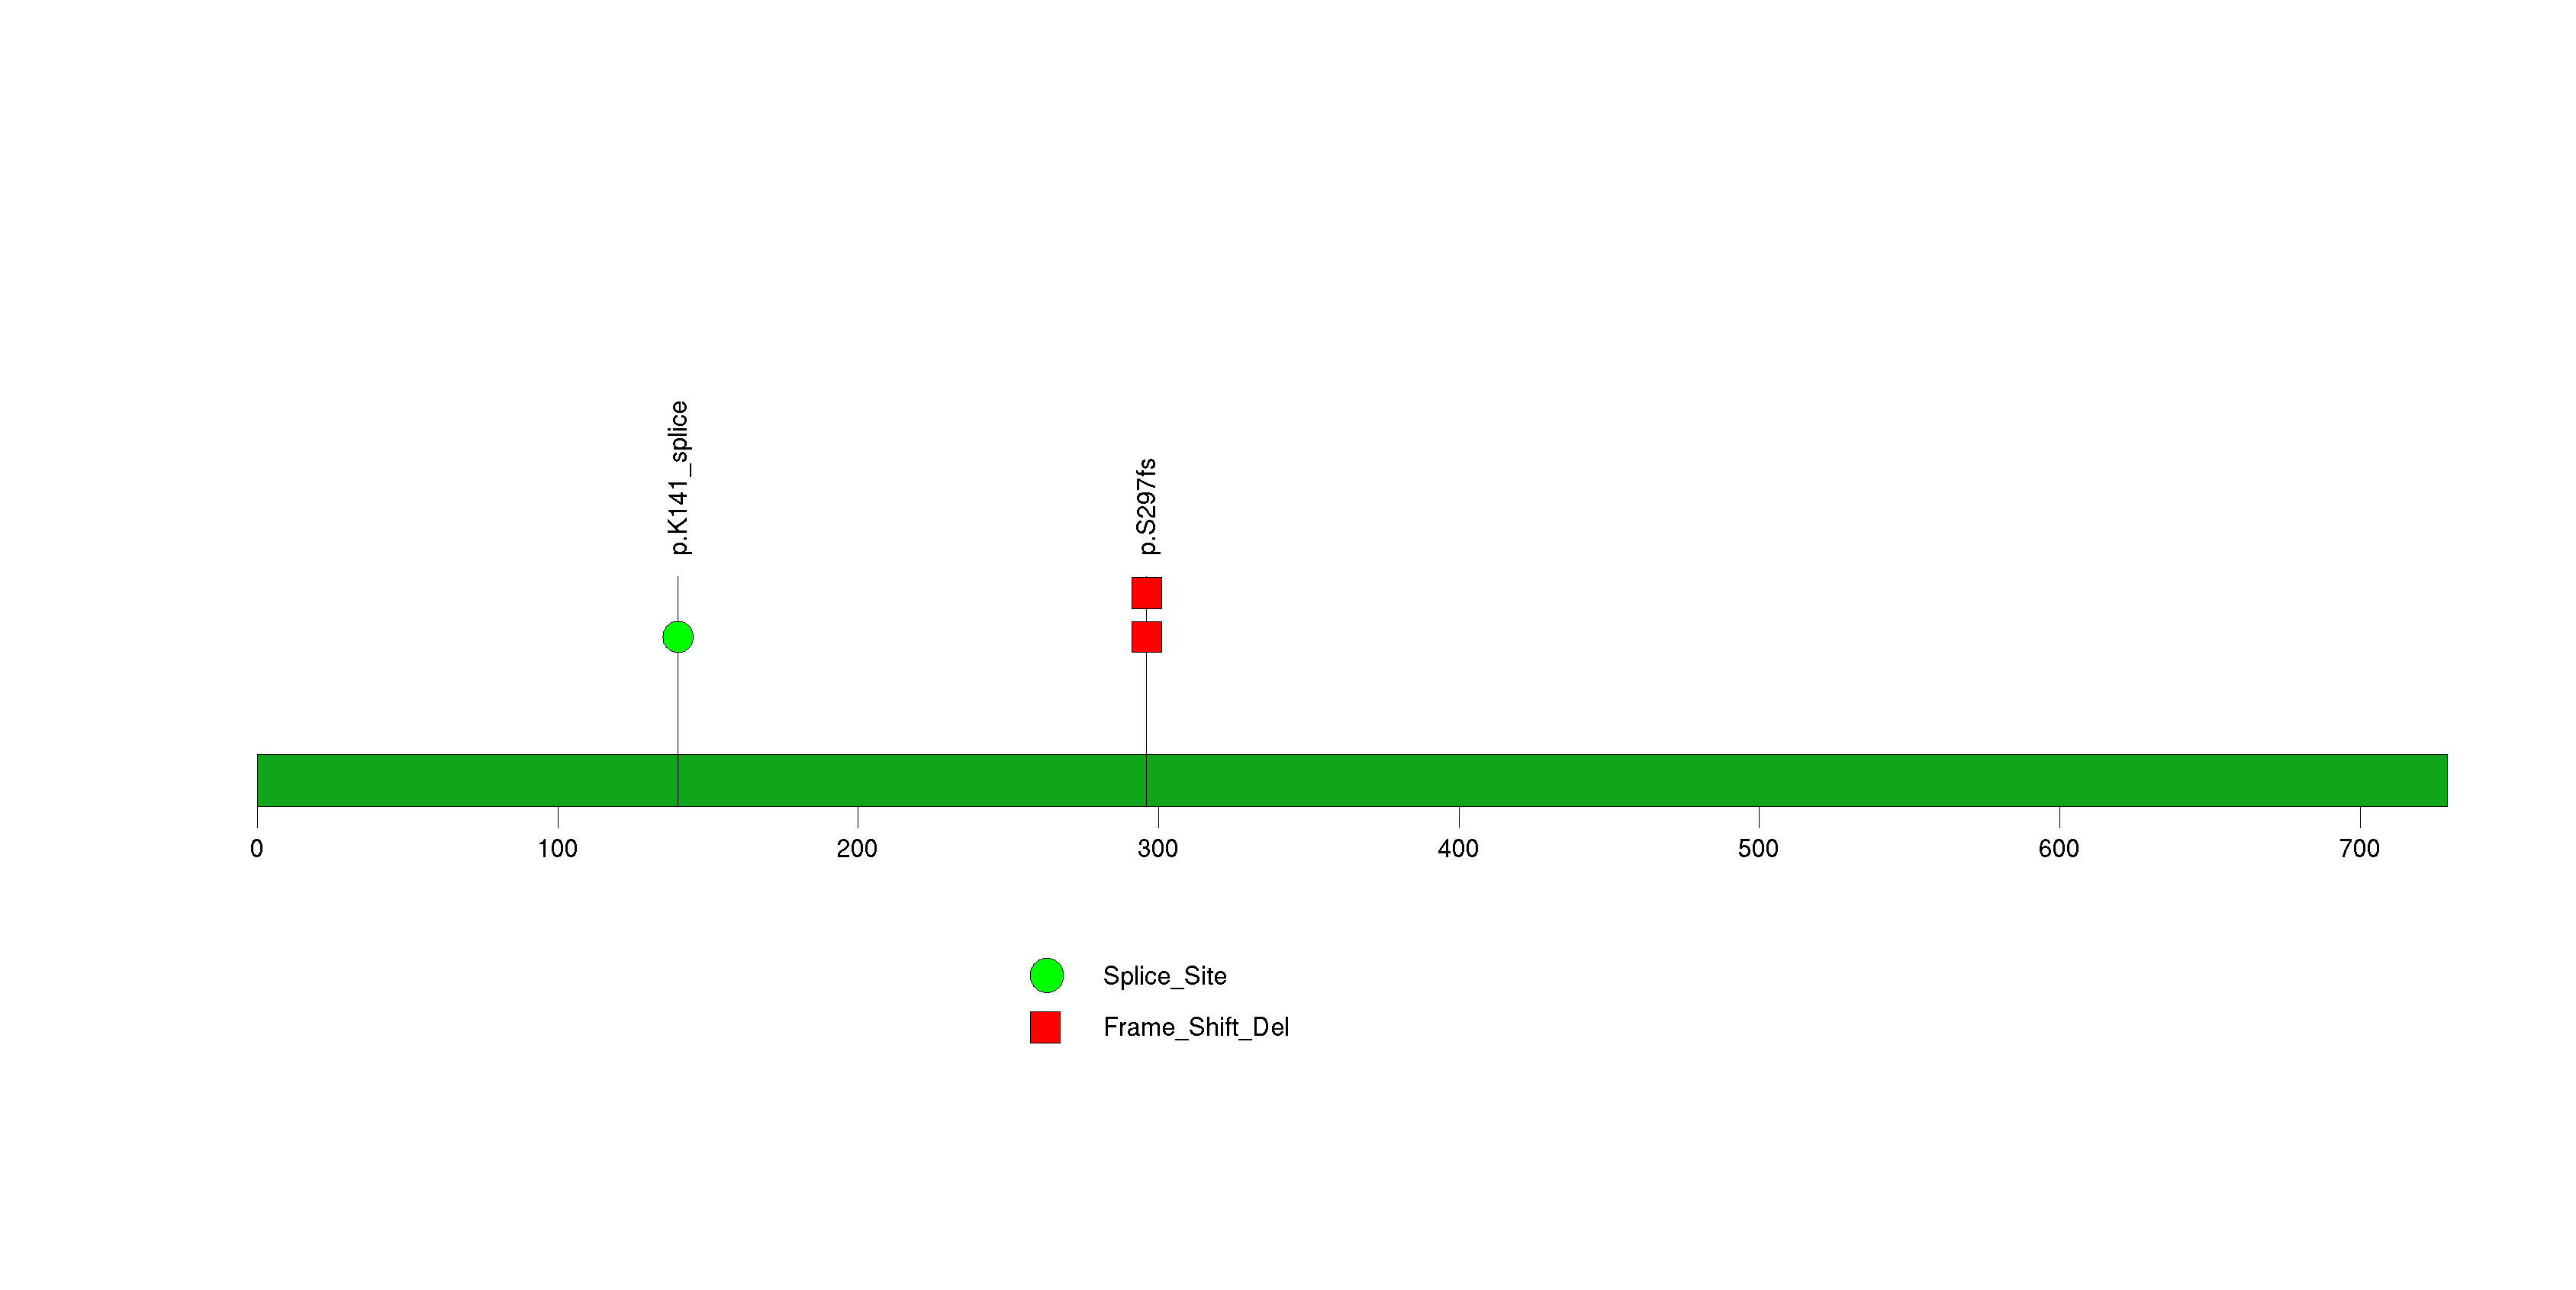
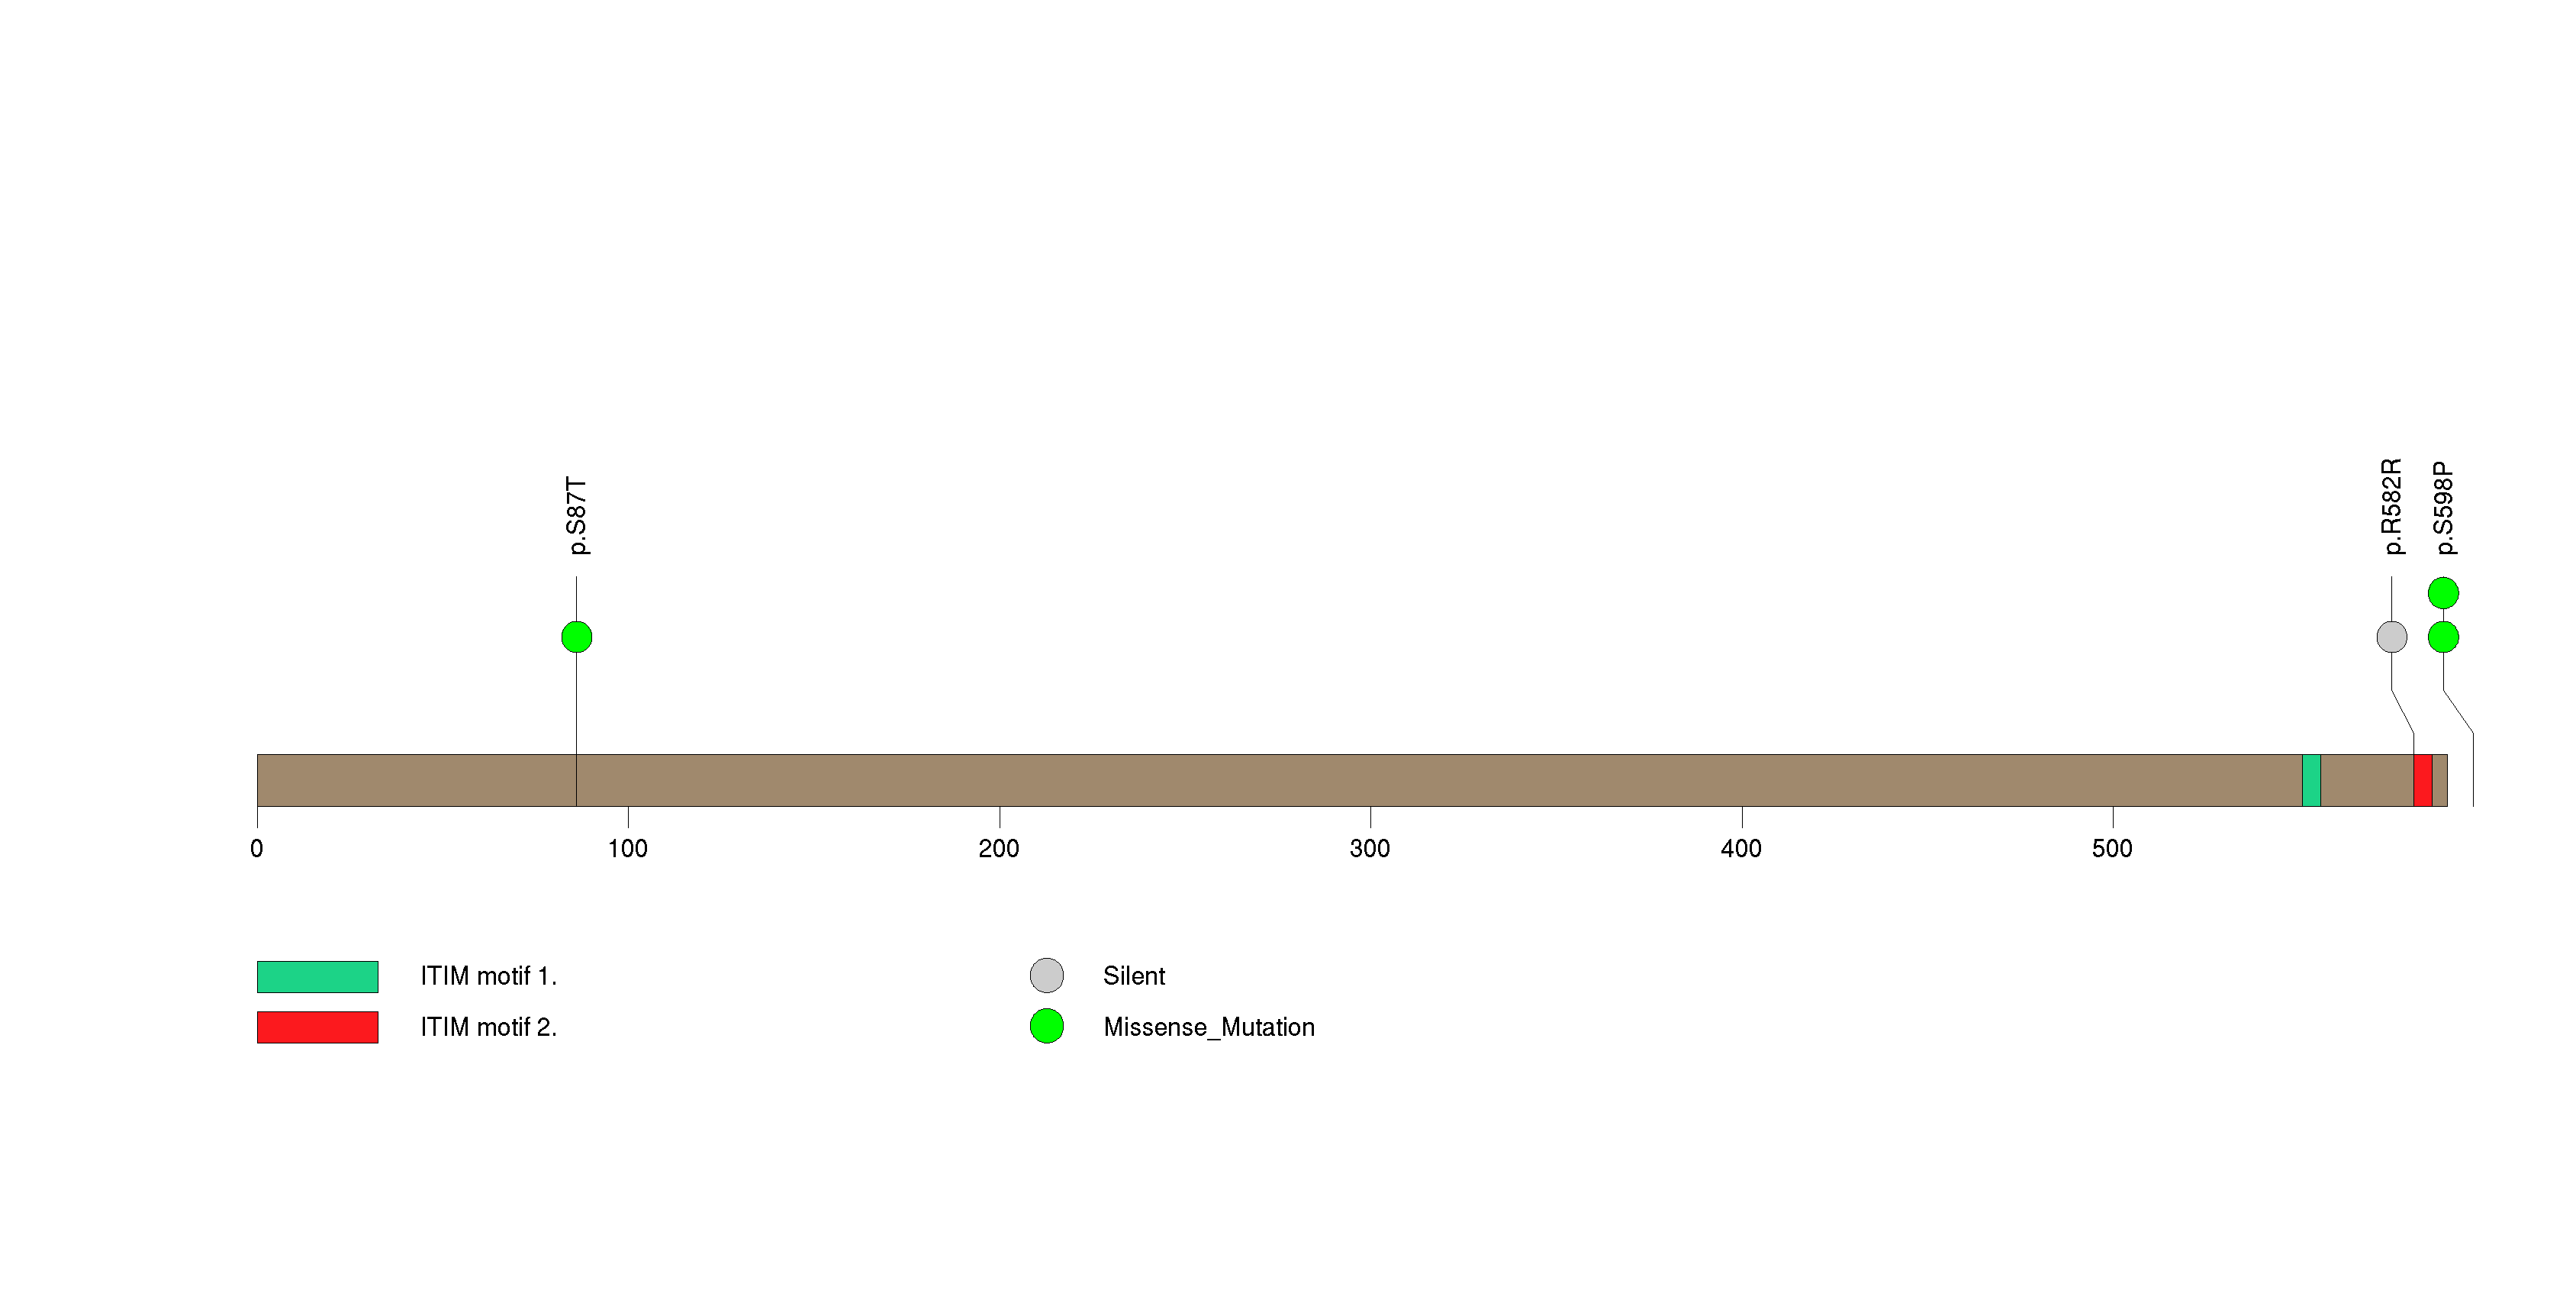
Figure S9. This figure depicts the distribution of mutations and mutation types across the LILRB5 significant gene.
In this analysis, COSMIC is used as a filter to increase power by restricting the territory of each gene. Cosmic version: v48.
Table 4. Get Full Table Significantly mutated genes (COSMIC territory only). To access the database please go to: COSMIC. Number of significant genes found: 4. Number of genes displayed: 10
| rank | gene | description | n | cos | n_cos | N_cos | cos_ev | p | q |
|---|---|---|---|---|---|---|---|---|---|
| 1 | HRAS | v-Ha-ras Harvey rat sarcoma viral oncogene homolog | 18 | 19 | 18 | 3382 | 3990 | 0 | 0 |
| 2 | RET | ret proto-oncogene | 7 | 49 | 6 | 8722 | 968 | 0 | 0 |
| 3 | FGFR1 | fibroblast growth factor receptor 1 (fms-related tyrosine kinase 2, Pfeiffer syndrome) | 2 | 10 | 2 | 1780 | 2 | 3.3e-07 | 0.00049 |
| 4 | VHL | von Hippel-Lindau tumor suppressor | 3 | 541 | 3 | 96298 | 82 | 0.000014 | 0.015 |
| 5 | GNA11 | guanine nucleotide binding protein (G protein), alpha 11 (Gq class) | 1 | 2 | 1 | 356 | 1 | 0.00016 | 0.12 |
| 6 | LAMC1 | laminin, gamma 1 (formerly LAMB2) | 1 | 2 | 1 | 356 | 1 | 0.00016 | 0.12 |
| 7 | IDH1 | isocitrate dehydrogenase 1 (NADP+), soluble | 1 | 5 | 1 | 890 | 1492 | 0.0004 | 0.26 |
| 8 | BRAF | v-raf murine sarcoma viral oncogene homolog B1 | 1 | 89 | 1 | 15842 | 47 | 0.0072 | 1 |
| 9 | NF1 | neurofibromin 1 (neurofibromatosis, von Recklinghausen disease, Watson disease) | 15 | 285 | 1 | 50730 | 2 | 0.023 | 1 |
| 10 | CDKN2A | cyclin-dependent kinase inhibitor 2A (melanoma, p16, inhibits CDK4) | 1 | 332 | 1 | 59096 | 8 | 0.027 | 1 |
Note:
n - number of (nonsilent) mutations in this gene across the individual set.
cos = number of unique mutated sites in this gene in COSMIC
n_cos = overlap between n and cos.
N_cos = number of individuals times cos.
cos_ev = total evidence: number of reports in COSMIC for mutations seen in this gene.
p = p-value for seeing the observed amount of overlap in this gene)
q = q-value, False Discovery Rate (Benjamini-Hochberg procedure)
Table 5. Get Full Table A Ranked List of Significantly Mutated Genesets. (Source: MSigDB GSEA Cannonical Pathway Set).Number of significant genesets found: 62. Number of genesets displayed: 10
| rank | geneset | description | genes | N_genes | mut_tally | N | n | npat | nsite | nsil | n1 | n2 | n3 | n4 | n5 | n6 | p_ns_s | p | q |
|---|---|---|---|---|---|---|---|---|---|---|---|---|---|---|---|---|---|---|---|
| 1 | IL3PATHWAY | IL-3 promotes proliferation and differentiation of hematopoietic cells via a heterodimeric receptor that activates the Stat5 and MAP kinase pathways. | CSF2RB, FOS, GRB2, HRAS, IL3, IL3RA, JAK2, MAP2K1, MAPK3, PTPN6, RAF1, SHC1, SOS1, STAT5A, STAT5B | 15 | HRAS(18), JAK2(1), MAP2K1(1), SHC1(2) | 4603424 | 22 | 22 | 7 | 1 | 1 | 0 | 13 | 7 | 1 | 0 | 0.015 | 4.9e-15 | 5.1e-13 |
| 2 | SA_TRKA_RECEPTOR | The TrkA receptor binds nerve growth factor to activate MAP kinase pathways and promote cell growth. | AKT1, AKT2, AKT3, ARHA, CDKN1A, ELK1, GRB2, HRAS, MAP2K1, MAP2K2, NGFB, NGFR, NTRK1, PIK3CA, PIK3CD, SHC1, SOS1 | 15 | HRAS(18), MAP2K1(1), SHC1(2) | 4148484 | 21 | 21 | 6 | 1 | 1 | 0 | 13 | 6 | 1 | 0 | 0.023 | 5.3e-15 | 5.1e-13 |
| 3 | IL6PATHWAY | IL-6 binding to its receptor activates JAK kinases and a variety of transcription factors, with effects in neuronal differentiation, bone loss, and inflammation. | CEBPB, CSNK2A1, ELK1, FOS, GRB2, HRAS, IL6, IL6R, IL6ST, JAK1, JAK2, JAK3, JUN, MAP2K1, MAPK3, PTPN11, RAF1, SHC1, SOS1, SRF, STAT3 | 21 | HRAS(18), IL6ST(1), JAK2(1), JUN(1), MAP2K1(1), SHC1(2), STAT3(1) | 6178258 | 25 | 25 | 10 | 1 | 1 | 1 | 14 | 7 | 2 | 0 | 0.0041 | 5.4e-15 | 5.1e-13 |
| 4 | IL2PATHWAY | IL-2 promotes proliferation via JAK and MAP kinase and has surface receptors on activated B cells, LPS-treated monocytes, and many T cells. | CSNK2A1, ELK1, FOS, GRB2, HRAS, IL2, IL2RA, IL2RB, IL2RG, JAK1, JAK3, JUN, LCK, MAP2K1, MAPK3, MAPK8, RAF1, SHC1, SOS1, STAT5A, STAT5B, SYK | 22 | HRAS(18), IL2RB(1), JUN(1), MAP2K1(1), SHC1(2) | 5948294 | 23 | 23 | 8 | 1 | 2 | 0 | 13 | 6 | 2 | 0 | 0.0098 | 6.2e-15 | 5.1e-13 |
| 5 | RECKPATHWAY | RECK is a membrane-anchored inhibitor of matrix metalloproteinases, which are expressed by tumor cells and promote metastasis. | HRAS, MMP14, MMP2, MMP9, RECK, TIMP1, TIMP2, TIMP3, TIMP4 | 9 | HRAS(18), MMP14(1), MMP2(1) | 1958204 | 20 | 20 | 5 | 0 | 1 | 0 | 13 | 6 | 0 | 0 | 0.0055 | 6.2e-15 | 5.1e-13 |
| 6 | LONGEVITYPATHWAY | Caloric restriction in animals often increases lifespan, which may occur via decreased IGF receptor expression and consequent expression of stress-resistance proteins. | AKT1, CAT, FOXO3A, GH1, GHR, HRAS, IGF1, IGF1R, PIK3CA, PIK3R1, SHC1, SOD1, SOD2, SOD3 | 12 | HRAS(18), IGF1R(1), SHC1(2) | 3458583 | 21 | 21 | 6 | 1 | 2 | 0 | 13 | 6 | 0 | 0 | 0.014 | 6.8e-15 | 5.1e-13 |
| 7 | ERKPATHWAY | Cell growth is promoted by Ras activation of the anti-apoptotic p44/42 MAP kinase pathway. | DPM2, EGFR, ELK1, GNAS, GNB1, GNGT1, GRB2, HRAS, IGF1R, ITGB1, KLK2, MAP2K1, MAP2K2, MAPK1, MAPK3, MKNK1, MKNK2, MYC, NGFB, NGFR, PDGFRA, PPP2CA, PTPRR, RAF1, RPS6KA1, RPS6KA5, SHC1, SOS1, SRC, STAT3 | 29 | HRAS(18), IGF1R(1), ITGB1(1), MAP2K1(1), PDGFRA(1), RPS6KA5(1), SHC1(2), STAT3(1) | 8580119 | 26 | 26 | 11 | 0 | 2 | 1 | 14 | 7 | 2 | 0 | 0.001 | 7.1e-15 | 5.1e-13 |
| 8 | IGF1RPATHWAY | Insulin-like growth factor receptor IGF-1R promotes cell growth and inhibits apoptosis on binding of ligands IGF-1 and 2 via Ras activation and the AKT pathway. | AKT1, BAD, GRB2, HRAS, IGF1R, IRS1, MAP2K1, MAPK1, MAPK3, PIK3CA, PIK3R1, RAF1, SHC1, SOS1, YWHAH | 15 | HRAS(18), IGF1R(1), MAP2K1(1), SHC1(2) | 4996144 | 22 | 22 | 7 | 1 | 2 | 0 | 13 | 6 | 1 | 0 | 0.014 | 7.6e-15 | 5.1e-13 |
| 9 | CDK5PATHWAY | Cdk5, a regulatory kinase implicated in neuronal development, represses Mek1, which downregulates the MAP kinase pathway. | CDK5, CDK5R1, DPM2, EGR1, HRAS, KLK2, MAP2K1, MAP2K2, MAPK1, MAPK3, NGFB, NGFR, RAF1 | 12 | HRAS(18), MAP2K1(1) | 2119370 | 19 | 19 | 4 | 0 | 0 | 0 | 13 | 5 | 1 | 0 | 0.014 | 8.2e-15 | 5.1e-13 |
| 10 | HBXPATHWAY | Hbx is a hepatitis B protein that activates a number of transcription factors, possibly by inducing calcium release from the mitochondrion to the cytoplasm. | CREB1, GRB2, HBXIP, HRAS, PTK2B, SHC1, SOS1, SRC | 8 | HRAS(18), SHC1(2) | 2298694 | 20 | 20 | 5 | 0 | 1 | 0 | 13 | 6 | 0 | 0 | 0.0024 | 8.3e-15 | 5.1e-13 |
Table 6. Get Full Table A Ranked List of Significantly Mutated Genesets (Excluding Significantly Mutated Genes). Number of significant genesets found: 0. Number of genesets displayed: 10
| rank | geneset | description | genes | N_genes | mut_tally | N | n | npat | nsite | nsil | n1 | n2 | n3 | n4 | n5 | n6 | p_ns_s | p | q |
|---|---|---|---|---|---|---|---|---|---|---|---|---|---|---|---|---|---|---|---|
| 1 | SLRPPATHWAY | Small leucine-rich proteoglycans (SLRPs) interact with and reorganize collagen fibers in the extracellular matrix. | BGN, DCN, DSPG3, FMOD, KERA, LUM | 5 | DCN(1), FMOD(1), LUM(1) | 949002 | 3 | 3 | 3 | 0 | 2 | 1 | 0 | 0 | 0 | 0 | 0.26 | 0.0018 | 0.68 |
| 2 | HSA00460_CYANOAMINO_ACID_METABOLISM | Genes involved in cyanoamino acid metabolism | ASRGL1, GBA, GBA3, GGT1, GGTL3, GGTL4, SHMT1, SHMT2 | 6 | ASRGL1(1), GBA(2), GGT1(1) | 1370833 | 4 | 4 | 4 | 0 | 0 | 1 | 1 | 2 | 0 | 0 | 0.3 | 0.0022 | 0.68 |
| 3 | EICOSANOID_SYNTHESIS | ALOX12, ALOX15, ALOX15B, ALOX5, ALOX5AP, DPEP1, GGT1, IPLA2(GAMMA), LTA4H, LTC4S, PLA2G2A, PLA2G6, PTGDS, PTGES, PTGIS, PTGS1, PTGS2, TBXAS1 | 17 | ALOX12(1), ALOX15(1), DPEP1(1), GGT1(1), PTGS1(2) | 3819871 | 6 | 6 | 6 | 1 | 1 | 2 | 1 | 1 | 1 | 0 | 0.33 | 0.0042 | 0.81 | |
| 4 | SELENOAMINO_ACID_METABOLISM | AHCY, CBS, CTH, GGT1, MARS, MARS2, MAT1A, MAT2B, PAPSS1, PAPSS2, SCLY, SEPHS1 | 12 | CTH(1), GGT1(1), MARS(1), PAPSS1(1), PAPSS2(1) | 3206375 | 5 | 5 | 5 | 1 | 1 | 2 | 0 | 2 | 0 | 0 | 0.4 | 0.0052 | 0.81 | |
| 5 | IL6PATHWAY | IL-6 binding to its receptor activates JAK kinases and a variety of transcription factors, with effects in neuronal differentiation, bone loss, and inflammation. | CEBPB, CSNK2A1, ELK1, FOS, GRB2, HRAS, IL6, IL6R, IL6ST, JAK1, JAK2, JAK3, JUN, MAP2K1, MAPK3, PTPN11, RAF1, SHC1, SOS1, SRF, STAT3 | 20 | IL6ST(1), JAK2(1), JUN(1), MAP2K1(1), SHC1(2), STAT3(1) | 6066968 | 7 | 7 | 7 | 1 | 1 | 1 | 1 | 2 | 2 | 0 | 0.36 | 0.0074 | 0.87 |
| 6 | HSA00430_TAURINE_AND_HYPOTAURINE_METABOLISM | Genes involved in taurine and hypotaurine metabolism | BAAT, CDO1, CSAD, GAD1, GAD2, GGT1, GGTL3, GGTL4 | 6 | GAD1(2), GGT1(1) | 1479548 | 3 | 3 | 3 | 0 | 1 | 1 | 0 | 1 | 0 | 0 | 0.34 | 0.0085 | 0.87 |
| 7 | 1_AND_2_METHYLNAPHTHALENE_DEGRADATION | ADH1A, ADH1A, ADH1B, ADH1C, ADH1B, ADH1C, ADH4, ADH6, ADH7, ADHFE1 | 7 | ADH4(2), ADH6(2) | 1499098 | 4 | 3 | 4 | 1 | 0 | 2 | 0 | 1 | 1 | 0 | 0.66 | 0.01 | 0.92 | |
| 8 | SULFUR_METABOLISM | BPNT1, PAPSS1, PAPSS2, SULT1A2, SULT1A3, SULT1A3, SULT1A4, SULT1E1, SULT2A1, SUOX | 7 | PAPSS1(1), PAPSS2(1), SULT1E1(1) | 1619582 | 3 | 3 | 3 | 0 | 1 | 1 | 0 | 0 | 1 | 0 | 0.5 | 0.013 | 0.98 | |
| 9 | PROSTAGLANDIN_AND_LEUKOTRIENE_METABOLISM | AKR1C3, ALOX12, ALOX15, ALOX5, CBR1, CBR3, CYP4F2, CYP4F3, CYP4F3, CYP4F2, EPX, GGT1, LPO, LTA4H, MPO, PGDS, PLA2G1B, PLA2G2A, PLA2G2E, PLA2G3, PLA2G4A, PLA2G5, PLA2G6, PRDX1, PRDX2, PRDX5, PRDX6, PTGDS, PTGES2, PTGIS, PTGS1, PTGS2, TBXAS1, TPO | 31 | ALOX12(1), ALOX15(1), CYP4F2(1), EPX(1), GGT1(1), PTGS1(2), TPO(1) | 7125220 | 8 | 8 | 8 | 0 | 1 | 2 | 2 | 2 | 1 | 0 | 0.076 | 0.014 | 0.98 | |
| 10 | ERKPATHWAY | Cell growth is promoted by Ras activation of the anti-apoptotic p44/42 MAP kinase pathway. | DPM2, EGFR, ELK1, GNAS, GNB1, GNGT1, GRB2, HRAS, IGF1R, ITGB1, KLK2, MAP2K1, MAP2K2, MAPK1, MAPK3, MKNK1, MKNK2, MYC, NGFB, NGFR, PDGFRA, PPP2CA, PTPRR, RAF1, RPS6KA1, RPS6KA5, SHC1, SOS1, SRC, STAT3 | 28 | IGF1R(1), ITGB1(1), MAP2K1(1), PDGFRA(1), RPS6KA5(1), SHC1(2), STAT3(1) | 8468829 | 8 | 8 | 8 | 0 | 2 | 1 | 1 | 2 | 2 | 0 | 0.15 | 0.028 | 1 |
In brief, we tabulate the number of mutations and the number of covered bases for each gene. The counts are broken down by mutation context category: four context categories that are discovered by MutSig, and one for indel and 'null' mutations, which include indels, nonsense mutations, splice-site mutations, and non-stop (read-through) mutations. For each gene, we calculate the probability of seeing the observed constellation of mutations, i.e. the product P1 x P2 x ... x Pm, or a more extreme one, given the background mutation rates calculated across the dataset. [1]
In addition to the links below, the full results of the analysis summarized in this report can also be downloaded programmatically using firehose_get, or interactively from either the Broad GDAC website or TCGA Data Coordination Center Portal.