This pipeline computes the correlation between significantly recurrent gene mutations and selected clinical features.
Testing the association between mutation status of 37 genes and 13 clinical features across 256 patients, 2 significant findings detected with Q value < 0.25.
-
TP53 mutation correlated to 'GLEASON_SCORE_COMBINED' and 'GLEASON_SCORE'.
Table 1. Get Full Table Overview of the association between mutation status of 37 genes and 13 clinical features. Shown in the table are P values (Q values). Thresholded by Q value < 0.25, 2 significant findings detected.
|
Clinical Features |
AGE |
PATHOLOGY T STAGE |
PATHOLOGY N STAGE |
HISTOLOGICAL TYPE |
COMPLETENESS OF RESECTION |
NUMBER OF LYMPH NODES |
GLEASON SCORE COMBINED |
GLEASON SCORE PRIMARY |
GLEASON SCORE SECONDARY |
GLEASON SCORE |
PSA RESULT PREOP |
PSA VALUE |
RACE | ||
| nMutated (%) | nWild-Type | Wilcoxon-test | Fisher's exact test | Fisher's exact test | Fisher's exact test | Fisher's exact test | Wilcoxon-test | Wilcoxon-test | Wilcoxon-test | Wilcoxon-test | Wilcoxon-test | Wilcoxon-test | Wilcoxon-test | Fisher's exact test | |
| TP53 | 22 (9%) | 234 |
0.719 (1.00) |
0.325 (1.00) |
0.714 (1.00) |
1 (1.00) |
0.712 (1.00) |
0.69 (1.00) |
0.000281 (0.128) |
0.00405 (1.00) |
0.0688 (1.00) |
9.9e-05 (0.0452) |
0.274 (1.00) |
0.0929 (1.00) |
1 (1.00) |
| SPOP | 26 (10%) | 230 |
0.158 (1.00) |
0.816 (1.00) |
1 (1.00) |
0.115 (1.00) |
0.728 (1.00) |
0.802 (1.00) |
0.7 (1.00) |
0.344 (1.00) |
0.693 (1.00) |
0.913 (1.00) |
0.819 (1.00) |
0.908 (1.00) |
0.554 (1.00) |
| PTEN | 12 (5%) | 244 |
0.752 (1.00) |
1 (1.00) |
0.337 (1.00) |
0.252 (1.00) |
0.427 (1.00) |
0.401 (1.00) |
0.323 (1.00) |
0.704 (1.00) |
0.397 (1.00) |
0.429 (1.00) |
0.384 (1.00) |
0.0103 (1.00) |
1 (1.00) |
| CTNNB1 | 9 (4%) | 247 |
0.507 (1.00) |
0.426 (1.00) |
0.603 (1.00) |
0.195 (1.00) |
0.779 (1.00) |
0.318 (1.00) |
0.52 (1.00) |
0.823 (1.00) |
0.438 (1.00) |
0.34 (1.00) |
0.0753 (1.00) |
0.457 (1.00) |
1 (1.00) |
| TCEB3 | 4 (2%) | 252 |
0.551 (1.00) |
0.652 (1.00) |
0.291 (1.00) |
1 (1.00) |
1 (1.00) |
0.245 (1.00) |
0.179 (1.00) |
0.14 (1.00) |
0.667 (1.00) |
0.217 (1.00) |
0.418 (1.00) |
0.657 (1.00) |
|
| FOXA1 | 12 (5%) | 244 |
0.193 (1.00) |
0.4 (1.00) |
0.602 (1.00) |
1 (1.00) |
0.488 (1.00) |
0.288 (1.00) |
0.698 (1.00) |
0.654 (1.00) |
0.6 (1.00) |
0.556 (1.00) |
0.982 (1.00) |
0.344 (1.00) |
0.0524 (1.00) |
| BRAF | 5 (2%) | 251 |
0.817 (1.00) |
0.435 (1.00) |
1 (1.00) |
0.113 (1.00) |
1 (1.00) |
0.487 (1.00) |
0.922 (1.00) |
0.227 (1.00) |
0.208 (1.00) |
0.994 (1.00) |
0.347 (1.00) |
0.738 (1.00) |
|
| PIK3CA | 9 (4%) | 247 |
0.289 (1.00) |
0.592 (1.00) |
0.556 (1.00) |
0.195 (1.00) |
0.0399 (1.00) |
0.816 (1.00) |
0.0411 (1.00) |
0.292 (1.00) |
0.0894 (1.00) |
0.0652 (1.00) |
0.652 (1.00) |
0.443 (1.00) |
1 (1.00) |
| IDH1 | 4 (2%) | 252 |
0.0177 (1.00) |
0.655 (1.00) |
0.369 (1.00) |
1 (1.00) |
0.0833 (1.00) |
0.405 (1.00) |
0.0104 (1.00) |
0.0523 (1.00) |
0.0519 (1.00) |
0.0142 (1.00) |
0.0773 (1.00) |
0.32 (1.00) |
|
| FAM47C | 8 (3%) | 248 |
0.55 (1.00) |
1 (1.00) |
1 (1.00) |
1 (1.00) |
0.778 (1.00) |
0.39 (1.00) |
0.107 (1.00) |
0.932 (1.00) |
0.0333 (1.00) |
0.24 (1.00) |
0.66 (1.00) |
0.885 (1.00) |
1 (1.00) |
| TP53BP1 | 5 (2%) | 251 |
0.453 (1.00) |
0.436 (1.00) |
1 (1.00) |
1 (1.00) |
1 (1.00) |
0.549 (1.00) |
0.0812 (1.00) |
0.0778 (1.00) |
0.7 (1.00) |
0.11 (1.00) |
0.944 (1.00) |
0.407 (1.00) |
|
| CNTNAP1 | 5 (2%) | 251 |
0.654 (1.00) |
1 (1.00) |
1 (1.00) |
0.113 (1.00) |
0.336 (1.00) |
0.549 (1.00) |
0.131 (1.00) |
0.723 (1.00) |
0.0612 (1.00) |
0.488 (1.00) |
0.708 (1.00) |
0.788 (1.00) |
|
| MLLT10 | 4 (2%) | 252 |
0.166 (1.00) |
1 (1.00) |
1 (1.00) |
1 (1.00) |
0.646 (1.00) |
0.487 (1.00) |
0.767 (1.00) |
0.673 (1.00) |
0.566 (1.00) |
0.846 (1.00) |
0.643 (1.00) |
0.126 (1.00) |
1 (1.00) |
| ZMYM3 | 5 (2%) | 251 |
0.505 (1.00) |
0.438 (1.00) |
0.438 (1.00) |
1 (1.00) |
0.191 (1.00) |
0.556 (1.00) |
0.0481 (1.00) |
0.178 (1.00) |
0.0814 (1.00) |
0.0644 (1.00) |
0.175 (1.00) |
0.175 (1.00) |
1 (1.00) |
| SMG7 | 4 (2%) | 252 |
0.657 (1.00) |
0.654 (1.00) |
1 (1.00) |
1 (1.00) |
1 (1.00) |
0.487 (1.00) |
0.767 (1.00) |
0.954 (1.00) |
0.667 (1.00) |
0.846 (1.00) |
0.234 (1.00) |
0.225 (1.00) |
1 (1.00) |
| EDC4 | 3 (1%) | 253 |
0.328 (1.00) |
1 (1.00) |
0.291 (1.00) |
1 (1.00) |
1 (1.00) |
0.245 (1.00) |
0.521 (1.00) |
0.623 (1.00) |
0.652 (1.00) |
0.47 (1.00) |
0.187 (1.00) |
0.444 (1.00) |
0.166 (1.00) |
| ZNF709 | 4 (2%) | 252 |
0.493 (1.00) |
0.193 (1.00) |
1 (1.00) |
1 (1.00) |
0.132 (1.00) |
0.487 (1.00) |
0.278 (1.00) |
0.0495 (1.00) |
0.695 (1.00) |
0.217 (1.00) |
0.45 (1.00) |
0.647 (1.00) |
|
| CDK12 | 7 (3%) | 249 |
0.7 (1.00) |
1 (1.00) |
0.501 (1.00) |
0.155 (1.00) |
0.395 (1.00) |
0.611 (1.00) |
0.0727 (1.00) |
0.243 (1.00) |
0.286 (1.00) |
0.107 (1.00) |
0.385 (1.00) |
0.751 (1.00) |
|
| RPTN | 6 (2%) | 250 |
0.364 (1.00) |
0.486 (1.00) |
1 (1.00) |
1 (1.00) |
0.137 (1.00) |
0.435 (1.00) |
0.219 (1.00) |
0.393 (1.00) |
0.556 (1.00) |
0.198 (1.00) |
0.523 (1.00) |
0.13 (1.00) |
0.163 (1.00) |
| TNRC18 | 4 (2%) | 252 |
0.866 (1.00) |
0.654 (1.00) |
0.369 (1.00) |
1 (1.00) |
0.186 (1.00) |
0.291 (1.00) |
0.767 (1.00) |
0.954 (1.00) |
0.667 (1.00) |
0.846 (1.00) |
0.643 (1.00) |
0.785 (1.00) |
|
| MED15 | 5 (2%) | 251 |
0.518 (1.00) |
1 (1.00) |
1 (1.00) |
1 (1.00) |
1 (1.00) |
0.435 (1.00) |
0.0579 (1.00) |
0.0778 (1.00) |
0.259 (1.00) |
0.0789 (1.00) |
0.439 (1.00) |
0.236 (1.00) |
0.164 (1.00) |
| NKX3-1 | 5 (2%) | 251 |
0.387 (1.00) |
0.261 (1.00) |
1 (1.00) |
1 (1.00) |
0.669 (1.00) |
0.435 (1.00) |
0.405 (1.00) |
0.622 (1.00) |
0.114 (1.00) |
0.112 (1.00) |
0.787 (1.00) |
0.776 (1.00) |
1 (1.00) |
| KDM6A | 6 (2%) | 250 |
0.338 (1.00) |
0.0194 (1.00) |
1 (1.00) |
1 (1.00) |
0.14 (1.00) |
0.39 (1.00) |
0.955 (1.00) |
0.138 (1.00) |
0.204 (1.00) |
0.663 (1.00) |
0.617 (1.00) |
0.397 (1.00) |
1 (1.00) |
| RNF31 | 4 (2%) | 252 |
0.456 (1.00) |
0.652 (1.00) |
1 (1.00) |
1 (1.00) |
0.13 (1.00) |
0.487 (1.00) |
0.179 (1.00) |
0.312 (1.00) |
0.265 (1.00) |
0.217 (1.00) |
0.646 (1.00) |
0.785 (1.00) |
|
| ESCO1 | 4 (2%) | 252 |
0.291 (1.00) |
0.657 (1.00) |
1 (1.00) |
1 (1.00) |
0.588 (1.00) |
0.487 (1.00) |
0.767 (1.00) |
0.375 (1.00) |
0.208 (1.00) |
0.846 (1.00) |
0.567 (1.00) |
0.416 (1.00) |
1 (1.00) |
| LMOD2 | 3 (1%) | 253 |
0.282 (1.00) |
0.621 (1.00) |
1 (1.00) |
1 (1.00) |
0.534 (1.00) |
0.623 (1.00) |
0.652 (1.00) |
0.493 (1.00) |
0.0855 (1.00) |
0.367 (1.00) |
|||
| FAM120B | 3 (1%) | 253 |
0.997 (1.00) |
1 (1.00) |
1 (1.00) |
1 (1.00) |
1 (1.00) |
0.521 (1.00) |
0.55 (1.00) |
0.159 (1.00) |
0.47 (1.00) |
0.658 (1.00) |
0.785 (1.00) |
1 (1.00) |
|
| CLEC1A | 4 (2%) | 252 |
0.707 (1.00) |
0.0774 (1.00) |
1 (1.00) |
1 (1.00) |
1 (1.00) |
0.549 (1.00) |
0.13 (1.00) |
0.375 (1.00) |
0.282 (1.00) |
0.118 (1.00) |
0.915 (1.00) |
0.135 (1.00) |
|
| RNF17 | 3 (1%) | 253 |
0.413 (1.00) |
1 (1.00) |
1 (1.00) |
1 (1.00) |
1 (1.00) |
0.549 (1.00) |
0.521 (1.00) |
0.112 (1.00) |
0.62 (1.00) |
0.47 (1.00) |
0.52 (1.00) |
1 (1.00) |
|
| RP1L1 | 7 (3%) | 249 |
0.5 (1.00) |
1 (1.00) |
1 (1.00) |
1 (1.00) |
0.243 (1.00) |
0.435 (1.00) |
0.164 (1.00) |
0.659 (1.00) |
0.0894 (1.00) |
0.486 (1.00) |
0.143 (1.00) |
0.898 (1.00) |
|
| EOMES | 4 (2%) | 252 |
0.34 (1.00) |
0.0773 (1.00) |
1 (1.00) |
1 (1.00) |
0.0832 (1.00) |
0.549 (1.00) |
0.457 (1.00) |
0.601 (1.00) |
0.265 (1.00) |
0.492 (1.00) |
0.482 (1.00) |
0.0567 (1.00) |
|
| MTF1 | 3 (1%) | 253 |
0.102 (1.00) |
1 (1.00) |
1 (1.00) |
1 (1.00) |
0.589 (1.00) |
0.0499 (1.00) |
0.257 (1.00) |
0.0381 (1.00) |
0.00607 (1.00) |
0.658 (1.00) |
0.215 (1.00) |
||
| NTM | 5 (2%) | 251 |
0.429 (1.00) |
0.435 (1.00) |
1 (1.00) |
1 (1.00) |
0.443 (1.00) |
0.435 (1.00) |
0.73 (1.00) |
0.622 (1.00) |
0.7 (1.00) |
0.79 (1.00) |
0.205 (1.00) |
0.311 (1.00) |
1 (1.00) |
| FNBP4 | 3 (1%) | 253 |
0.718 (1.00) |
0.292 (1.00) |
0.291 (1.00) |
1 (1.00) |
0.23 (1.00) |
0.245 (1.00) |
0.451 (1.00) |
0.257 (1.00) |
0.742 (1.00) |
0.501 (1.00) |
0.144 (1.00) |
||
| CDKN1B | 4 (2%) | 252 |
0.211 (1.00) |
0.0777 (1.00) |
1 (1.00) |
1 (1.00) |
1 (1.00) |
0.487 (1.00) |
0.278 (1.00) |
0.312 (1.00) |
0.667 (1.00) |
0.0464 (1.00) |
0.945 (1.00) |
0.632 (1.00) |
1 (1.00) |
| EIF2AK3 | 4 (2%) | 252 |
0.42 (1.00) |
1 (1.00) |
1 (1.00) |
1 (1.00) |
0.131 (1.00) |
0.971 (1.00) |
0.954 (1.00) |
0.805 (1.00) |
0.846 (1.00) |
0.842 (1.00) |
0.984 (1.00) |
1 (1.00) |
|
| LARP1 | 3 (1%) | 253 |
0.515 (1.00) |
1 (1.00) |
0.291 (1.00) |
1 (1.00) |
0.167 (1.00) |
0.534 (1.00) |
0.623 (1.00) |
0.652 (1.00) |
0.493 (1.00) |
0.902 (1.00) |
0.876 (1.00) |
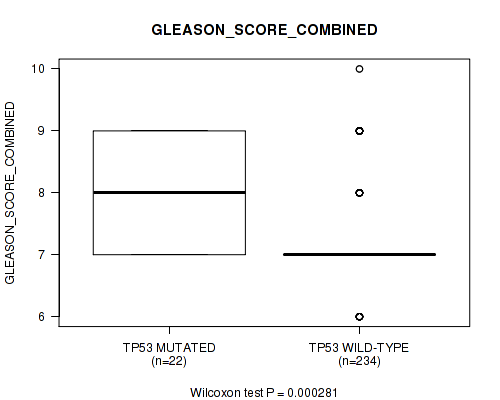
P value = 0.000281 (Wilcoxon-test), Q value = 0.13
Table S1. Gene #2: 'TP53 MUTATION STATUS' versus Clinical Feature #7: 'GLEASON_SCORE_COMBINED'
| nPatients | Mean (Std.Dev) | |
|---|---|---|
| ALL | 256 | 7.4 (0.9) |
| TP53 MUTATED | 22 | 8.0 (0.9) |
| TP53 WILD-TYPE | 234 | 7.3 (0.8) |
Figure S1. Get High-res Image Gene #2: 'TP53 MUTATION STATUS' versus Clinical Feature #7: 'GLEASON_SCORE_COMBINED'
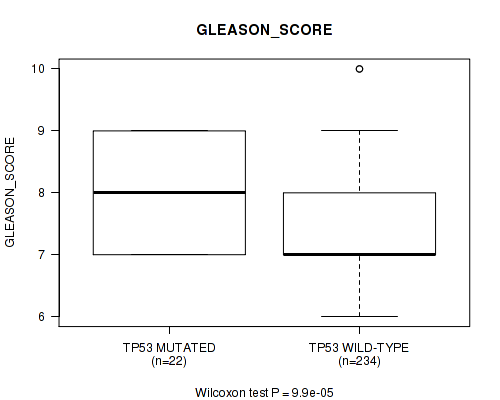
P value = 9.9e-05 (Wilcoxon-test), Q value = 0.045
Table S2. Gene #2: 'TP53 MUTATION STATUS' versus Clinical Feature #10: 'GLEASON_SCORE'
| nPatients | Mean (Std.Dev) | |
|---|---|---|
| ALL | 256 | 7.4 (0.9) |
| TP53 MUTATED | 22 | 8.1 (0.9) |
| TP53 WILD-TYPE | 234 | 7.3 (0.9) |
Figure S2. Get High-res Image Gene #2: 'TP53 MUTATION STATUS' versus Clinical Feature #10: 'GLEASON_SCORE'
-
Mutation data file = transformed.cor.cli.txt
-
Clinical data file = PRAD-TP.merged_data.txt
-
Number of patients = 256
-
Number of significantly mutated genes = 37
-
Number of selected clinical features = 13
-
Exclude genes that fewer than K tumors have mutations, K = 3
For binary or multi-class clinical features (nominal or ordinal), two-tailed Fisher's exact tests (Fisher 1922) were used to estimate the P values using the 'fisher.test' function in R
For multiple hypothesis correction, Q value is the False Discovery Rate (FDR) analogue of the P value (Benjamini and Hochberg 1995), defined as the minimum FDR at which the test may be called significant. We used the 'Benjamini and Hochberg' method of 'p.adjust' function in R to convert P values into Q values.
In addition to the links below, the full results of the analysis summarized in this report can also be downloaded programmatically using firehose_get, or interactively from either the Broad GDAC website or TCGA Data Coordination Center Portal.