This pipeline computes the correlation between significant arm-level copy number variations (cnvs) and selected clinical features.
Testing the association between copy number variation 80 arm-level events and 4 clinical features across 156 patients, 9 significant findings detected with Q value < 0.25.
-
7p gain cnv correlated to 'AGE'.
-
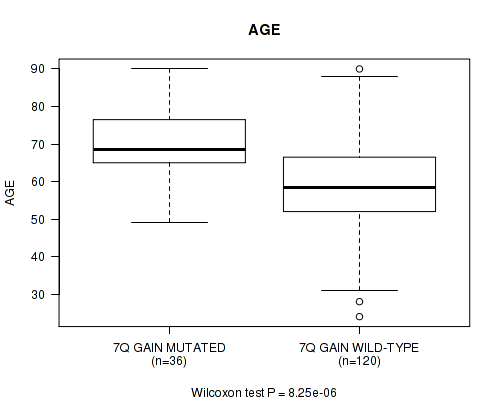
7q gain cnv correlated to 'AGE'.
-
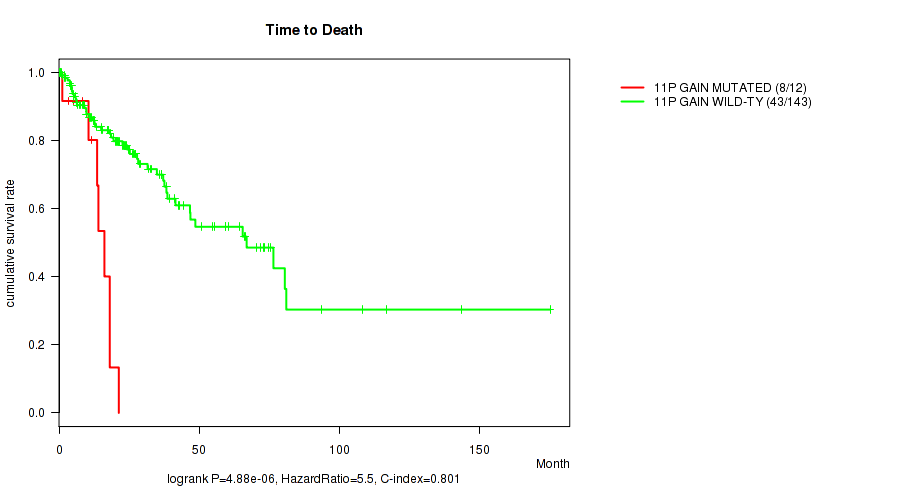
11p gain cnv correlated to 'Time to Death'.
-
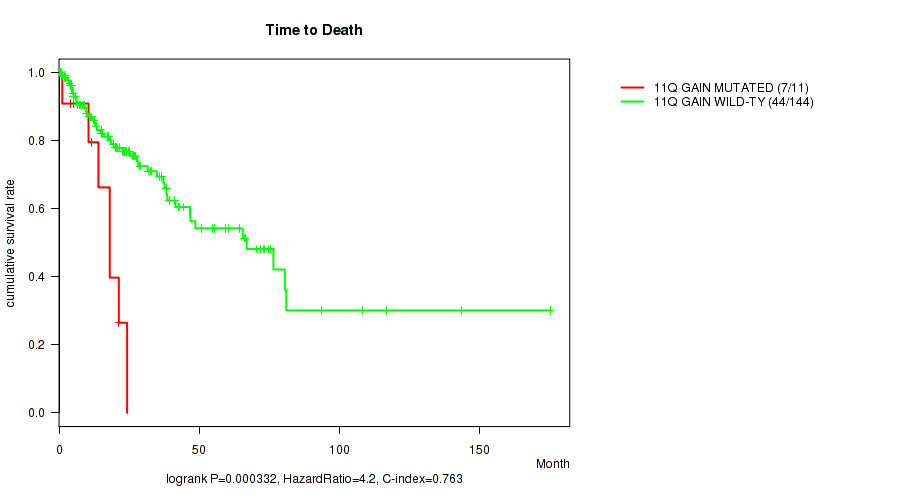
11q gain cnv correlated to 'Time to Death'.
-
19p gain cnv correlated to 'AGE'.
-
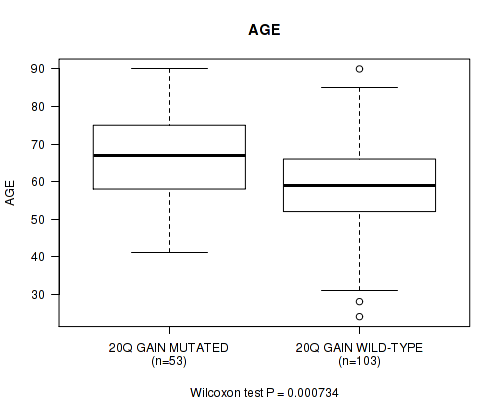
20q gain cnv correlated to 'AGE'.
-
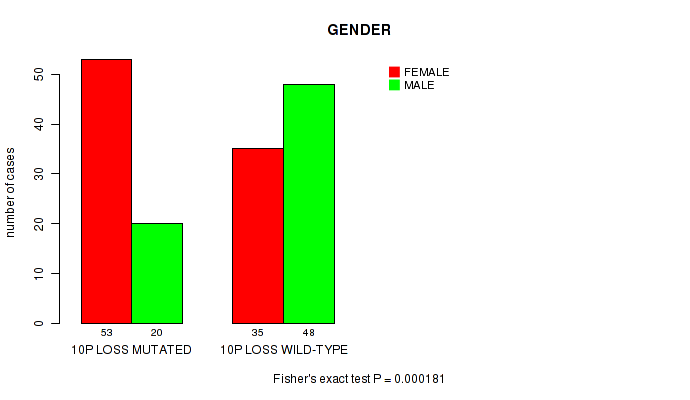
10p loss cnv correlated to 'GENDER'.
-
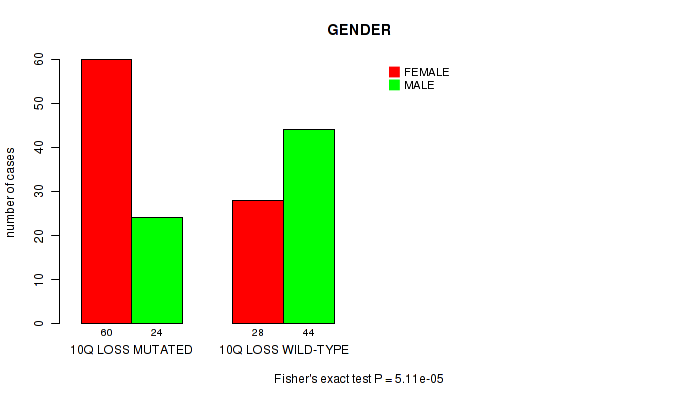
10q loss cnv correlated to 'GENDER'.
-
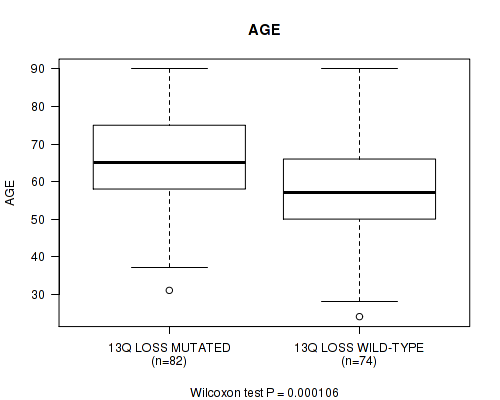
13q loss cnv correlated to 'AGE'.
Table 1. Get Full Table Overview of the association between significant copy number variation of 80 arm-level events and 4 clinical features. Shown in the table are P values (Q values). Thresholded by Q value < 0.25, 9 significant findings detected.
|
Clinical Features |
Time to Death |
AGE | GENDER | RACE | ||
| nCNV (%) | nWild-Type | logrank test | Wilcoxon-test | Fisher's exact test | Fisher's exact test | |
| 7p gain | 45 (29%) | 111 |
0.594 (1.00) |
0.000122 (0.0387) |
0.378 (1.00) |
0.242 (1.00) |
| 7q gain | 36 (23%) | 120 |
0.588 (1.00) |
8.25e-06 (0.00263) |
0.445 (1.00) |
0.695 (1.00) |
| 11p gain | 12 (8%) | 144 |
4.88e-06 (0.00156) |
0.00657 (1.00) |
0.232 (1.00) |
0.409 (1.00) |
| 11q gain | 11 (7%) | 145 |
0.000332 (0.104) |
0.526 (1.00) |
0.35 (1.00) |
0.742 (1.00) |
| 19p gain | 47 (30%) | 109 |
0.174 (1.00) |
0.000559 (0.175) |
0.386 (1.00) |
0.369 (1.00) |
| 20q gain | 53 (34%) | 103 |
0.116 (1.00) |
0.000734 (0.229) |
0.394 (1.00) |
0.24 (1.00) |
| 10p loss | 73 (47%) | 83 |
0.79 (1.00) |
0.0118 (1.00) |
0.000181 (0.0569) |
0.177 (1.00) |
| 10q loss | 84 (54%) | 72 |
0.385 (1.00) |
0.0649 (1.00) |
5.11e-05 (0.0162) |
0.577 (1.00) |
| 13q loss | 82 (53%) | 74 |
0.22 (1.00) |
0.000106 (0.0337) |
0.0359 (1.00) |
1 (1.00) |
| 1p gain | 32 (21%) | 124 |
0.283 (1.00) |
0.0232 (1.00) |
0.549 (1.00) |
0.525 (1.00) |
| 1q gain | 32 (21%) | 124 |
0.299 (1.00) |
0.0397 (1.00) |
0.318 (1.00) |
0.869 (1.00) |
| 2p gain | 12 (8%) | 144 |
0.0183 (1.00) |
0.0408 (1.00) |
1 (1.00) |
0.457 (1.00) |
| 2q gain | 10 (6%) | 146 |
0.583 (1.00) |
0.0623 (1.00) |
0.515 (1.00) |
0.365 (1.00) |
| 3p gain | 19 (12%) | 137 |
0.907 (1.00) |
0.0641 (1.00) |
0.625 (1.00) |
0.553 (1.00) |
| 3q gain | 17 (11%) | 139 |
0.959 (1.00) |
0.023 (1.00) |
0.606 (1.00) |
0.788 (1.00) |
| 4p gain | 39 (25%) | 117 |
0.898 (1.00) |
0.93 (1.00) |
0.0659 (1.00) |
0.326 (1.00) |
| 4q gain | 25 (16%) | 131 |
0.299 (1.00) |
0.528 (1.00) |
1 (1.00) |
0.604 (1.00) |
| 5p gain | 56 (36%) | 100 |
0.995 (1.00) |
0.00311 (0.945) |
0.501 (1.00) |
0.512 (1.00) |
| 5q gain | 46 (29%) | 110 |
0.88 (1.00) |
0.0252 (1.00) |
0.0351 (1.00) |
0.351 (1.00) |
| 6p gain | 31 (20%) | 125 |
0.0267 (1.00) |
0.00271 (0.826) |
0.419 (1.00) |
1 (1.00) |
| 6q gain | 30 (19%) | 126 |
0.118 (1.00) |
0.0192 (1.00) |
0.838 (1.00) |
1 (1.00) |
| 8p gain | 33 (21%) | 123 |
0.00407 (1.00) |
0.196 (1.00) |
0.236 (1.00) |
0.00251 (0.768) |
| 8q gain | 34 (22%) | 122 |
0.00582 (1.00) |
0.747 (1.00) |
0.0782 (1.00) |
0.00394 (1.00) |
| 9p gain | 28 (18%) | 128 |
0.127 (1.00) |
0.0555 (1.00) |
0.834 (1.00) |
0.635 (1.00) |
| 9q gain | 40 (26%) | 116 |
0.888 (1.00) |
0.00156 (0.482) |
1 (1.00) |
0.632 (1.00) |
| 10p gain | 14 (9%) | 142 |
0.049 (1.00) |
0.615 (1.00) |
1 (1.00) |
1 (1.00) |
| 10q gain | 7 (4%) | 149 |
0.458 (1.00) |
0.32 (1.00) |
0.241 (1.00) |
1 (1.00) |
| 12p gain | 25 (16%) | 131 |
0.0245 (1.00) |
0.0019 (0.585) |
0.664 (1.00) |
0.148 (1.00) |
| 12q gain | 18 (12%) | 138 |
0.841 (1.00) |
0.0844 (1.00) |
0.618 (1.00) |
0.00934 (1.00) |
| 13q gain | 7 (4%) | 149 |
0.666 (1.00) |
0.584 (1.00) |
0.0188 (1.00) |
0.0839 (1.00) |
| 14q gain | 31 (20%) | 125 |
0.0311 (1.00) |
0.102 (1.00) |
0.686 (1.00) |
0.871 (1.00) |
| 15q gain | 42 (27%) | 114 |
0.919 (1.00) |
0.033 (1.00) |
0.0687 (1.00) |
0.355 (1.00) |
| 16p gain | 23 (15%) | 133 |
0.0906 (1.00) |
0.356 (1.00) |
1 (1.00) |
0.468 (1.00) |
| 16q gain | 9 (6%) | 147 |
0.17 (1.00) |
0.407 (1.00) |
0.732 (1.00) |
1 (1.00) |
| 17p gain | 36 (23%) | 120 |
0.187 (1.00) |
0.0236 (1.00) |
0.702 (1.00) |
0.109 (1.00) |
| 17q gain | 32 (21%) | 124 |
0.649 (1.00) |
0.0922 (1.00) |
0.0709 (1.00) |
0.0278 (1.00) |
| 18p gain | 27 (17%) | 129 |
0.14 (1.00) |
0.00844 (1.00) |
0.525 (1.00) |
0.263 (1.00) |
| 18q gain | 21 (13%) | 135 |
0.255 (1.00) |
0.0189 (1.00) |
0.352 (1.00) |
0.552 (1.00) |
| 19q gain | 37 (24%) | 119 |
0.54 (1.00) |
0.00114 (0.355) |
0.85 (1.00) |
0.602 (1.00) |
| 20p gain | 40 (26%) | 116 |
0.0172 (1.00) |
0.0163 (1.00) |
0.584 (1.00) |
0.371 (1.00) |
| 21q gain | 34 (22%) | 122 |
0.0384 (1.00) |
0.114 (1.00) |
0.698 (1.00) |
0.165 (1.00) |
| 22q gain | 36 (23%) | 120 |
0.433 (1.00) |
0.0104 (1.00) |
0.183 (1.00) |
0.499 (1.00) |
| xq gain | 19 (12%) | 137 |
0.817 (1.00) |
0.942 (1.00) |
0.625 (1.00) |
1 (1.00) |
| 1p loss | 22 (14%) | 134 |
0.0782 (1.00) |
0.282 (1.00) |
0.0022 (0.675) |
0.236 (1.00) |
| 1q loss | 22 (14%) | 134 |
0.777 (1.00) |
0.76 (1.00) |
0.0381 (1.00) |
0.684 (1.00) |
| 2p loss | 49 (31%) | 107 |
0.785 (1.00) |
0.0744 (1.00) |
0.0818 (1.00) |
0.292 (1.00) |
| 2q loss | 40 (26%) | 116 |
0.00508 (1.00) |
0.00149 (0.461) |
1 (1.00) |
0.0961 (1.00) |
| 3p loss | 33 (21%) | 123 |
0.0151 (1.00) |
0.111 (1.00) |
1 (1.00) |
0.869 (1.00) |
| 3q loss | 31 (20%) | 125 |
0.00719 (1.00) |
0.0217 (1.00) |
0.843 (1.00) |
1 (1.00) |
| 4p loss | 24 (15%) | 132 |
0.104 (1.00) |
0.339 (1.00) |
0.655 (1.00) |
0.38 (1.00) |
| 4q loss | 32 (21%) | 124 |
0.921 (1.00) |
0.533 (1.00) |
0.161 (1.00) |
0.589 (1.00) |
| 5p loss | 14 (9%) | 142 |
0.977 (1.00) |
0.862 (1.00) |
0.585 (1.00) |
0.455 (1.00) |
| 5q loss | 21 (13%) | 135 |
0.446 (1.00) |
0.564 (1.00) |
0.643 (1.00) |
0.353 (1.00) |
| 6p loss | 38 (24%) | 118 |
0.0353 (1.00) |
0.988 (1.00) |
0.579 (1.00) |
0.36 (1.00) |
| 6q loss | 31 (20%) | 125 |
0.239 (1.00) |
0.396 (1.00) |
0.224 (1.00) |
0.774 (1.00) |
| 7p loss | 23 (15%) | 133 |
0.306 (1.00) |
0.245 (1.00) |
0.255 (1.00) |
0.481 (1.00) |
| 7q loss | 21 (13%) | 135 |
0.146 (1.00) |
0.256 (1.00) |
0.814 (1.00) |
0.862 (1.00) |
| 8p loss | 34 (22%) | 122 |
0.7 (1.00) |
0.489 (1.00) |
0.559 (1.00) |
0.765 (1.00) |
| 8q loss | 27 (17%) | 129 |
0.874 (1.00) |
0.137 (1.00) |
0.289 (1.00) |
0.5 (1.00) |
| 9p loss | 50 (32%) | 106 |
0.887 (1.00) |
0.0183 (1.00) |
0.12 (1.00) |
0.448 (1.00) |
| 9q loss | 29 (19%) | 127 |
0.175 (1.00) |
0.185 (1.00) |
0.539 (1.00) |
0.255 (1.00) |
| 11p loss | 60 (38%) | 96 |
0.934 (1.00) |
0.00764 (1.00) |
0.323 (1.00) |
0.615 (1.00) |
| 11q loss | 51 (33%) | 105 |
0.716 (1.00) |
0.0785 (1.00) |
0.494 (1.00) |
0.9 (1.00) |
| 12p loss | 37 (24%) | 119 |
0.66 (1.00) |
0.233 (1.00) |
1 (1.00) |
0.534 (1.00) |
| 12q loss | 32 (21%) | 124 |
0.632 (1.00) |
0.833 (1.00) |
0.161 (1.00) |
0.489 (1.00) |
| 14q loss | 37 (24%) | 119 |
0.077 (1.00) |
0.782 (1.00) |
1 (1.00) |
0.685 (1.00) |
| 15q loss | 29 (19%) | 127 |
0.00421 (1.00) |
0.155 (1.00) |
0.679 (1.00) |
0.762 (1.00) |
| 16p loss | 47 (30%) | 109 |
0.97 (1.00) |
0.152 (1.00) |
0.159 (1.00) |
0.525 (1.00) |
| 16q loss | 78 (50%) | 78 |
0.685 (1.00) |
0.0123 (1.00) |
0.0754 (1.00) |
0.485 (1.00) |
| 17p loss | 30 (19%) | 126 |
0.177 (1.00) |
0.302 (1.00) |
0.688 (1.00) |
0.569 (1.00) |
| 17q loss | 26 (17%) | 130 |
0.247 (1.00) |
0.212 (1.00) |
0.83 (1.00) |
0.739 (1.00) |
| 18p loss | 33 (21%) | 123 |
0.303 (1.00) |
0.751 (1.00) |
0.113 (1.00) |
1 (1.00) |
| 18q loss | 37 (24%) | 119 |
0.31 (1.00) |
0.0379 (1.00) |
0.26 (1.00) |
1 (1.00) |
| 19p loss | 13 (8%) | 143 |
0.666 (1.00) |
0.729 (1.00) |
0.393 (1.00) |
0.32 (1.00) |
| 19q loss | 21 (13%) | 135 |
0.802 (1.00) |
0.6 (1.00) |
1 (1.00) |
0.378 (1.00) |
| 20p loss | 27 (17%) | 129 |
0.687 (1.00) |
0.0837 (1.00) |
0.289 (1.00) |
0.575 (1.00) |
| 20q loss | 12 (8%) | 144 |
0.481 (1.00) |
0.246 (1.00) |
1 (1.00) |
1 (1.00) |
| 21q loss | 34 (22%) | 122 |
0.0141 (1.00) |
0.00367 (1.00) |
1 (1.00) |
1 (1.00) |
| 22q loss | 45 (29%) | 111 |
0.72 (1.00) |
0.503 (1.00) |
0.217 (1.00) |
0.896 (1.00) |
| xq loss | 59 (38%) | 97 |
0.151 (1.00) |
0.937 (1.00) |
0.135 (1.00) |
0.378 (1.00) |
P value = 0.000122 (Wilcoxon-test), Q value = 0.039
Table S1. Gene #13: '7p gain' versus Clinical Feature #2: 'AGE'
| nPatients | Mean (Std.Dev) | |
|---|---|---|
| ALL | 156 | 61.5 (13.4) |
| 7P GAIN MUTATED | 45 | 67.5 (12.1) |
| 7P GAIN WILD-TYPE | 111 | 59.1 (13.2) |
Figure S1. Get High-res Image Gene #13: '7p gain' versus Clinical Feature #2: 'AGE'

P value = 8.25e-06 (Wilcoxon-test), Q value = 0.0026
Table S2. Gene #14: '7q gain' versus Clinical Feature #2: 'AGE'
| nPatients | Mean (Std.Dev) | |
|---|---|---|
| ALL | 156 | 61.5 (13.4) |
| 7Q GAIN MUTATED | 36 | 69.8 (10.3) |
| 7Q GAIN WILD-TYPE | 120 | 59.0 (13.3) |
Figure S2. Get High-res Image Gene #14: '7q gain' versus Clinical Feature #2: 'AGE'
P value = 4.88e-06 (logrank test), Q value = 0.0016
Table S3. Gene #21: '11p gain' versus Clinical Feature #1: 'Time to Death'
| nPatients | nDeath | Duration Range (Median), Month | |
|---|---|---|---|
| ALL | 155 | 51 | 0.1 - 175.0 (18.2) |
| 11P GAIN MUTATED | 12 | 8 | 1.1 - 21.3 (12.6) |
| 11P GAIN WILD-TYPE | 143 | 43 | 0.1 - 175.0 (20.3) |
Figure S3. Get High-res Image Gene #21: '11p gain' versus Clinical Feature #1: 'Time to Death'
P value = 0.000332 (logrank test), Q value = 0.1
Table S4. Gene #22: '11q gain' versus Clinical Feature #1: 'Time to Death'
| nPatients | nDeath | Duration Range (Median), Month | |
|---|---|---|---|
| ALL | 155 | 51 | 0.1 - 175.0 (18.2) |
| 11Q GAIN MUTATED | 11 | 7 | 1.1 - 24.3 (14.0) |
| 11Q GAIN WILD-TYPE | 144 | 44 | 0.1 - 175.0 (19.4) |
Figure S4. Get High-res Image Gene #22: '11q gain' versus Clinical Feature #1: 'Time to Death'
P value = 0.000559 (Wilcoxon-test), Q value = 0.17
Table S5. Gene #34: '19p gain' versus Clinical Feature #2: 'AGE'
| nPatients | Mean (Std.Dev) | |
|---|---|---|
| ALL | 156 | 61.5 (13.4) |
| 19P GAIN MUTATED | 47 | 66.9 (11.3) |
| 19P GAIN WILD-TYPE | 109 | 59.2 (13.7) |
Figure S5. Get High-res Image Gene #34: '19p gain' versus Clinical Feature #2: 'AGE'

P value = 0.000734 (Wilcoxon-test), Q value = 0.23
Table S6. Gene #37: '20q gain' versus Clinical Feature #2: 'AGE'
| nPatients | Mean (Std.Dev) | |
|---|---|---|
| ALL | 156 | 61.5 (13.4) |
| 20Q GAIN MUTATED | 53 | 66.7 (13.0) |
| 20Q GAIN WILD-TYPE | 103 | 58.8 (12.9) |
Figure S6. Get High-res Image Gene #37: '20q gain' versus Clinical Feature #2: 'AGE'
P value = 0.000181 (Fisher's exact test), Q value = 0.057
Table S7. Gene #59: '10p loss' versus Clinical Feature #3: 'GENDER'
| nPatients | FEMALE | MALE |
|---|---|---|
| ALL | 88 | 68 |
| 10P LOSS MUTATED | 53 | 20 |
| 10P LOSS WILD-TYPE | 35 | 48 |
Figure S7. Get High-res Image Gene #59: '10p loss' versus Clinical Feature #3: 'GENDER'
P value = 5.11e-05 (Fisher's exact test), Q value = 0.016
Table S8. Gene #60: '10q loss' versus Clinical Feature #3: 'GENDER'
| nPatients | FEMALE | MALE |
|---|---|---|
| ALL | 88 | 68 |
| 10Q LOSS MUTATED | 60 | 24 |
| 10Q LOSS WILD-TYPE | 28 | 44 |
Figure S8. Get High-res Image Gene #60: '10q loss' versus Clinical Feature #3: 'GENDER'
P value = 0.000106 (Wilcoxon-test), Q value = 0.034
Table S9. Gene #65: '13q loss' versus Clinical Feature #2: 'AGE'
| nPatients | Mean (Std.Dev) | |
|---|---|---|
| ALL | 156 | 61.5 (13.4) |
| 13Q LOSS MUTATED | 82 | 65.3 (12.7) |
| 13Q LOSS WILD-TYPE | 74 | 57.3 (13.1) |
Figure S9. Get High-res Image Gene #65: '13q loss' versus Clinical Feature #2: 'AGE'
-
Copy number data file = transformed.cor.cli.txt
-
Clinical data file = SARC-TP.merged_data.txt
-
Number of patients = 156
-
Number of significantly arm-level cnvs = 80
-
Number of selected clinical features = 4
-
Exclude regions that fewer than K tumors have mutations, K = 3
For survival clinical features, the Kaplan-Meier survival curves of tumors with and without gene mutations were plotted and the statistical significance P values were estimated by logrank test (Bland and Altman 2004) using the 'survdiff' function in R
For binary or multi-class clinical features (nominal or ordinal), two-tailed Fisher's exact tests (Fisher 1922) were used to estimate the P values using the 'fisher.test' function in R
For multiple hypothesis correction, Q value is the False Discovery Rate (FDR) analogue of the P value (Benjamini and Hochberg 1995), defined as the minimum FDR at which the test may be called significant. We used the 'Benjamini and Hochberg' method of 'p.adjust' function in R to convert P values into Q values.
In addition to the links below, the full results of the analysis summarized in this report can also be downloaded programmatically using firehose_get, or interactively from either the Broad GDAC website or TCGA Data Coordination Center Portal.