This pipeline computes the correlation between significant copy number variation (cnv focal) genes and selected clinical features.
Testing the association between copy number variation 66 focal events and 4 clinical features across 156 patients, 8 significant findings detected with Q value < 0.25.
-
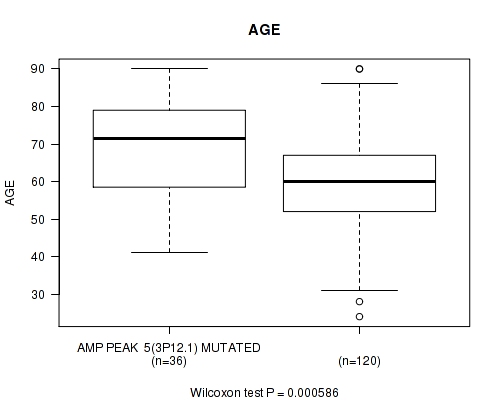
amp_3p12.1 cnv correlated to 'AGE'.
-
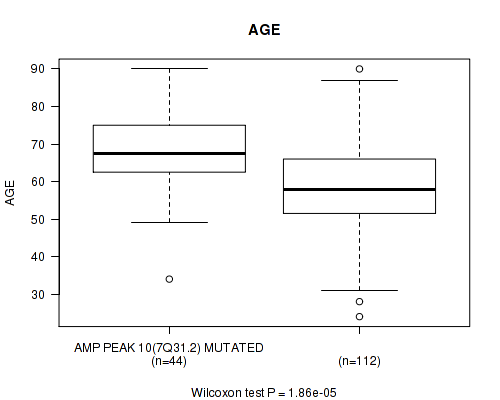
amp_7q31.2 cnv correlated to 'AGE'.
-
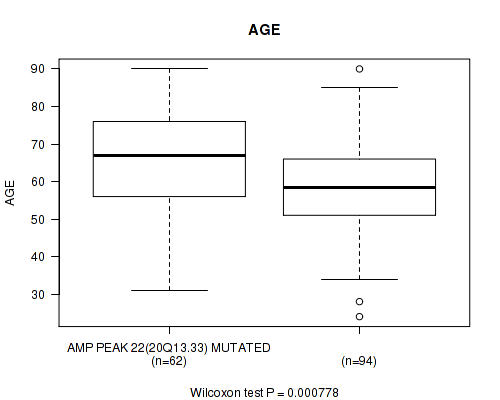
amp_20q13.33 cnv correlated to 'AGE'.
-
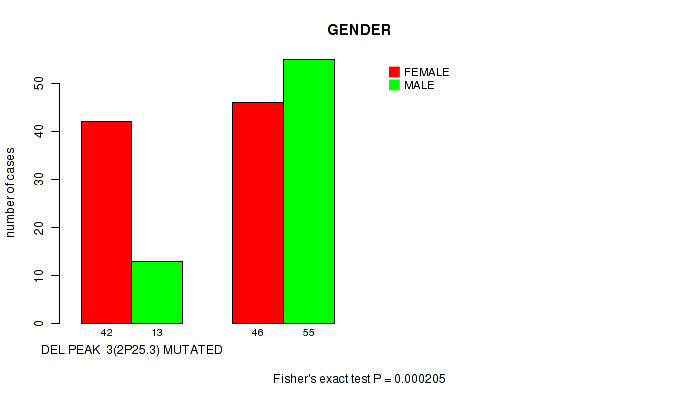
del_2p25.3 cnv correlated to 'GENDER'.
-
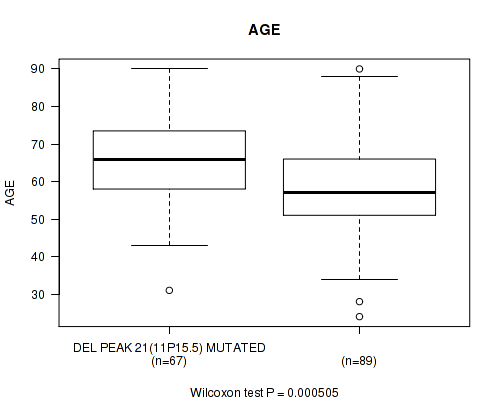
del_11p15.5 cnv correlated to 'AGE'.
-
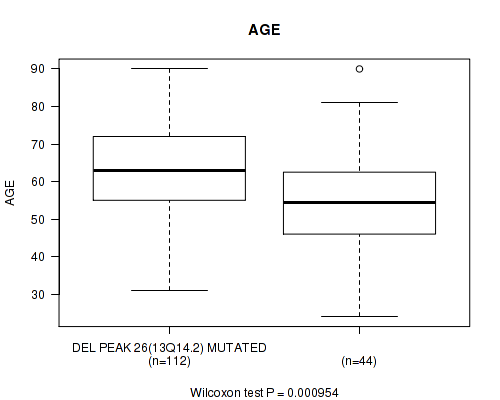
del_13q14.2 cnv correlated to 'AGE'.
-
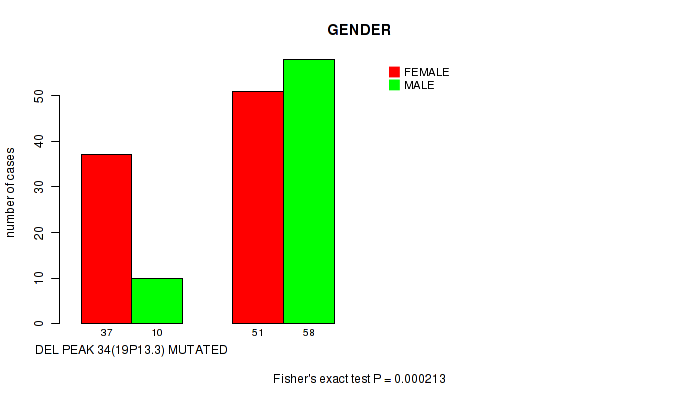
del_19p13.3 cnv correlated to 'GENDER'.
-
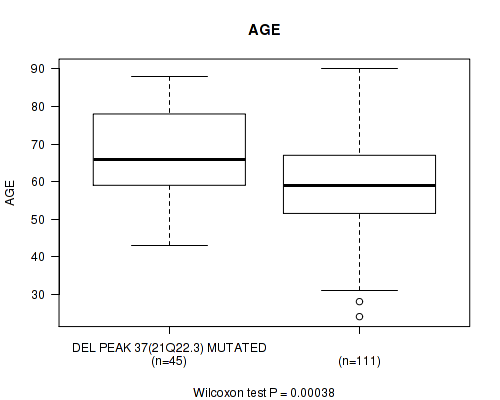
del_21q22.3 cnv correlated to 'AGE'.
Table 1. Get Full Table Overview of the association between significant copy number variation of 66 focal events and 4 clinical features. Shown in the table are P values (Q values). Thresholded by Q value < 0.25, 8 significant findings detected.
|
Clinical Features |
Time to Death |
AGE | GENDER | RACE | ||
| nCNV (%) | nWild-Type | logrank test | Wilcoxon-test | Fisher's exact test | Fisher's exact test | |
| amp 3p12 1 | 36 (23%) | 120 |
0.482 (1.00) |
0.000586 (0.152) |
0.251 (1.00) |
1 (1.00) |
| amp 7q31 2 | 44 (28%) | 112 |
0.175 (1.00) |
1.86e-05 (0.00491) |
0.858 (1.00) |
0.71 (1.00) |
| amp 20q13 33 | 62 (40%) | 94 |
0.249 (1.00) |
0.000778 (0.201) |
0.0692 (1.00) |
0.907 (1.00) |
| del 2p25 3 | 55 (35%) | 101 |
0.37 (1.00) |
0.18 (1.00) |
0.000205 (0.054) |
0.277 (1.00) |
| del 11p15 5 | 67 (43%) | 89 |
0.573 (1.00) |
0.000505 (0.131) |
0.33 (1.00) |
0.702 (1.00) |
| del 13q14 2 | 112 (72%) | 44 |
0.241 (1.00) |
0.000954 (0.245) |
0.0194 (1.00) |
0.48 (1.00) |
| del 19p13 3 | 47 (30%) | 109 |
0.416 (1.00) |
0.977 (1.00) |
0.000213 (0.0557) |
0.743 (1.00) |
| del 21q22 3 | 45 (29%) | 111 |
0.161 (1.00) |
0.00038 (0.0992) |
0.722 (1.00) |
0.812 (1.00) |
| amp 1p32 1 | 54 (35%) | 102 |
0.0589 (1.00) |
0.00754 (1.00) |
0.735 (1.00) |
0.324 (1.00) |
| amp 1q21 3 | 57 (37%) | 99 |
0.538 (1.00) |
0.0604 (1.00) |
0.132 (1.00) |
0.758 (1.00) |
| amp 1q24 3 | 66 (42%) | 90 |
0.968 (1.00) |
0.142 (1.00) |
0.871 (1.00) |
0.829 (1.00) |
| amp 2p11 2 | 35 (22%) | 121 |
0.846 (1.00) |
0.0431 (1.00) |
0.248 (1.00) |
0.031 (1.00) |
| amp 4q12 | 38 (24%) | 118 |
0.302 (1.00) |
0.0564 (1.00) |
0.579 (1.00) |
0.115 (1.00) |
| amp 5p15 33 | 70 (45%) | 86 |
0.127 (1.00) |
0.00228 (0.576) |
0.631 (1.00) |
0.831 (1.00) |
| amp 6p21 1 | 35 (22%) | 121 |
0.0276 (1.00) |
0.00852 (1.00) |
0.442 (1.00) |
0.525 (1.00) |
| amp 6q25 1 | 47 (30%) | 109 |
0.975 (1.00) |
0.0407 (1.00) |
0.224 (1.00) |
0.656 (1.00) |
| amp 8p11 22 | 49 (31%) | 107 |
0.0268 (1.00) |
0.00296 (0.746) |
0.297 (1.00) |
0.0226 (1.00) |
| amp 8q24 21 | 49 (31%) | 107 |
0.0779 (1.00) |
0.894 (1.00) |
0.488 (1.00) |
0.0468 (1.00) |
| amp 11q22 2 | 24 (15%) | 132 |
0.0826 (1.00) |
0.301 (1.00) |
0.51 (1.00) |
0.525 (1.00) |
| amp 12q15 | 60 (38%) | 96 |
0.251 (1.00) |
0.0854 (1.00) |
0.0126 (1.00) |
0.022 (1.00) |
| amp 13q34 | 29 (19%) | 127 |
0.592 (1.00) |
0.736 (1.00) |
0.0226 (1.00) |
0.0372 (1.00) |
| amp 15q26 3 | 50 (32%) | 106 |
0.203 (1.00) |
0.00951 (1.00) |
0.12 (1.00) |
0.258 (1.00) |
| amp 17p12 | 61 (39%) | 95 |
0.661 (1.00) |
0.0387 (1.00) |
0.251 (1.00) |
0.572 (1.00) |
| amp 17p11 2 | 61 (39%) | 95 |
0.399 (1.00) |
0.0508 (1.00) |
0.0326 (1.00) |
0.527 (1.00) |
| amp 17q24 3 | 46 (29%) | 110 |
0.269 (1.00) |
0.0485 (1.00) |
0.00474 (1.00) |
0.36 (1.00) |
| amp 19p13 2 | 57 (37%) | 99 |
0.662 (1.00) |
0.194 (1.00) |
0.318 (1.00) |
1 (1.00) |
| amp 19q12 | 54 (35%) | 102 |
0.0499 (1.00) |
0.0014 (0.358) |
0.867 (1.00) |
0.665 (1.00) |
| amp 21q21 1 | 46 (29%) | 110 |
0.208 (1.00) |
0.054 (1.00) |
0.215 (1.00) |
1 (1.00) |
| amp xp21 2 | 57 (37%) | 99 |
0.72 (1.00) |
0.579 (1.00) |
0.616 (1.00) |
0.564 (1.00) |
| amp xq21 1 | 27 (17%) | 129 |
0.107 (1.00) |
0.0343 (1.00) |
0.832 (1.00) |
0.397 (1.00) |
| del 1p36 32 | 47 (30%) | 109 |
0.0132 (1.00) |
0.329 (1.00) |
0.0779 (1.00) |
1 (1.00) |
| del 1q44 | 44 (28%) | 112 |
0.469 (1.00) |
0.0342 (1.00) |
0.477 (1.00) |
0.305 (1.00) |
| del 2q37 3 | 59 (38%) | 97 |
0.0611 (1.00) |
0.27 (1.00) |
0.408 (1.00) |
0.758 (1.00) |
| del 2q37 3 | 62 (40%) | 94 |
0.247 (1.00) |
0.0866 (1.00) |
0.328 (1.00) |
0.907 (1.00) |
| del 3p21 31 | 37 (24%) | 119 |
0.759 (1.00) |
0.164 (1.00) |
0.708 (1.00) |
0.225 (1.00) |
| del 3q13 31 | 31 (20%) | 125 |
0.0866 (1.00) |
0.00167 (0.424) |
0.843 (1.00) |
0.87 (1.00) |
| del 3q29 | 36 (23%) | 120 |
0.555 (1.00) |
0.366 (1.00) |
0.702 (1.00) |
0.353 (1.00) |
| del 4q35 1 | 56 (36%) | 100 |
0.177 (1.00) |
0.0108 (1.00) |
0.501 (1.00) |
0.131 (1.00) |
| del 5p15 33 | 20 (13%) | 136 |
0.701 (1.00) |
0.563 (1.00) |
0.232 (1.00) |
0.815 (1.00) |
| del 6p25 3 | 50 (32%) | 106 |
0.466 (1.00) |
0.247 (1.00) |
0.389 (1.00) |
0.665 (1.00) |
| del 6q14 1 | 44 (28%) | 112 |
0.814 (1.00) |
0.212 (1.00) |
0.477 (1.00) |
1 (1.00) |
| del 7q36 3 | 44 (28%) | 112 |
0.951 (1.00) |
0.561 (1.00) |
1 (1.00) |
0.223 (1.00) |
| del 8p23 3 | 46 (29%) | 110 |
0.28 (1.00) |
0.283 (1.00) |
0.86 (1.00) |
0.897 (1.00) |
| del 9p24 3 | 59 (38%) | 97 |
0.868 (1.00) |
0.00392 (0.983) |
0.246 (1.00) |
0.909 (1.00) |
| del 9p21 3 | 69 (44%) | 87 |
0.657 (1.00) |
0.0115 (1.00) |
0.334 (1.00) |
0.201 (1.00) |
| del 9q34 3 | 38 (24%) | 118 |
0.284 (1.00) |
0.147 (1.00) |
0.354 (1.00) |
0.196 (1.00) |
| del 10p15 3 | 80 (51%) | 76 |
0.254 (1.00) |
0.089 (1.00) |
0.0755 (1.00) |
0.361 (1.00) |
| del 10q23 31 | 88 (56%) | 68 |
0.419 (1.00) |
0.169 (1.00) |
0.00903 (1.00) |
0.0915 (1.00) |
| del 10q26 3 | 84 (54%) | 72 |
0.59 (1.00) |
0.0566 (1.00) |
0.0157 (1.00) |
0.381 (1.00) |
| del 11q24 2 | 70 (45%) | 86 |
0.722 (1.00) |
0.00552 (1.00) |
1 (1.00) |
0.481 (1.00) |
| del 12p13 1 | 53 (34%) | 103 |
0.429 (1.00) |
0.259 (1.00) |
0.125 (1.00) |
0.596 (1.00) |
| del 12q12 | 34 (22%) | 122 |
0.276 (1.00) |
0.608 (1.00) |
0.559 (1.00) |
0.485 (1.00) |
| del 12q24 33 | 44 (28%) | 112 |
0.318 (1.00) |
0.0528 (1.00) |
0.591 (1.00) |
0.412 (1.00) |
| del 14q24 1 | 48 (31%) | 108 |
0.179 (1.00) |
0.587 (1.00) |
0.382 (1.00) |
0.733 (1.00) |
| del 16q11 2 | 78 (50%) | 78 |
0.748 (1.00) |
0.159 (1.00) |
0.0754 (1.00) |
0.202 (1.00) |
| del 16q23 1 | 85 (54%) | 71 |
0.493 (1.00) |
0.00118 (0.302) |
0.0539 (1.00) |
0.472 (1.00) |
| del 17p13 1 | 74 (47%) | 82 |
0.608 (1.00) |
0.488 (1.00) |
0.00967 (1.00) |
0.765 (1.00) |
| del 17q11 2 | 41 (26%) | 115 |
0.356 (1.00) |
0.0659 (1.00) |
0.583 (1.00) |
1 (1.00) |
| del 17q25 3 | 40 (26%) | 116 |
0.0527 (1.00) |
0.0425 (1.00) |
0.584 (1.00) |
1 (1.00) |
| del 18q23 | 49 (31%) | 107 |
0.127 (1.00) |
0.00405 (1.00) |
0.164 (1.00) |
0.904 (1.00) |
| del 19q13 43 | 61 (39%) | 95 |
0.881 (1.00) |
0.448 (1.00) |
0.251 (1.00) |
0.698 (1.00) |
| del 21q11 2 | 32 (21%) | 124 |
0.344 (1.00) |
0.0956 (1.00) |
0.842 (1.00) |
0.669 (1.00) |
| del 22q13 32 | 52 (33%) | 104 |
0.517 (1.00) |
0.274 (1.00) |
0.0607 (1.00) |
1 (1.00) |
| del xp21 1 | 36 (23%) | 120 |
0.518 (1.00) |
0.634 (1.00) |
0.183 (1.00) |
0.535 (1.00) |
| del xq21 1 | 79 (51%) | 77 |
0.0189 (1.00) |
0.268 (1.00) |
0.0523 (1.00) |
0.224 (1.00) |
| del xq22 3 | 78 (50%) | 78 |
0.0718 (1.00) |
0.927 (1.00) |
0.146 (1.00) |
0.487 (1.00) |
P value = 0.000586 (Wilcoxon-test), Q value = 0.15
Table S1. Gene #5: 'amp_3p12.1' versus Clinical Feature #2: 'AGE'
| nPatients | Mean (Std.Dev) | |
|---|---|---|
| ALL | 156 | 61.5 (13.4) |
| AMP PEAK 5(3P12.1) MUTATED | 36 | 68.4 (13.5) |
| AMP PEAK 5(3P12.1) WILD-TYPE | 120 | 59.4 (12.8) |
Figure S1. Get High-res Image Gene #5: 'amp_3p12.1' versus Clinical Feature #2: 'AGE'
P value = 1.86e-05 (Wilcoxon-test), Q value = 0.0049
Table S2. Gene #10: 'amp_7q31.2' versus Clinical Feature #2: 'AGE'
| nPatients | Mean (Std.Dev) | |
|---|---|---|
| ALL | 156 | 61.5 (13.4) |
| AMP PEAK 10(7Q31.2) MUTATED | 44 | 68.4 (11.6) |
| AMP PEAK 10(7Q31.2) WILD-TYPE | 112 | 58.8 (13.2) |
Figure S2. Get High-res Image Gene #10: 'amp_7q31.2' versus Clinical Feature #2: 'AGE'
P value = 0.000778 (Wilcoxon-test), Q value = 0.2
Table S3. Gene #22: 'amp_20q13.33' versus Clinical Feature #2: 'AGE'
| nPatients | Mean (Std.Dev) | |
|---|---|---|
| ALL | 156 | 61.5 (13.4) |
| AMP PEAK 22(20Q13.33) MUTATED | 62 | 66.1 (13.4) |
| AMP PEAK 22(20Q13.33) WILD-TYPE | 94 | 58.5 (12.6) |
Figure S3. Get High-res Image Gene #22: 'amp_20q13.33' versus Clinical Feature #2: 'AGE'
P value = 0.000205 (Fisher's exact test), Q value = 0.054
Table S4. Gene #28: 'del_2p25.3' versus Clinical Feature #3: 'GENDER'
| nPatients | FEMALE | MALE |
|---|---|---|
| ALL | 88 | 68 |
| DEL PEAK 3(2P25.3) MUTATED | 42 | 13 |
| DEL PEAK 3(2P25.3) WILD-TYPE | 46 | 55 |
Figure S4. Get High-res Image Gene #28: 'del_2p25.3' versus Clinical Feature #3: 'GENDER'
P value = 0.000505 (Wilcoxon-test), Q value = 0.13
Table S5. Gene #46: 'del_11p15.5' versus Clinical Feature #2: 'AGE'
| nPatients | Mean (Std.Dev) | |
|---|---|---|
| ALL | 156 | 61.5 (13.4) |
| DEL PEAK 21(11P15.5) MUTATED | 67 | 65.6 (11.9) |
| DEL PEAK 21(11P15.5) WILD-TYPE | 89 | 58.4 (13.7) |
Figure S5. Get High-res Image Gene #46: 'del_11p15.5' versus Clinical Feature #2: 'AGE'
P value = 0.000954 (Wilcoxon-test), Q value = 0.25
Table S6. Gene #51: 'del_13q14.2' versus Clinical Feature #2: 'AGE'
| nPatients | Mean (Std.Dev) | |
|---|---|---|
| ALL | 156 | 61.5 (13.4) |
| DEL PEAK 26(13Q14.2) MUTATED | 112 | 63.7 (12.5) |
| DEL PEAK 26(13Q14.2) WILD-TYPE | 44 | 56.0 (14.4) |
Figure S6. Get High-res Image Gene #51: 'del_13q14.2' versus Clinical Feature #2: 'AGE'
P value = 0.000213 (Fisher's exact test), Q value = 0.056
Table S7. Gene #59: 'del_19p13.3' versus Clinical Feature #3: 'GENDER'
| nPatients | FEMALE | MALE |
|---|---|---|
| ALL | 88 | 68 |
| DEL PEAK 34(19P13.3) MUTATED | 37 | 10 |
| DEL PEAK 34(19P13.3) WILD-TYPE | 51 | 58 |
Figure S7. Get High-res Image Gene #59: 'del_19p13.3' versus Clinical Feature #3: 'GENDER'
P value = 0.00038 (Wilcoxon-test), Q value = 0.099
Table S8. Gene #62: 'del_21q22.3' versus Clinical Feature #2: 'AGE'
| nPatients | Mean (Std.Dev) | |
|---|---|---|
| ALL | 156 | 61.5 (13.4) |
| DEL PEAK 37(21Q22.3) MUTATED | 45 | 67.4 (11.6) |
| DEL PEAK 37(21Q22.3) WILD-TYPE | 111 | 59.1 (13.4) |
Figure S8. Get High-res Image Gene #62: 'del_21q22.3' versus Clinical Feature #2: 'AGE'
-
Copy number data file = transformed.cor.cli.txt
-
Clinical data file = SARC-TP.merged_data.txt
-
Number of patients = 156
-
Number of significantly focal cnvs = 66
-
Number of selected clinical features = 4
-
Exclude genes that fewer than K tumors have mutations, K = 3
For survival clinical features, the Kaplan-Meier survival curves of tumors with and without gene mutations were plotted and the statistical significance P values were estimated by logrank test (Bland and Altman 2004) using the 'survdiff' function in R
For binary or multi-class clinical features (nominal or ordinal), two-tailed Fisher's exact tests (Fisher 1922) were used to estimate the P values using the 'fisher.test' function in R
For multiple hypothesis correction, Q value is the False Discovery Rate (FDR) analogue of the P value (Benjamini and Hochberg 1995), defined as the minimum FDR at which the test may be called significant. We used the 'Benjamini and Hochberg' method of 'p.adjust' function in R to convert P values into Q values.
In addition to the links below, the full results of the analysis summarized in this report can also be downloaded programmatically using firehose_get, or interactively from either the Broad GDAC website or TCGA Data Coordination Center Portal.