GISTIC identifies genomic regions that are significantly gained or lost across a set of tumors. The pipeline first filters out normal samples from the segmented copy-number data by inspecting the TCGA barcodes and then executes GISTIC version 2.0.21 (Firehose task version: 127).
There were 97 tumor samples used in this analysis: 9 significant arm-level results, 0 significant focal amplifications, and 0 significant focal deletions were found.
Figure 1. Genomic positions of amplified regions: the X-axis represents the normalized amplification signals (top) and significance by Q value (bottom). The green line represents the significance cutoff at Q value=0.25.
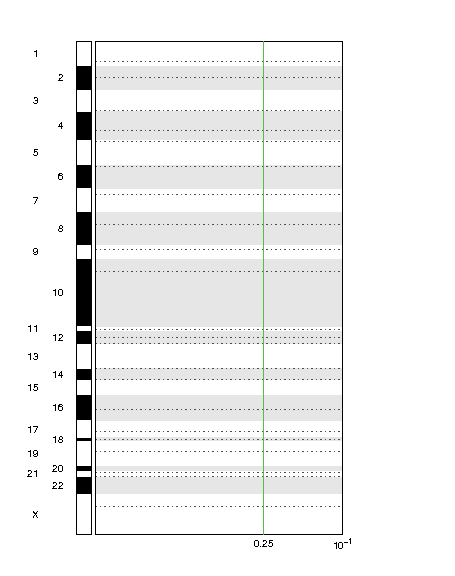
Figure 2. Genomic positions of deleted regions: the X-axis represents the normalized deletion signals (top) and significance by Q value (bottom). The green line represents the significance cutoff at Q value=0.25.
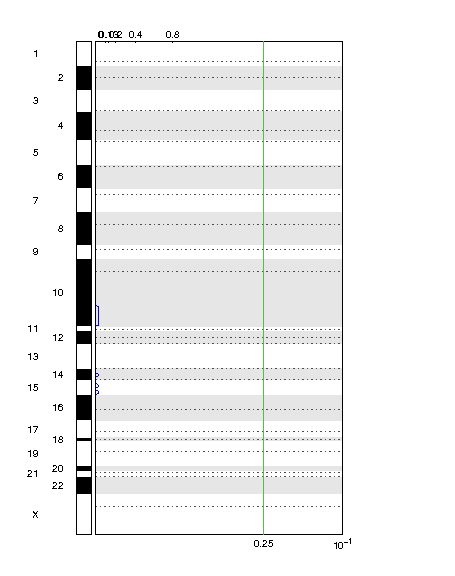
Table 1. Get Full Table Arm-level significance table - 9 significant results found. The significance cutoff is at Q value=0.25.
| Arm | # Genes | Amp Frequency | Amp Z score | Amp Q value | Del Frequency | Del Z score | Del Q value |
|---|---|---|---|---|---|---|---|
| 1p | 1300 | 0.00 | -1.41 | 0.92 | 0.03 | 0.715 | 0.741 |
| 1q | 1195 | 0.00 | -1.4 | 0.92 | 0.03 | 0.734 | 0.741 |
| 2p | 624 | 0.00 | -1.34 | 0.92 | 0.06 | 3.06 | 0.0109 |
| 2q | 967 | 0.00 | -1.36 | 0.92 | 0.06 | 2.95 | 0.0122 |
| 3p | 644 | 0.02 | 0.126 | 0.92 | 0.02 | 0.126 | 0.741 |
| 3q | 733 | 0.02 | 0.113 | 0.92 | 0.02 | 0.113 | 0.741 |
| 4p | 289 | 0.01 | -0.58 | 0.92 | 0.02 | 0.166 | 0.741 |
| 4q | 670 | 0.01 | -0.623 | 0.92 | 0.02 | 0.107 | 0.741 |
| 5p | 183 | 0.03 | 0.925 | 0.702 | 0.00 | -1.32 | 0.919 |
| 5q | 905 | 0.03 | 0.786 | 0.702 | 0.00 | -1.38 | 0.919 |
| 6p | 710 | 0.00 | -1.37 | 0.92 | 0.02 | 0.0864 | 0.741 |
| 6q | 556 | 0.00 | -1.36 | 0.92 | 0.02 | 0.11 | 0.741 |
| 7p | 389 | 0.06 | 3.16 | 0.0154 | 0.01 | -0.546 | 0.882 |
| 7q | 783 | 0.06 | 3.04 | 0.0154 | 0.01 | -0.59 | 0.882 |
| 8p | 338 | 0.00 | -1.34 | 0.92 | 0.02 | 0.143 | 0.741 |
| 8q | 551 | 0.00 | -1.36 | 0.92 | 0.02 | 0.11 | 0.741 |
| 9p | 301 | 0.01 | -0.536 | 0.92 | 0.06 | 3.19 | 0.0109 |
| 9q | 700 | 0.01 | -0.581 | 0.92 | 0.06 | 3.06 | 0.0109 |
| 10p | 253 | 0.01 | -0.564 | 0.92 | 0.03 | 0.929 | 0.741 |
| 10q | 738 | 0.01 | -0.608 | 0.92 | 0.04 | 1.57 | 0.281 |
| 11p | 509 | 0.01 | -0.605 | 0.92 | 0.02 | 0.132 | 0.741 |
| 11q | 975 | 0.01 | -0.657 | 0.92 | 0.02 | 0.0621 | 0.741 |
| 12p | 339 | 0.03 | 0.912 | 0.702 | 0.01 | -0.574 | 0.882 |
| 12q | 904 | 0.03 | 0.805 | 0.702 | 0.01 | -0.638 | 0.882 |
| 13q | 560 | 0.01 | -0.577 | 0.92 | 0.05 | 2.36 | 0.0593 |
| 14q | 938 | 0.01 | -0.675 | 0.92 | 0.00 | -1.4 | 0.919 |
| 15q | 810 | 0.00 | -1.37 | 0.92 | 0.03 | 0.804 | 0.741 |
| 16p | 559 | 0.03 | 0.851 | 0.702 | 0.00 | -1.35 | 0.919 |
| 16q | 455 | 0.03 | 0.871 | 0.702 | 0.00 | -1.35 | 0.919 |
| 17p | 415 | 0.03 | 0.916 | 0.702 | 0.02 | 0.176 | 0.741 |
| 17q | 972 | 0.03 | 0.811 | 0.702 | 0.02 | 0.0926 | 0.741 |
| 18p | 104 | 0.00 | -1.33 | 0.92 | 0.01 | -0.58 | 0.882 |
| 18q | 275 | 0.00 | -1.35 | 0.92 | 0.01 | -0.6 | 0.882 |
| 19p | 681 | 0.01 | -0.635 | 0.92 | 0.01 | -0.635 | 0.882 |
| 19q | 935 | 0.01 | -0.664 | 0.92 | 0.01 | -0.664 | 0.882 |
| 20p | 234 | 0.04 | 1.67 | 0.464 | 0.00 | -1.32 | 0.919 |
| 21q | 258 | 0.00 | -1.34 | 0.92 | 0.02 | 0.156 | 0.741 |
| 22q | 564 | 0.00 | -1.28 | 0.92 | 0.13 | 8.27 | 4.33e-15 |
| Xq | 668 | 0.06 | 3.17 | 0.0154 | 0.04 | 1.71 | 0.245 |
-
Segmentation File: The segmentation file contains the segmented data for all the samples identified by GLAD, CBS, or some other segmentation algorithm. (See GLAD file format in the Genepattern file formats documentation.) It is a six column, tab-delimited file with an optional first line identifying the columns. Positions are in base pair units.The column headers are: (1) Sample (sample name), (2) Chromosome (chromosome number), (3) Start Position (segment start position, in bases), (4) End Position (segment end position, in bases), (5) Num markers (number of markers in segment), (6) Seg.CN (log2() -1 of copy number).
-
Markers File: The markers file identifies the marker names and positions of the markers in the original dataset (before segmentation). It is a three column, tab-delimited file with an optional header. The column headers are: (1) Marker Name, (2) Chromosome, (3) Marker Position (in bases).
-
Reference Genome: The reference genome file contains information about the location of genes and cytobands on a given build of the genome. Reference genome files are created in Matlab and are not viewable with a text editor.
-
CNV Files: There are two options for the cnv file. The first option allows CNVs to be identified by marker name. The second option allows the CNVs to be identified by genomic location. Option #1: A two column, tab-delimited file with an optional header row. The marker names given in this file must match the marker names given in the markers file. The CNV identifiers are for user use and can be arbitrary. The column headers are: (1) Marker Name, (2) CNV Identifier. Option #2: A 6 column, tab-delimited file with an optional header row. The 'CNV Identifier' is for user use and can be arbitrary. 'Narrow Region Start' and 'Narrow Region End' are also not used. The column headers are: (1) CNV Identifier, (2) Chromosome, (3) Narrow Region Start, (4) Narrow Region End, (5) Wide Region Start, (6) Wide Region End
-
Amplification Threshold: Threshold for copy number amplifications. Regions with a log2 ratio above this value are considered amplified.
-
Deletion Threshold: Threshold for copy number deletions. Regions with a log2 ratio below the negative of this value are considered deletions.
-
Cap Values: Minimum and maximum cap values on analyzed data. Regions with a log2 ratio greater than the cap are set to the cap value; regions with a log2 ratio less than -cap value are set to -cap. Values must be positive.
-
Broad Length Cutoff: Threshold used to distinguish broad from focal events, given in units of fraction of chromosome arm.
-
Remove X-Chromosome: Flag indicating whether to remove data from the X-chromosome before analysis. Allowed values= {1,0} (1: Remove X-Chromosome, 0: Do not remove X-Chromosome.
-
Confidence Level: Confidence level used to calculate the region containing a driver.
-
Join Segment Size: Smallest number of markers to allow in segments from the segmented data. Segments that contain fewer than this number of markers are joined to the neighboring segment that is closest in copy number.
-
Arm Level Peel Off: Flag set to enable arm-level peel-off of events during peak definition. The arm-level peel-off enhancement to the arbitrated peel-off method assigns all events in the same chromosome arm of the same sample to a single peak. It is useful when peaks are split by noise or chromothripsis. Allowed values= {1,0} (1: Use arm level peel off, 0: Use normal arbitrated peel-off).
-
Maximum Sample Segments: Maximum number of segments allowed for a sample in the input data. Samples with more segments than this threshold are excluded from the analysis.
-
Gene GISTIC: When enabled (value = 1), this option causes GISTIC to analyze deletions using genes instead of array markers to locate the lesion. In this mode, the copy number assigned to a gene is the lowest copy number among the markers that represent the gene.
List of inputs used for this run of GISTIC2. All files listed should be included in the archived results.
-
Segmentation File = /xchip/cga/gdac-prod/tcga-gdac/jobResults/PrepareGisticDNASeq/THCA-TP/11542090/segmentationfile.txt
-
Markers File = /xchip/cga/gdac-prod/tcga-gdac/jobResults/PrepareGisticDNASeq/THCA-TP/11542090/markersfile.txt
-
Reference Genome = /xchip/cga/reference/gistic2/hg19_GENCODE_v18_20140127.mat
-
CNV Files = /xchip/cga/reference/gistic2/CNV.hg19.bypos.111213.txt
-
Amplification Threshold = 0.3
-
Deletion Threshold = 0.3
-
Cap Values = 2
-
Broad Length Cutoff = 0.5
-
Remove X-Chromosome = 0
-
Confidence Level = 0.99
-
Join Segment Size = 10
-
Arm Level Peel Off = 1
-
Maximum Sample Segments = 10000
-
Gene GISTIC = 0
Table 2. Get Full Table First 10 out of 97 Input Tumor Samples.
| Tumor Sample Names |
|---|
| TCGA-BJ-A0Z2-01A-11D-A10R-02 |
| TCGA-BJ-A0Z3-01A-11D-A13U-02 |
| TCGA-BJ-A0Z5-01A-11D-A10R-02 |
| TCGA-BJ-A0Z9-01A-11D-A10R-02 |
| TCGA-BJ-A0ZA-01A-11D-A10R-02 |
| TCGA-BJ-A0ZB-01A-11D-A10R-02 |
| TCGA-BJ-A0ZC-01A-12D-A13U-02 |
| TCGA-BJ-A0ZE-01A-11D-A10R-02 |
| TCGA-BJ-A0ZG-01A-11D-A10R-02 |
| TCGA-BJ-A0ZH-01A-11D-A10R-02 |
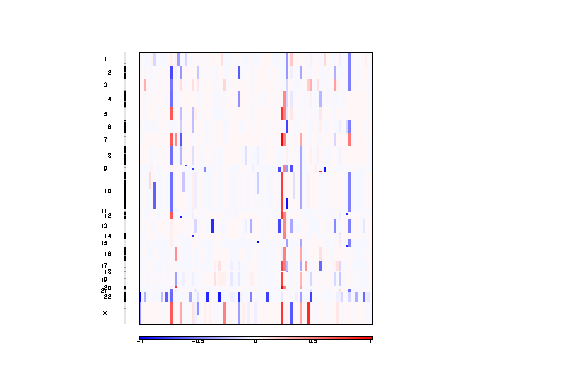
Figure 3. Segmented copy number profiles in the input data
The all lesions file summarizes the results from the GISTIC run. It contains data about the significant regions of amplification and deletion as well as which samples are amplified or deleted in each of these regions. The identified regions are listed down the first column, and the samples are listed across the first row, starting in column 10.
Region Data
Columns 1-9 present the data about the significant regions as follows:
-
Unique Name: A name assigned to identify the region.
-
Descriptor: The genomic descriptor of that region.
-
Wide Peak Limits: The 'wide peak' boundaries most likely to contain the targeted genes. These are listed in genomic coordinates and marker (or probe) indices.
-
Peak Limits: The boundaries of the region of maximal amplification or deletion.
-
Region Limits: The boundaries of the entire significant region of amplification or deletion.
-
Q values: The Q value of the peak region.
-
Residual Q values: The Q value of the peak region after removing ('peeling off') amplifications or deletions that overlap other, more significant peak regions in the same chromosome.
-
Broad or Focal: Identifies whether the region reaches significance due primarily to broad events (called 'broad'), focal events (called 'focal'), or independently significant broad and focal events (called 'both').
-
Amplitude Threshold: Key giving the meaning of values in the subsequent columns associated with each sample.
Sample Data
Each of the analyzed samples is represented in one of the columns following the lesion data (columns 10 through end). The data contained in these columns varies slightly by section of the file. The first section can be identified by the key given in column 9 - it starts in row 2 and continues until the row that reads 'Actual Copy Change Given.' This section contains summarized data for each sample. A '0' indicates that the copy number of the sample was not amplified or deleted beyond the threshold amount in that peak region. A '1' indicates that the sample had low-level copy number aberrations (exceeding the low threshold indicated in column 9), and a '2' indicates that the sample had high-level copy number aberrations (exceeding the high threshold indicated in column 9).The second section can be identified the rows in which column 9 reads 'Actual Copy Change Given.' The second section exactly reproduces the first section, except that here the actual changes in copy number are provided rather than zeroes, ones, and twos.The final section is similar to the first section, except that here only broad events are included. A 1 in the samples columns (columns 10+) indicates that the median copy number of the sample across the entire significant region exceeded the threshold given in column 9. That is, it indicates whether the sample had a geographically extended event, rather than a focal amplification or deletion covering little more than the peak region.
The amp genes file contains one column for each amplification peak identified in the GISTIC analysis. The first four rows are:
-
Cytoband
-
Q value
-
Residual Q value
-
Wide Peak Boundaries
These rows identify the lesion in the same way as the all lesions file.The remaining rows list the genes contained in each wide peak. For peaks that contain no genes, the nearest gene is listed in brackets.
The del genes file contains one column for each deletion peak identified in the GISTIC analysis. The file format for the del genes file is identical to the format for the amp genes file.
The scores file lists the Q values [presented as -log10(q)], G scores, average amplitudes among aberrant samples, and frequency of aberration, across the genome for both amplifications and deletions. The scores file is viewable with the Genepattern SNPViewer module and may be imported into the Integrated Genomics Viewer (IGV).
The segmented copy number is a pdf file containing a colormap image of the segmented copy number profiles in the input data.
The amplification pdf is a plot of the G scores (top) and Q values (bottom) with respect to amplifications for all markers over the entire region analyzed.
The deletion pdf is a plot of the G scores (top) and Q values (bottom) with respect to deletions for all markers over the entire region analyzed.
Tables of basic information about the genomic regions (peaks) that GISTIC determined to be significantly amplified or deleted. These describe three kinds of peak boundaries, and list the genes contained in two of them. The region start and region end columns (along with the chromosome column) delimit the entire area containing the peak that is above the significance level. The region may be the same for multiple peaks. The peak start and end delimit the maximum value of the peak. The extended peak is the peak determined by robust, and is contained within the wide peak reported in {amp|del}_genes.txt by one marker.
A table of per-arm statistical results for the data set. Each arm is a row in the table. The first column specifies the arm and the second column counts the number of genes known to be on the arm. For both amplification and deletion, the table has columns for the frequency of amplification or deletion of the arm, and a Z score and Q value.
A table of chromosome arm amplification levels for each sample. Each row is a chromosome arm, and each column a sample. The data are in units of absolute copy number -2.
A gene-level table of copy number values for all samples. Each row is the data for a gene. The first three columns name the gene, its NIH locus ID, and its cytoband - the remaining columns are the samples. The copy number values in the table are in units of (copy number -2), so that no amplification or deletion is 0, genes with amplifications have positive values, and genes with deletions are negative values. The data are converted from marker level to gene level using the extreme method: a gene is assigned the greatest amplification or the least deletion value among the markers it covers.
A gene-level table of copy number data similar to the all_data_by_genes.txt output, but using only broad events with lengths greater than the broad length cutoff. The structure of the file and the methods and units used for the data analysis are otherwise identical to all_data_by_genes.txt.
A gene-level table of copy number data similar to the all_data_by_genes.txt output, but using only focal events with lengths greater than the focal length cutoff. The structure of the file and the methods and units used for the data analysis are otherwise identical to all_data_by_genes.txt.
A gene-level table of discrete amplification and deletion indicators at for all samples. There is a row for each gene. The first three columns name the gene, its NIH locus ID, and its cytoband - the remaining columns are the samples. A table value of 0 means no amplification or deletion above the threshold. Amplifications are positive numbers: 1 means amplification above the amplification threshold; 2 means amplifications larger to the arm level amplifications observed for the sample. Deletions are represented by negative table values: -1 represents deletion beyond the threshold; -2 means deletions greater than the minimum arm-level deletion observed for the sample.
A table of the per-sample threshold cutoffs (in units of absolute copy number -2) used to distinguish the high level amplifications (+/-2) from ordinary amplifications (+/-1) in the all_thresholded.by_genes.txt output file. The table contains three columns: the sample identifier followed by the low (deletion) and high (amplification) cutoff values. The cutoffs are calculated as the minimum arm-level amplification level less the deletion threshold for deletions and the maximum arm-level amplification plus the amplification threshold for amplifications.
A list of copy number segments describing just the focal events present in the data. The segment amplification/deletion levels are in units of (copy number -2), with amplifications positive and deletions negative numbers. This file may be viewed with IGV.
An image showing the correlation between gene counts and frequency of copy number alterations.
A file indicating the position of the confidence intervals around GISTIC peaks that can be loaded as a track in a compatible viewer browser such as IGV or the UCSC genome browser.
GISTIC identifies genomic regions that are significantly gained or lost across a set of tumors. It takes segmented copy number ratios as input, separates arm-level events from focal events, and then performs two tests: (i) identifies significantly amplified/deleted chromosome arms; and (ii) identifies regions that are significantly focally amplified or deleted. For the focal analysis, the significance levels (Q values) are calculated by comparing the observed gains/losses at each locus to those obtained by randomly permuting the events along the genome to reflect the null hypothesis that they are all 'passengers' and could have occurred anywhere. The locus-specific significance levels are then corrected for multiple hypothesis testing. The arm-level significance is calculated by comparing the frequency of gains/losses of each arm to the expected rate given its size. The method outputs genomic views of significantly amplified and deleted regions, as well as a table of genes with gain or loss scores. A more in depth discussion of the GISTIC algorithm and its utility is given in [1], [3], and [5].
Regions of the genome that are prone to germ line variations in copy number are excluded from the GISTIC analysis using a list of germ line copy number variations (CNVs). A CNV is a DNA sequence that may be found at different copy numbers in the germ line of two different individuals. Such germ line variations can confound a GISTIC analysis, which finds significant somatic copy number variations in cancer. A more in depth discussion is provided in [6]. GISTIC currently uses two CNV exclusion lists. One is based on the literature describing copy number variation, and a second one comes from an analysis of significant variations among the blood normals in the TCGA data set.
In addition to the links below, the full results of the analysis summarized in this report can also be downloaded programmatically using firehose_get, or interactively from either the Broad GDAC website or TCGA Data Coordination Center Portal.