This pipeline computes the correlation between significantly recurrent gene mutations and selected clinical features.
Testing the association between mutation status of 11 genes and 17 clinical features across 398 patients, 9 significant findings detected with Q value < 0.25.
-
BRAF mutation correlated to 'NEOPLASM.DISEASESTAGE', 'PATHOLOGY.T.STAGE', 'PATHOLOGY.N.STAGE', 'HISTOLOGICAL.TYPE', and 'EXTRATHYROIDAL.EXTENSION'.
-
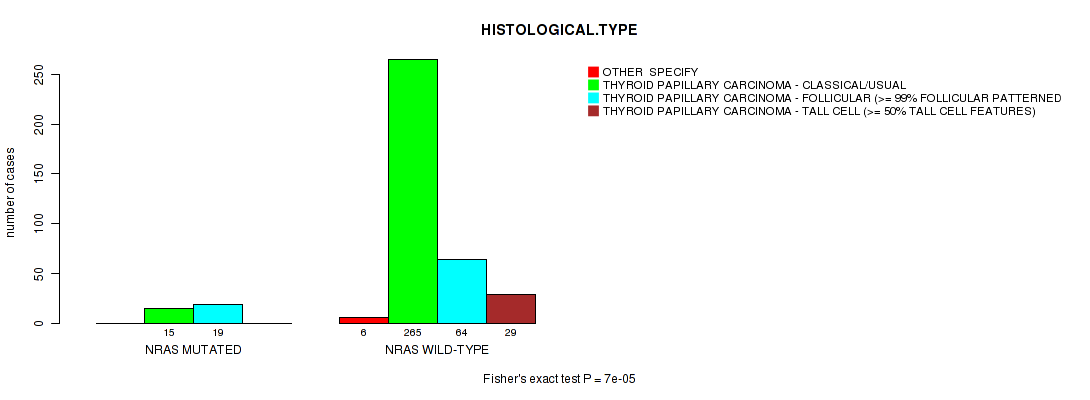
NRAS mutation correlated to 'PATHOLOGY.N.STAGE' and 'HISTOLOGICAL.TYPE'.
-
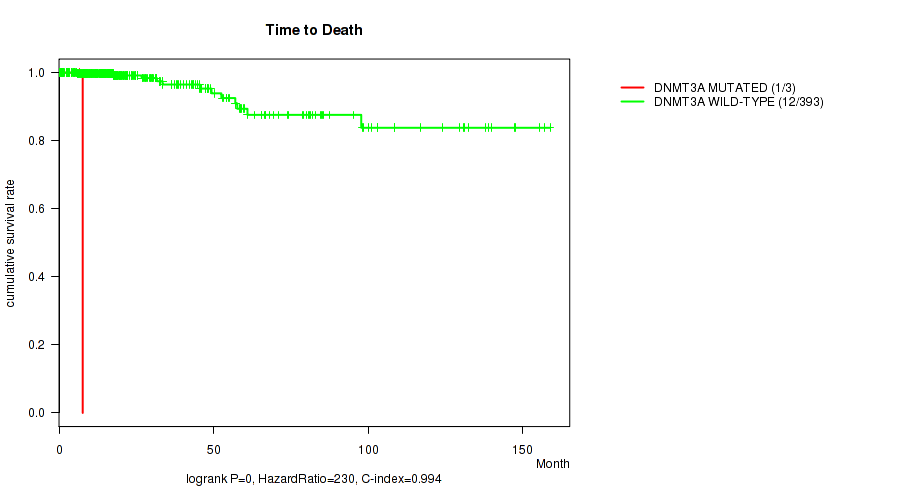
DNMT3A mutation correlated to 'Time to Death'.
-
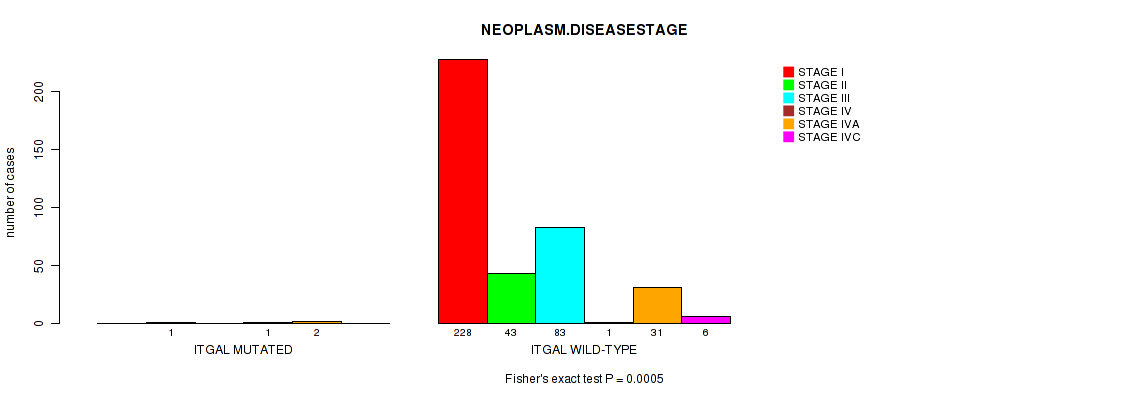
ITGAL mutation correlated to 'NEOPLASM.DISEASESTAGE'.
Table 1. Get Full Table Overview of the association between mutation status of 11 genes and 17 clinical features. Shown in the table are P values (Q values). Thresholded by Q value < 0.25, 9 significant findings detected.
|
Clinical Features |
Time to Death |
AGE |
NEOPLASM DISEASESTAGE |
PATHOLOGY T STAGE |
PATHOLOGY N STAGE |
PATHOLOGY M STAGE |
GENDER |
HISTOLOGICAL TYPE |
RADIATIONS RADIATION REGIMENINDICATION |
RADIATIONEXPOSURE |
EXTRATHYROIDAL EXTENSION |
COMPLETENESS OF RESECTION |
NUMBER OF LYMPH NODES |
MULTIFOCALITY |
TUMOR SIZE |
RACE | ETHNICITY | ||
| nMutated (%) | nWild-Type | logrank test | Wilcoxon-test | Fisher's exact test | Fisher's exact test | Fisher's exact test | Fisher's exact test | Fisher's exact test | Fisher's exact test | Fisher's exact test | Fisher's exact test | Fisher's exact test | Fisher's exact test | Wilcoxon-test | Fisher's exact test | Wilcoxon-test | Fisher's exact test | Fisher's exact test | |
| BRAF | 238 (60%) | 160 |
0.905 (1.00) |
0.427 (1.00) |
0.00078 (0.134) |
0.00043 (0.0752) |
0.000499 (0.0868) |
0.132 (1.00) |
0.293 (1.00) |
1e-05 (0.00179) |
0.0322 (1.00) |
0.595 (1.00) |
1e-05 (0.00179) |
0.359 (1.00) |
0.014 (1.00) |
0.917 (1.00) |
0.225 (1.00) |
0.914 (1.00) |
0.437 (1.00) |
| NRAS | 34 (9%) | 364 |
0.467 (1.00) |
0.546 (1.00) |
0.0343 (1.00) |
0.153 (1.00) |
0.000139 (0.0244) |
0.474 (1.00) |
0.839 (1.00) |
7e-05 (0.0124) |
0.61 (1.00) |
1 (1.00) |
0.191 (1.00) |
0.689 (1.00) |
0.00149 (0.255) |
0.371 (1.00) |
0.497 (1.00) |
0.111 (1.00) |
0.0625 (1.00) |
| DNMT3A | 3 (1%) | 395 |
0 (0) |
0.134 (1.00) |
0.0609 (1.00) |
0.167 (1.00) |
1 (1.00) |
1 (1.00) |
0.574 (1.00) |
0.651 (1.00) |
1 (1.00) |
0.124 (1.00) |
0.257 (1.00) |
0.423 (1.00) |
0.752 (1.00) |
1 (1.00) |
1 (1.00) |
1 (1.00) |
|
| ITGAL | 4 (1%) | 394 |
0.0576 (1.00) |
0.0159 (1.00) |
0.0005 (0.0868) |
0.147 (1.00) |
0.348 (1.00) |
1 (1.00) |
0.052 (1.00) |
0.709 (1.00) |
1 (1.00) |
1 (1.00) |
0.00157 (0.267) |
0.101 (1.00) |
0.627 (1.00) |
0.45 (1.00) |
1 (1.00) |
0.269 (1.00) |
|
| HRAS | 14 (4%) | 384 |
0.518 (1.00) |
0.336 (1.00) |
0.366 (1.00) |
0.391 (1.00) |
0.388 (1.00) |
0.261 (1.00) |
0.759 (1.00) |
0.0212 (1.00) |
1 (1.00) |
1 (1.00) |
0.689 (1.00) |
0.199 (1.00) |
0.745 (1.00) |
0.792 (1.00) |
0.732 (1.00) |
0.0977 (1.00) |
0.616 (1.00) |
| EIF1AX | 6 (2%) | 392 |
0.0822 (1.00) |
0.0554 (1.00) |
0.922 (1.00) |
1 (1.00) |
0.625 (1.00) |
0.472 (1.00) |
0.174 (1.00) |
0.0714 (1.00) |
1 (1.00) |
1 (1.00) |
1 (1.00) |
0.281 (1.00) |
0.487 (1.00) |
0.666 (1.00) |
0.474 (1.00) |
1 (1.00) |
|
| NUP93 | 4 (1%) | 394 |
0.912 (1.00) |
0.508 (1.00) |
0.637 (1.00) |
0.736 (1.00) |
0.348 (1.00) |
0.658 (1.00) |
1 (1.00) |
0.0142 (1.00) |
1 (1.00) |
1 (1.00) |
1 (1.00) |
0.521 (1.00) |
0.375 (1.00) |
0.34 (1.00) |
1 (1.00) |
0.197 (1.00) |
1 (1.00) |
| PPM1D | 5 (1%) | 393 |
0.924 (1.00) |
0.155 (1.00) |
0.22 (1.00) |
0.315 (1.00) |
1 (1.00) |
1 (1.00) |
0.605 (1.00) |
1 (1.00) |
1 (1.00) |
1 (1.00) |
0.114 (1.00) |
0.357 (1.00) |
1 (1.00) |
0.521 (1.00) |
1 (1.00) |
1 (1.00) |
|
| KRAS | 4 (1%) | 394 |
0.875 (1.00) |
0.456 (1.00) |
1 (1.00) |
0.207 (1.00) |
0.625 (1.00) |
1 (1.00) |
0.576 (1.00) |
0.466 (1.00) |
1 (1.00) |
1 (1.00) |
1 (1.00) |
0.421 (1.00) |
0.307 (1.00) |
1 (1.00) |
0.743 (1.00) |
1 (1.00) |
|
| DLC1 | 4 (1%) | 394 |
0.0668 (1.00) |
0.781 (1.00) |
0.73 (1.00) |
1 (1.00) |
0.605 (1.00) |
0.662 (1.00) |
1 (1.00) |
1 (1.00) |
1 (1.00) |
1 (1.00) |
0.388 (1.00) |
0.519 (1.00) |
0.413 (1.00) |
0.627 (1.00) |
0.574 (1.00) |
1 (1.00) |
0.269 (1.00) |
| NLRP6 | 3 (1%) | 395 |
0.659 (1.00) |
0.435 (1.00) |
0.79 (1.00) |
0.168 (1.00) |
0.605 (1.00) |
0.132 (1.00) |
1 (1.00) |
0.653 (1.00) |
1 (1.00) |
1 (1.00) |
1 (1.00) |
1 (1.00) |
0.337 (1.00) |
0.598 (1.00) |
1 (1.00) |
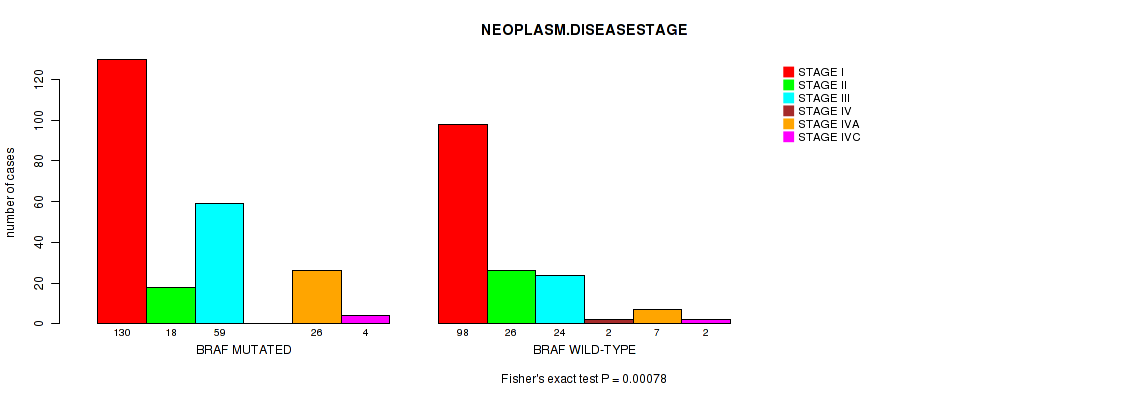
P value = 0.00078 (Fisher's exact test), Q value = 0.13
Table S1. Gene #1: 'BRAF MUTATION STATUS' versus Clinical Feature #3: 'NEOPLASM.DISEASESTAGE'
| nPatients | STAGE I | STAGE II | STAGE III | STAGE IV | STAGE IVA | STAGE IVC |
|---|---|---|---|---|---|---|
| ALL | 228 | 44 | 83 | 2 | 33 | 6 |
| BRAF MUTATED | 130 | 18 | 59 | 0 | 26 | 4 |
| BRAF WILD-TYPE | 98 | 26 | 24 | 2 | 7 | 2 |
Figure S1. Get High-res Image Gene #1: 'BRAF MUTATION STATUS' versus Clinical Feature #3: 'NEOPLASM.DISEASESTAGE'
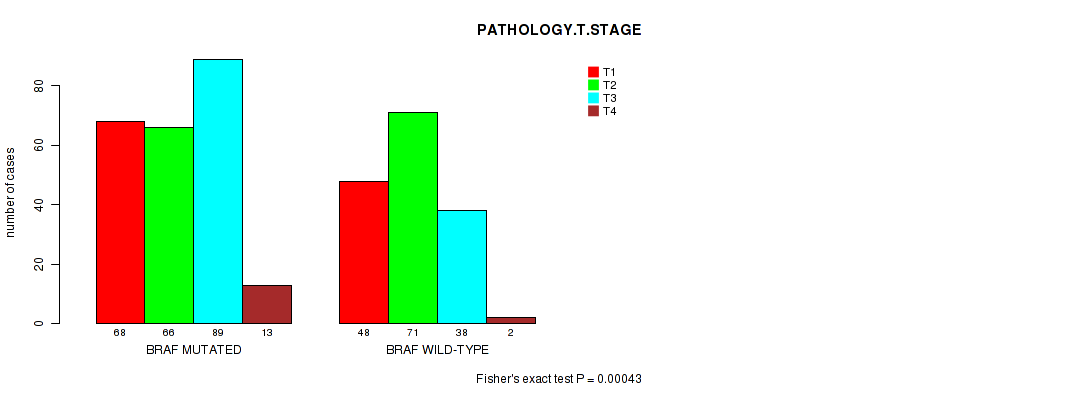
P value = 0.00043 (Fisher's exact test), Q value = 0.075
Table S2. Gene #1: 'BRAF MUTATION STATUS' versus Clinical Feature #4: 'PATHOLOGY.T.STAGE'
| nPatients | T1 | T2 | T3 | T4 |
|---|---|---|---|---|
| ALL | 116 | 137 | 127 | 15 |
| BRAF MUTATED | 68 | 66 | 89 | 13 |
| BRAF WILD-TYPE | 48 | 71 | 38 | 2 |
Figure S2. Get High-res Image Gene #1: 'BRAF MUTATION STATUS' versus Clinical Feature #4: 'PATHOLOGY.T.STAGE'
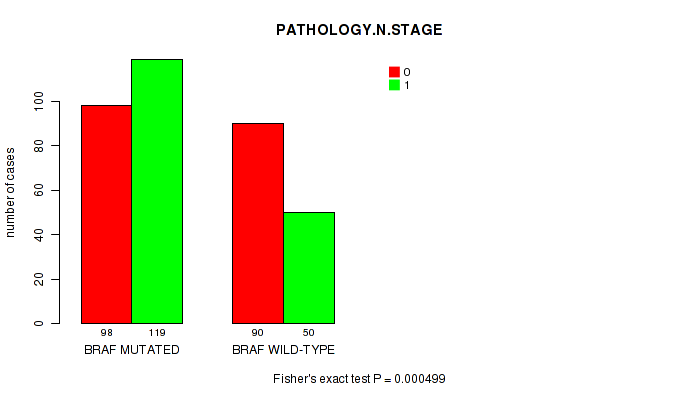
P value = 0.000499 (Fisher's exact test), Q value = 0.087
Table S3. Gene #1: 'BRAF MUTATION STATUS' versus Clinical Feature #5: 'PATHOLOGY.N.STAGE'
| nPatients | 0 | 1 |
|---|---|---|
| ALL | 188 | 169 |
| BRAF MUTATED | 98 | 119 |
| BRAF WILD-TYPE | 90 | 50 |
Figure S3. Get High-res Image Gene #1: 'BRAF MUTATION STATUS' versus Clinical Feature #5: 'PATHOLOGY.N.STAGE'
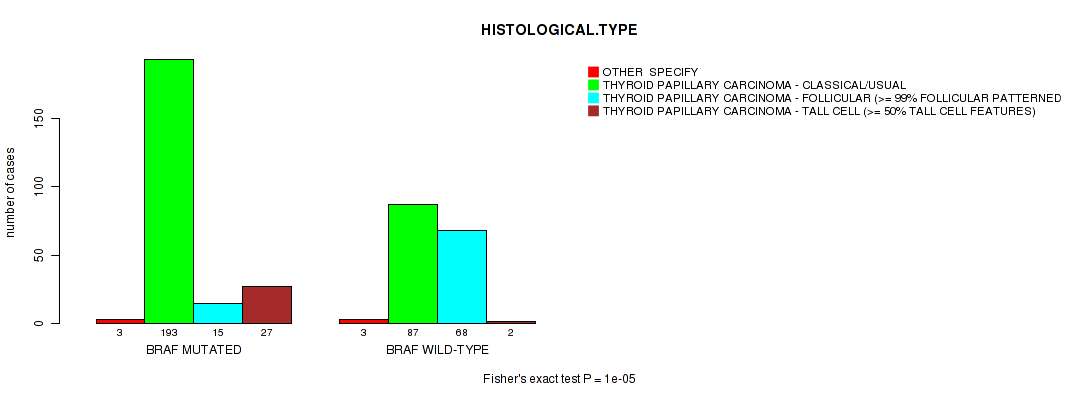
P value = 1e-05 (Fisher's exact test), Q value = 0.0018
Table S4. Gene #1: 'BRAF MUTATION STATUS' versus Clinical Feature #8: 'HISTOLOGICAL.TYPE'
| nPatients | OTHER SPECIFY | THYROID PAPILLARY CARCINOMA - CLASSICAL/USUAL | THYROID PAPILLARY CARCINOMA - FOLLICULAR (>= 99% FOLLICULAR PATTERNED) | THYROID PAPILLARY CARCINOMA - TALL CELL (>= 50% TALL CELL FEATURES) |
|---|---|---|---|---|
| ALL | 6 | 280 | 83 | 29 |
| BRAF MUTATED | 3 | 193 | 15 | 27 |
| BRAF WILD-TYPE | 3 | 87 | 68 | 2 |
Figure S4. Get High-res Image Gene #1: 'BRAF MUTATION STATUS' versus Clinical Feature #8: 'HISTOLOGICAL.TYPE'
P value = 1e-05 (Fisher's exact test), Q value = 0.0018
Table S5. Gene #1: 'BRAF MUTATION STATUS' versus Clinical Feature #11: 'EXTRATHYROIDAL.EXTENSION'
| nPatients | MINIMAL (T3) | MODERATE/ADVANCED (T4A) | NONE | VERY ADVANCED (T4B) |
|---|---|---|---|---|
| ALL | 102 | 11 | 270 | 1 |
| BRAF MUTATED | 79 | 11 | 142 | 0 |
| BRAF WILD-TYPE | 23 | 0 | 128 | 1 |
Figure S5. Get High-res Image Gene #1: 'BRAF MUTATION STATUS' versus Clinical Feature #11: 'EXTRATHYROIDAL.EXTENSION'

P value = 0.000139 (Fisher's exact test), Q value = 0.024
Table S6. Gene #2: 'NRAS MUTATION STATUS' versus Clinical Feature #5: 'PATHOLOGY.N.STAGE'
| nPatients | 0 | 1 |
|---|---|---|
| ALL | 188 | 169 |
| NRAS MUTATED | 27 | 5 |
| NRAS WILD-TYPE | 161 | 164 |
Figure S6. Get High-res Image Gene #2: 'NRAS MUTATION STATUS' versus Clinical Feature #5: 'PATHOLOGY.N.STAGE'

P value = 7e-05 (Fisher's exact test), Q value = 0.012
Table S7. Gene #2: 'NRAS MUTATION STATUS' versus Clinical Feature #8: 'HISTOLOGICAL.TYPE'
| nPatients | OTHER SPECIFY | THYROID PAPILLARY CARCINOMA - CLASSICAL/USUAL | THYROID PAPILLARY CARCINOMA - FOLLICULAR (>= 99% FOLLICULAR PATTERNED) | THYROID PAPILLARY CARCINOMA - TALL CELL (>= 50% TALL CELL FEATURES) |
|---|---|---|---|---|
| ALL | 6 | 280 | 83 | 29 |
| NRAS MUTATED | 0 | 15 | 19 | 0 |
| NRAS WILD-TYPE | 6 | 265 | 64 | 29 |
Figure S7. Get High-res Image Gene #2: 'NRAS MUTATION STATUS' versus Clinical Feature #8: 'HISTOLOGICAL.TYPE'
P value = 0 (logrank test), Q value = 0
Table S8. Gene #7: 'DNMT3A MUTATION STATUS' versus Clinical Feature #1: 'Time to Death'
| nPatients | nDeath | Duration Range (Median), Month | |
|---|---|---|---|
| ALL | 396 | 13 | 0.0 - 158.8 (17.0) |
| DNMT3A MUTATED | 3 | 1 | 1.0 - 7.7 (6.8) |
| DNMT3A WILD-TYPE | 393 | 12 | 0.0 - 158.8 (17.2) |
Figure S8. Get High-res Image Gene #7: 'DNMT3A MUTATION STATUS' versus Clinical Feature #1: 'Time to Death'
P value = 5e-04 (Fisher's exact test), Q value = 0.087
Table S9. Gene #10: 'ITGAL MUTATION STATUS' versus Clinical Feature #3: 'NEOPLASM.DISEASESTAGE'
| nPatients | STAGE I | STAGE II | STAGE III | STAGE IV | STAGE IVA | STAGE IVC |
|---|---|---|---|---|---|---|
| ALL | 228 | 44 | 83 | 2 | 33 | 6 |
| ITGAL MUTATED | 0 | 1 | 0 | 1 | 2 | 0 |
| ITGAL WILD-TYPE | 228 | 43 | 83 | 1 | 31 | 6 |
Figure S9. Get High-res Image Gene #10: 'ITGAL MUTATION STATUS' versus Clinical Feature #3: 'NEOPLASM.DISEASESTAGE'
-
Mutation data file = transformed.cor.cli.txt
-
Clinical data file = THCA-TP.merged_data.txt
-
Number of patients = 398
-
Number of significantly mutated genes = 11
-
Number of selected clinical features = 17
-
Exclude genes that fewer than K tumors have mutations, K = 3
For survival clinical features, the Kaplan-Meier survival curves of tumors with and without gene mutations were plotted and the statistical significance P values were estimated by logrank test (Bland and Altman 2004) using the 'survdiff' function in R
For binary or multi-class clinical features (nominal or ordinal), two-tailed Fisher's exact tests (Fisher 1922) were used to estimate the P values using the 'fisher.test' function in R
For multiple hypothesis correction, Q value is the False Discovery Rate (FDR) analogue of the P value (Benjamini and Hochberg 1995), defined as the minimum FDR at which the test may be called significant. We used the 'Benjamini and Hochberg' method of 'p.adjust' function in R to convert P values into Q values.
In addition to the links below, the full results of the analysis summarized in this report can also be downloaded programmatically using firehose_get, or interactively from either the Broad GDAC website or TCGA Data Coordination Center Portal.