This pipeline computes the correlation between significant arm-level copy number variations (cnvs) and selected clinical features.
Testing the association between copy number variation 82 arm-level events and 8 clinical features across 90 patients, 12 significant findings detected with Q value < 0.25.
-
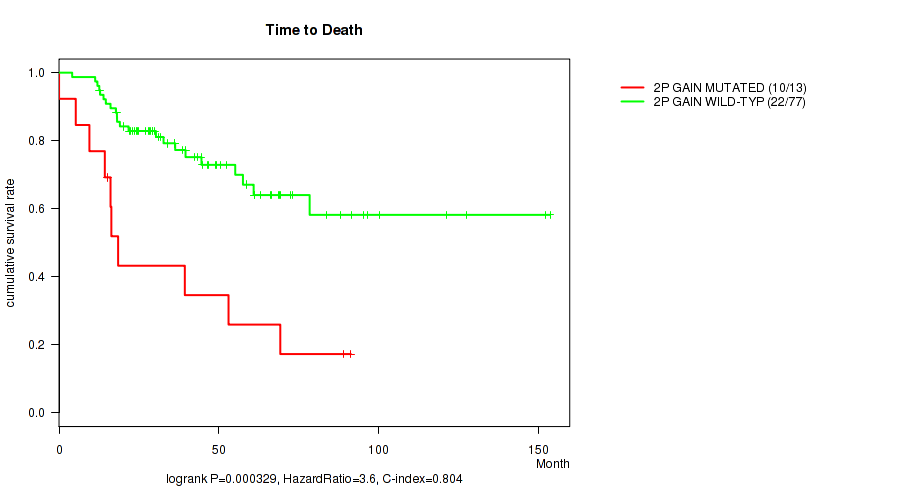
2p gain cnv correlated to 'Time to Death'.
-
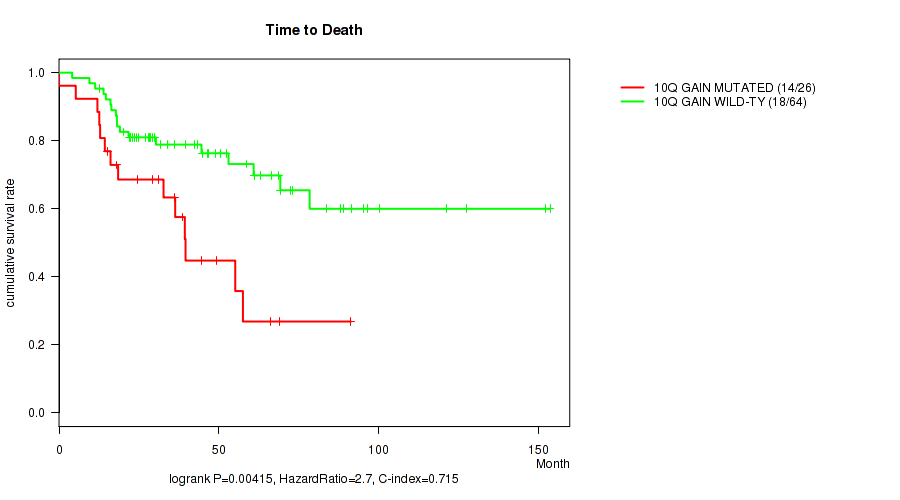
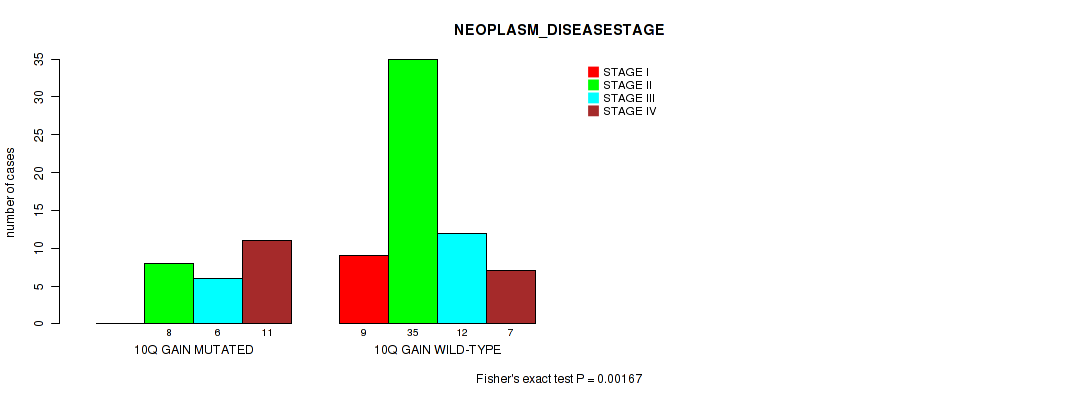
10q gain cnv correlated to 'Time to Death' and 'NEOPLASM_DISEASESTAGE'.
-
11p gain cnv correlated to 'Time to Death'.
-
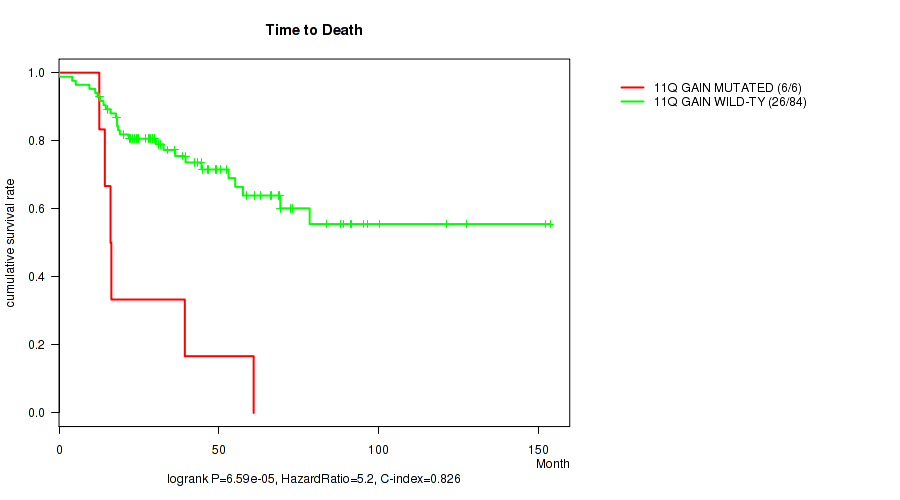
11q gain cnv correlated to 'Time to Death'.
-
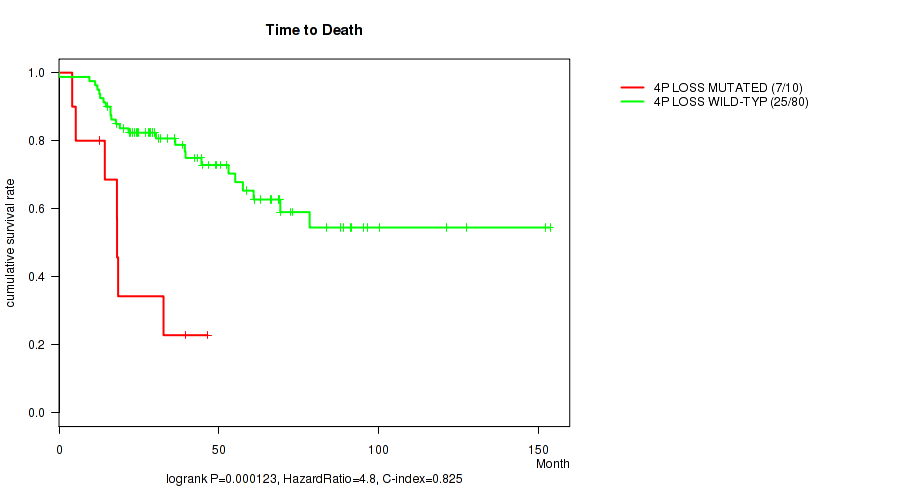
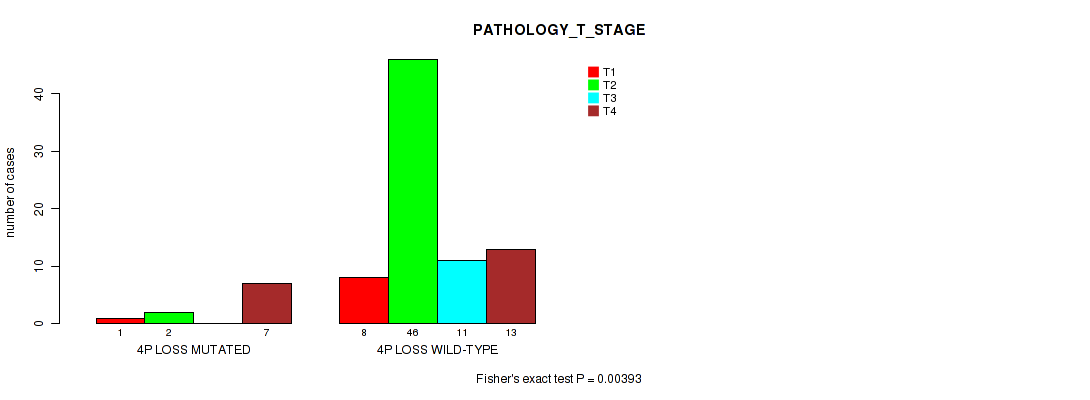
4p loss cnv correlated to 'Time to Death' and 'PATHOLOGY_T_STAGE'.
-
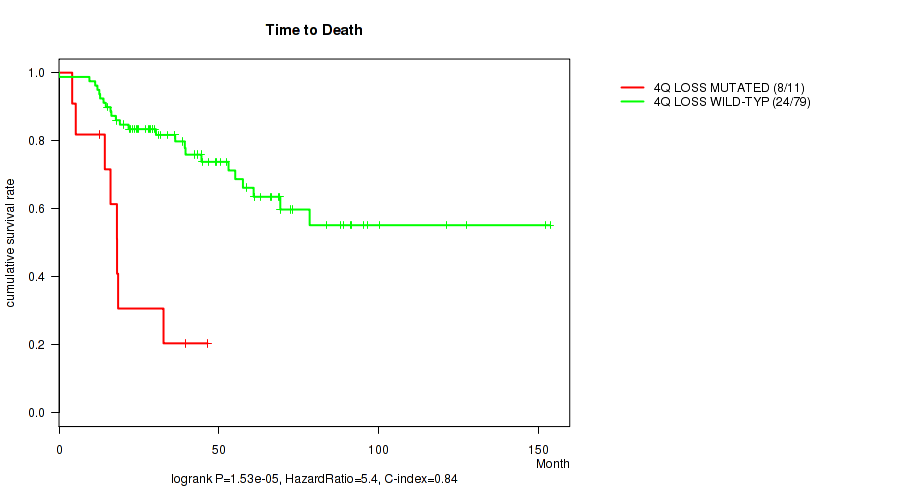
4q loss cnv correlated to 'Time to Death'.
-
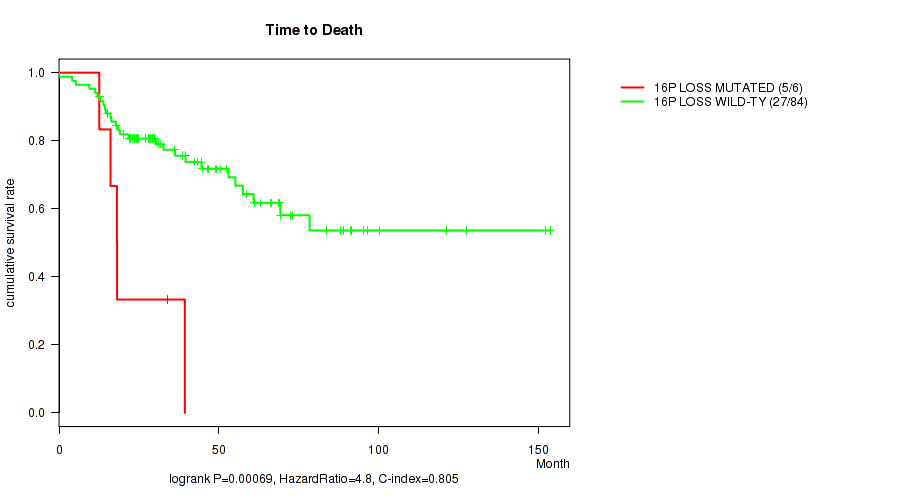
16p loss cnv correlated to 'Time to Death'.
-
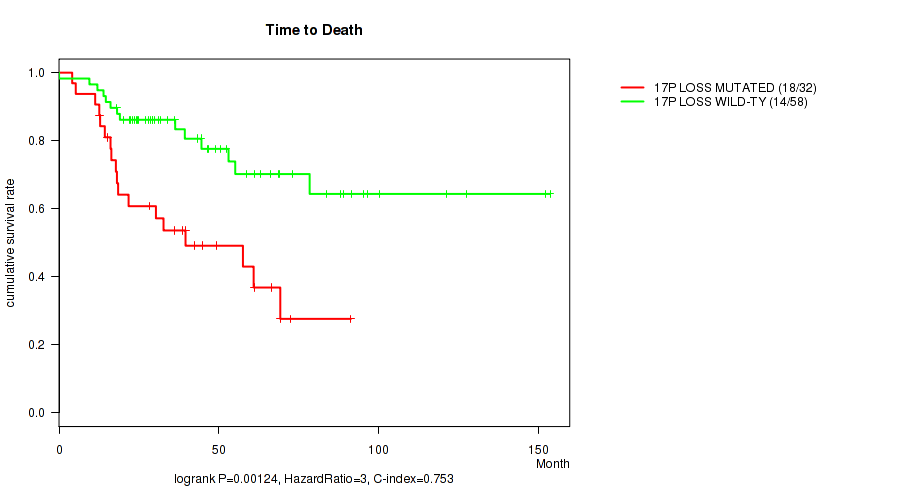
17p loss cnv correlated to 'Time to Death'.
-
19p loss cnv correlated to 'Time to Death'.
-
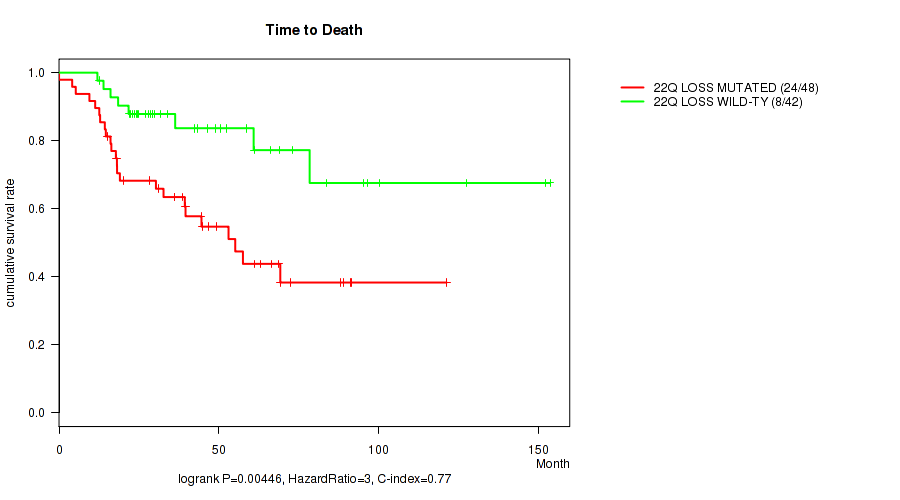
22q loss cnv correlated to 'Time to Death'.
Table 1. Get Full Table Overview of the association between significant copy number variation of 82 arm-level events and 8 clinical features. Shown in the table are P values (Q values). Thresholded by Q value < 0.25, 12 significant findings detected.
|
Clinical Features |
Time to Death |
YEARS TO BIRTH |
NEOPLASM DISEASESTAGE |
PATHOLOGY T STAGE |
PATHOLOGY N STAGE |
GENDER | RACE | ETHNICITY | ||
| nCNV (%) | nWild-Type | logrank test | Wilcoxon-test | Fisher's exact test | Fisher's exact test | Fisher's exact test | Fisher's exact test | Fisher's exact test | Fisher's exact test | |
| 10q gain | 26 (29%) | 64 |
0.00415 (0.244) |
0.266 (1.00) |
0.00167 (0.137) |
0.00589 (0.254) |
1 (1.00) |
1 (1.00) |
1 (1.00) |
0.421 (1.00) |
| 4p loss | 10 (11%) | 80 |
0.000123 (0.0213) |
0.542 (1.00) |
0.0179 (0.456) |
0.00393 (0.244) |
1 (1.00) |
1 (1.00) |
1 (1.00) |
1 (1.00) |
| 2p gain | 13 (14%) | 77 |
0.000329 (0.0432) |
0.818 (1.00) |
0.377 (1.00) |
0.145 (0.97) |
0.347 (1.00) |
0.205 (0.974) |
0.171 (0.974) |
0.587 (1.00) |
| 11p gain | 5 (6%) | 85 |
0.00013 (0.0213) |
0.364 (1.00) |
0.157 (0.97) |
0.0415 (0.697) |
1 (1.00) |
0.656 (1.00) |
1 (1.00) |
0.569 (1.00) |
| 11q gain | 6 (7%) | 84 |
6.59e-05 (0.0213) |
0.698 (1.00) |
0.118 (0.947) |
0.0625 (0.806) |
1 (1.00) |
0.66 (1.00) |
1 (1.00) |
1 (1.00) |
| 4q loss | 11 (12%) | 79 |
1.53e-05 (0.01) |
0.805 (1.00) |
0.0223 (0.472) |
0.00596 (0.254) |
1 (1.00) |
0.742 (1.00) |
1 (1.00) |
1 (1.00) |
| 16p loss | 6 (7%) | 84 |
0.00069 (0.0755) |
0.418 (1.00) |
0.118 (0.947) |
0.0508 (0.752) |
0.526 (1.00) |
1 (1.00) |
1 (1.00) |
0.444 (1.00) |
| 17p loss | 32 (36%) | 58 |
0.00124 (0.116) |
0.535 (1.00) |
0.059 (0.791) |
0.139 (0.97) |
0.73 (1.00) |
0.246 (1.00) |
0.7 (1.00) |
0.409 (1.00) |
| 19p loss | 5 (6%) | 85 |
0.00299 (0.218) |
0.603 (1.00) |
0.197 (0.974) |
0.286 (1.00) |
1 (1.00) |
1 (1.00) |
1 (1.00) |
1 (1.00) |
| 22q loss | 48 (53%) | 42 |
0.00446 (0.244) |
0.236 (1.00) |
0.187 (0.974) |
0.0812 (0.929) |
1 (1.00) |
0.374 (1.00) |
1 (1.00) |
0.117 (0.947) |
| 1p gain | 4 (4%) | 86 |
0.0866 (0.929) |
0.487 (1.00) |
1 (1.00) |
0.746 (1.00) |
1 (1.00) |
0.294 (1.00) |
0.147 (0.97) |
1 (1.00) |
| 1q gain | 8 (9%) | 82 |
0.0458 (0.734) |
0.798 (1.00) |
0.734 (1.00) |
0.456 (1.00) |
0.589 (1.00) |
0.047 (0.734) |
0.245 (1.00) |
0.548 (1.00) |
| 2q gain | 12 (13%) | 78 |
0.0097 (0.335) |
0.767 (1.00) |
0.153 (0.97) |
0.238 (1.00) |
1 (1.00) |
0.0516 (0.752) |
0.171 (0.974) |
0.645 (1.00) |
| 3p gain | 13 (14%) | 77 |
0.28 (1.00) |
0.323 (1.00) |
0.585 (1.00) |
0.929 (1.00) |
1 (1.00) |
0.759 (1.00) |
1 (1.00) |
1 (1.00) |
| 3q gain | 15 (17%) | 75 |
0.392 (1.00) |
0.423 (1.00) |
0.337 (1.00) |
0.757 (1.00) |
0.677 (1.00) |
1 (1.00) |
1 (1.00) |
1 (1.00) |
| 4p gain | 37 (41%) | 53 |
0.196 (0.974) |
0.941 (1.00) |
0.792 (1.00) |
0.842 (1.00) |
1 (1.00) |
0.654 (1.00) |
1 (1.00) |
0.421 (1.00) |
| 4q gain | 33 (37%) | 57 |
0.0958 (0.938) |
0.97 (1.00) |
0.96 (1.00) |
0.929 (1.00) |
1 (1.00) |
0.495 (1.00) |
1 (1.00) |
0.669 (1.00) |
| 5p gain | 57 (63%) | 33 |
0.386 (1.00) |
0.854 (1.00) |
0.696 (1.00) |
0.89 (1.00) |
1 (1.00) |
1 (1.00) |
1 (1.00) |
0.226 (0.996) |
| 5q gain | 53 (59%) | 37 |
0.746 (1.00) |
0.62 (1.00) |
0.566 (1.00) |
0.797 (1.00) |
1 (1.00) |
1 (1.00) |
0.181 (0.974) |
0.115 (0.947) |
| 6p gain | 18 (20%) | 72 |
0.531 (1.00) |
0.0275 (0.545) |
0.497 (1.00) |
0.256 (1.00) |
0.679 (1.00) |
0.588 (1.00) |
0.0921 (0.929) |
0.0548 (0.782) |
| 6q gain | 16 (18%) | 74 |
0.898 (1.00) |
0.2 (0.974) |
0.113 (0.947) |
0.174 (0.974) |
0.2 (0.974) |
0.399 (1.00) |
0.0591 (0.791) |
0.613 (1.00) |
| 7p gain | 48 (53%) | 42 |
0.718 (1.00) |
0.51 (1.00) |
0.168 (0.974) |
0.233 (1.00) |
0.336 (1.00) |
1 (1.00) |
0.217 (0.974) |
0.435 (1.00) |
| 7q gain | 48 (53%) | 42 |
0.43 (1.00) |
0.859 (1.00) |
0.107 (0.947) |
0.225 (0.996) |
0.336 (1.00) |
1 (1.00) |
0.216 (0.974) |
0.115 (0.947) |
| 8p gain | 32 (36%) | 58 |
0.254 (1.00) |
0.508 (1.00) |
0.442 (1.00) |
0.638 (1.00) |
0.484 (1.00) |
1 (1.00) |
0.292 (1.00) |
0.421 (1.00) |
| 8q gain | 38 (42%) | 52 |
0.701 (1.00) |
0.49 (1.00) |
0.346 (1.00) |
0.539 (1.00) |
0.51 (1.00) |
1 (1.00) |
0.341 (1.00) |
0.7 (1.00) |
| 9p gain | 20 (22%) | 70 |
0.27 (1.00) |
0.716 (1.00) |
0.0591 (0.791) |
0.324 (1.00) |
0.00792 (0.289) |
0.791 (1.00) |
1 (1.00) |
0.374 (1.00) |
| 9q gain | 29 (32%) | 61 |
0.0157 (0.456) |
0.663 (1.00) |
0.0377 (0.673) |
0.0884 (0.929) |
0.013 (0.427) |
0.477 (1.00) |
1 (1.00) |
0.421 (1.00) |
| 10p gain | 25 (28%) | 65 |
0.0299 (0.561) |
0.397 (1.00) |
0.00658 (0.254) |
0.0161 (0.456) |
1 (1.00) |
1 (1.00) |
1 (1.00) |
0.421 (1.00) |
| 12p gain | 64 (71%) | 26 |
0.94 (1.00) |
0.287 (1.00) |
0.7 (1.00) |
0.611 (1.00) |
1 (1.00) |
0.464 (1.00) |
0.65 (1.00) |
0.0898 (0.929) |
| 12q gain | 64 (71%) | 26 |
0.965 (1.00) |
0.415 (1.00) |
0.702 (1.00) |
0.65 (1.00) |
0.718 (1.00) |
0.464 (1.00) |
0.0822 (0.929) |
0.0898 (0.929) |
| 13q gain | 6 (7%) | 84 |
0.961 (1.00) |
0.651 (1.00) |
0.735 (1.00) |
0.721 (1.00) |
0.526 (1.00) |
1 (1.00) |
1 (1.00) |
0.548 (1.00) |
| 14q gain | 21 (23%) | 69 |
0.204 (0.974) |
0.426 (1.00) |
0.182 (0.974) |
0.311 (1.00) |
0.241 (1.00) |
0.606 (1.00) |
1 (1.00) |
0.374 (1.00) |
| 15q gain | 11 (12%) | 79 |
0.956 (1.00) |
0.46 (1.00) |
0.796 (1.00) |
0.714 (1.00) |
1 (1.00) |
1 (1.00) |
1 (1.00) |
1 (1.00) |
| 16p gain | 49 (54%) | 41 |
0.386 (1.00) |
0.576 (1.00) |
0.595 (1.00) |
0.284 (1.00) |
1 (1.00) |
0.187 (0.974) |
0.728 (1.00) |
0.439 (1.00) |
| 16q gain | 47 (52%) | 43 |
0.255 (1.00) |
0.929 (1.00) |
0.832 (1.00) |
0.611 (1.00) |
1 (1.00) |
0.269 (1.00) |
0.115 (0.947) |
0.699 (1.00) |
| 17p gain | 5 (6%) | 85 |
0.293 (1.00) |
0.622 (1.00) |
0.158 (0.97) |
0.109 (0.947) |
1 (1.00) |
1 (1.00) |
0.146 (0.97) |
0.444 (1.00) |
| 17q gain | 7 (8%) | 83 |
0.138 (0.97) |
0.488 (1.00) |
0.691 (1.00) |
0.47 (1.00) |
1 (1.00) |
1 (1.00) |
1 (1.00) |
0.548 (1.00) |
| 18p gain | 6 (7%) | 84 |
0.14 (0.97) |
0.452 (1.00) |
0.343 (1.00) |
0.331 (1.00) |
1 (1.00) |
1 (1.00) |
0.212 (0.974) |
1 (1.00) |
| 18q gain | 5 (6%) | 85 |
0.329 (1.00) |
0.833 (1.00) |
0.831 (1.00) |
0.286 (1.00) |
1 (1.00) |
0.656 (1.00) |
0.18 (0.974) |
0.569 (1.00) |
| 19p gain | 56 (62%) | 34 |
0.369 (1.00) |
0.119 (0.947) |
0.176 (0.974) |
0.205 (0.974) |
0.737 (1.00) |
0.821 (1.00) |
1 (1.00) |
0.124 (0.947) |
| 19q gain | 52 (58%) | 38 |
0.403 (1.00) |
0.0203 (0.456) |
0.199 (0.974) |
0.326 (1.00) |
0.182 (0.974) |
0.378 (1.00) |
1 (1.00) |
0.124 (0.947) |
| 20p gain | 46 (51%) | 44 |
0.169 (0.974) |
0.495 (1.00) |
0.338 (1.00) |
0.798 (1.00) |
1 (1.00) |
0.188 (0.974) |
0.493 (1.00) |
1 (1.00) |
| 20q gain | 49 (54%) | 41 |
0.604 (1.00) |
0.964 (1.00) |
0.32 (1.00) |
0.856 (1.00) |
0.336 (1.00) |
0.187 (0.974) |
0.215 (0.974) |
0.71 (1.00) |
| 21q gain | 31 (34%) | 59 |
0.761 (1.00) |
0.154 (0.97) |
0.935 (1.00) |
0.94 (1.00) |
0.0836 (0.929) |
0.818 (1.00) |
0.274 (1.00) |
0.443 (1.00) |
| 22q gain | 3 (3%) | 87 |
0.153 (0.97) |
0.208 (0.974) |
1 (1.00) |
1 (1.00) |
0.307 (1.00) |
1 (1.00) |
1 (1.00) |
1 (1.00) |
| xp gain | 42 (47%) | 48 |
0.51 (1.00) |
0.916 (1.00) |
0.866 (1.00) |
0.872 (1.00) |
1 (1.00) |
0.828 (1.00) |
0.353 (1.00) |
0.115 (0.947) |
| xq gain | 41 (46%) | 49 |
0.354 (1.00) |
0.77 (1.00) |
0.546 (1.00) |
0.913 (1.00) |
0.327 (1.00) |
0.824 (1.00) |
0.343 (1.00) |
0.435 (1.00) |
| 1p loss | 29 (32%) | 61 |
0.921 (1.00) |
0.866 (1.00) |
0.956 (1.00) |
0.951 (1.00) |
1 (1.00) |
1 (1.00) |
1 (1.00) |
1 (1.00) |
| 1q loss | 20 (22%) | 70 |
0.779 (1.00) |
0.317 (1.00) |
0.563 (1.00) |
0.744 (1.00) |
0.445 (1.00) |
0.599 (1.00) |
1 (1.00) |
1 (1.00) |
| 2p loss | 17 (19%) | 73 |
0.039 (0.673) |
0.442 (1.00) |
1 (1.00) |
0.721 (1.00) |
1 (1.00) |
0.576 (1.00) |
1 (1.00) |
1 (1.00) |
| 2q loss | 15 (17%) | 75 |
0.0711 (0.898) |
0.689 (1.00) |
0.616 (1.00) |
0.761 (1.00) |
1 (1.00) |
0.767 (1.00) |
1 (1.00) |
1 (1.00) |
| 3p loss | 20 (22%) | 70 |
0.0935 (0.929) |
0.614 (1.00) |
0.0912 (0.929) |
0.341 (1.00) |
1 (1.00) |
0.293 (1.00) |
1 (1.00) |
1 (1.00) |
| 3q loss | 20 (22%) | 70 |
0.155 (0.97) |
0.907 (1.00) |
0.178 (0.974) |
0.563 (1.00) |
1 (1.00) |
0.599 (1.00) |
0.251 (1.00) |
0.277 (1.00) |
| 5p loss | 8 (9%) | 82 |
0.135 (0.97) |
0.676 (1.00) |
0.188 (0.974) |
0.151 (0.97) |
1 (1.00) |
1 (1.00) |
1 (1.00) |
0.548 (1.00) |
| 5q loss | 7 (8%) | 83 |
0.562 (1.00) |
0.342 (1.00) |
0.0747 (0.925) |
0.142 (0.97) |
0.584 (1.00) |
0.228 (0.996) |
1 (1.00) |
1 (1.00) |
| 6p loss | 19 (21%) | 71 |
0.118 (0.947) |
0.35 (1.00) |
0.0826 (0.929) |
0.148 (0.97) |
0.445 (1.00) |
1 (1.00) |
1 (1.00) |
0.571 (1.00) |
| 6q loss | 22 (24%) | 68 |
0.0283 (0.545) |
0.254 (1.00) |
0.00659 (0.254) |
0.0186 (0.456) |
0.706 (1.00) |
0.453 (1.00) |
1 (1.00) |
1 (1.00) |
| 7p loss | 5 (6%) | 85 |
0.115 (0.947) |
0.718 (1.00) |
0.331 (1.00) |
0.286 (1.00) |
1 (1.00) |
0.0461 (0.734) |
1 (1.00) |
1 (1.00) |
| 7q loss | 6 (7%) | 84 |
0.0205 (0.456) |
0.61 (1.00) |
0.0384 (0.673) |
0.0196 (0.456) |
1 (1.00) |
0.411 (1.00) |
1 (1.00) |
1 (1.00) |
| 8p loss | 16 (18%) | 74 |
0.731 (1.00) |
0.768 (1.00) |
0.67 (1.00) |
0.97 (1.00) |
0.365 (1.00) |
1 (1.00) |
1 (1.00) |
1 (1.00) |
| 8q loss | 12 (13%) | 78 |
0.994 (1.00) |
0.639 (1.00) |
0.581 (1.00) |
1 (1.00) |
0.107 (0.947) |
0.534 (1.00) |
1 (1.00) |
1 (1.00) |
| 9p loss | 20 (22%) | 70 |
0.181 (0.974) |
0.506 (1.00) |
0.843 (1.00) |
0.621 (1.00) |
0.683 (1.00) |
0.599 (1.00) |
1 (1.00) |
0.645 (1.00) |
| 9q loss | 11 (12%) | 79 |
0.871 (1.00) |
0.427 (1.00) |
0.213 (0.974) |
0.428 (1.00) |
0.596 (1.00) |
1 (1.00) |
1 (1.00) |
0.569 (1.00) |
| 10p loss | 12 (13%) | 78 |
0.348 (1.00) |
0.934 (1.00) |
0.183 (0.974) |
1 (1.00) |
0.134 (0.97) |
1 (1.00) |
1 (1.00) |
0.444 (1.00) |
| 10q loss | 10 (11%) | 80 |
0.42 (1.00) |
0.298 (1.00) |
0.307 (1.00) |
0.714 (1.00) |
0.317 (1.00) |
1 (1.00) |
1 (1.00) |
1 (1.00) |
| 11p loss | 24 (27%) | 66 |
0.561 (1.00) |
0.722 (1.00) |
0.131 (0.97) |
0.603 (1.00) |
0.706 (1.00) |
0.455 (1.00) |
1 (1.00) |
1 (1.00) |
| 11q loss | 23 (26%) | 67 |
0.198 (0.974) |
0.563 (1.00) |
0.0273 (0.545) |
0.162 (0.974) |
1 (1.00) |
0.317 (1.00) |
1 (1.00) |
0.569 (1.00) |
| 12p loss | 5 (6%) | 85 |
0.189 (0.974) |
0.241 (1.00) |
0.33 (1.00) |
0.287 (1.00) |
1 (1.00) |
0.335 (1.00) |
1 (1.00) |
1 (1.00) |
| 12q loss | 4 (4%) | 86 |
0.0627 (0.806) |
0.463 (1.00) |
0.333 (1.00) |
0.289 (1.00) |
1 (1.00) |
0.606 (1.00) |
1 (1.00) |
1 (1.00) |
| 13q loss | 39 (43%) | 51 |
0.0899 (0.929) |
0.536 (1.00) |
0.484 (1.00) |
0.919 (1.00) |
0.51 (1.00) |
0.51 (1.00) |
0.506 (1.00) |
1 (1.00) |
| 14q loss | 18 (20%) | 72 |
0.695 (1.00) |
0.793 (1.00) |
0.832 (1.00) |
0.779 (1.00) |
0.68 (1.00) |
0.782 (1.00) |
0.22 (0.982) |
0.129 (0.97) |
| 15q loss | 21 (23%) | 69 |
0.61 (1.00) |
0.519 (1.00) |
0.652 (1.00) |
0.702 (1.00) |
1 (1.00) |
0.606 (1.00) |
1 (1.00) |
0.664 (1.00) |
| 16q loss | 5 (6%) | 85 |
0.0202 (0.456) |
0.214 (0.974) |
0.248 (1.00) |
0.139 (0.97) |
0.461 (1.00) |
1 (1.00) |
1 (1.00) |
0.444 (1.00) |
| 17q loss | 24 (27%) | 66 |
0.0157 (0.456) |
0.964 (1.00) |
0.192 (0.974) |
0.362 (1.00) |
0.706 (1.00) |
0.00587 (0.254) |
1 (1.00) |
0.664 (1.00) |
| 18p loss | 37 (41%) | 53 |
0.548 (1.00) |
0.892 (1.00) |
0.209 (0.974) |
0.494 (1.00) |
1 (1.00) |
0.37 (1.00) |
0.289 (1.00) |
1 (1.00) |
| 18q loss | 35 (39%) | 55 |
0.889 (1.00) |
0.747 (1.00) |
0.274 (1.00) |
0.518 (1.00) |
1 (1.00) |
0.11 (0.947) |
0.272 (1.00) |
1 (1.00) |
| 19q loss | 4 (4%) | 86 |
0.0783 (0.929) |
0.124 (0.947) |
0.874 (1.00) |
1 (1.00) |
1 (1.00) |
1 (1.00) |
1 (1.00) |
1 (1.00) |
| 20p loss | 9 (10%) | 81 |
0.816 (1.00) |
0.595 (1.00) |
0.556 (1.00) |
0.747 (1.00) |
1 (1.00) |
0.156 (0.97) |
0.277 (1.00) |
0.548 (1.00) |
| 20q loss | 3 (3%) | 87 |
0.385 (1.00) |
0.582 (1.00) |
0.704 (1.00) |
0.526 (1.00) |
1 (1.00) |
0.549 (1.00) |
1 (1.00) |
0.321 (1.00) |
| 21q loss | 15 (17%) | 75 |
0.0209 (0.456) |
0.468 (1.00) |
0.671 (1.00) |
0.418 (1.00) |
1 (1.00) |
0.565 (1.00) |
1 (1.00) |
1 (1.00) |
| xp loss | 16 (18%) | 74 |
0.748 (1.00) |
0.0502 (0.752) |
0.861 (1.00) |
0.864 (1.00) |
0.677 (1.00) |
0.778 (1.00) |
1 (1.00) |
0.571 (1.00) |
| xq loss | 15 (17%) | 75 |
0.671 (1.00) |
0.12 (0.947) |
0.697 (1.00) |
0.552 (1.00) |
0.194 (0.974) |
1 (1.00) |
1 (1.00) |
0.571 (1.00) |
P value = 0.000329 (logrank test), Q value = 0.043
Table S1. Gene #3: '2p gain' versus Clinical Feature #1: 'Time to Death'
| nPatients | nDeath | Duration Range (Median), Month | |
|---|---|---|---|
| ALL | 90 | 32 | 0.0 - 153.6 (36.3) |
| 2P GAIN MUTATED | 13 | 10 | 0.0 - 91.3 (16.4) |
| 2P GAIN WILD-TYPE | 77 | 22 | 4.1 - 153.6 (38.5) |
Figure S1. Get High-res Image Gene #3: '2p gain' versus Clinical Feature #1: 'Time to Death'
P value = 0.00415 (logrank test), Q value = 0.24
Table S2. Gene #20: '10q gain' versus Clinical Feature #1: 'Time to Death'
| nPatients | nDeath | Duration Range (Median), Month | |
|---|---|---|---|
| ALL | 90 | 32 | 0.0 - 153.6 (36.3) |
| 10Q GAIN MUTATED | 26 | 14 | 0.0 - 91.3 (32.0) |
| 10Q GAIN WILD-TYPE | 64 | 18 | 4.1 - 153.6 (42.9) |
Figure S2. Get High-res Image Gene #20: '10q gain' versus Clinical Feature #1: 'Time to Death'
P value = 0.00167 (Fisher's exact test), Q value = 0.14
Table S3. Gene #20: '10q gain' versus Clinical Feature #3: 'NEOPLASM_DISEASESTAGE'
| nPatients | STAGE I | STAGE II | STAGE III | STAGE IV |
|---|---|---|---|---|
| ALL | 9 | 43 | 18 | 18 |
| 10Q GAIN MUTATED | 0 | 8 | 6 | 11 |
| 10Q GAIN WILD-TYPE | 9 | 35 | 12 | 7 |
Figure S3. Get High-res Image Gene #20: '10q gain' versus Clinical Feature #3: 'NEOPLASM_DISEASESTAGE'
P value = 0.00013 (logrank test), Q value = 0.021
Table S4. Gene #21: '11p gain' versus Clinical Feature #1: 'Time to Death'
| nPatients | nDeath | Duration Range (Median), Month | |
|---|---|---|---|
| ALL | 90 | 32 | 0.0 - 153.6 (36.3) |
| 11P GAIN MUTATED | 5 | 5 | 0.0 - 60.9 (14.3) |
| 11P GAIN WILD-TYPE | 85 | 27 | 4.1 - 153.6 (36.3) |
Figure S4. Get High-res Image Gene #21: '11p gain' versus Clinical Feature #1: 'Time to Death'

P value = 6.59e-05 (logrank test), Q value = 0.021
Table S5. Gene #22: '11q gain' versus Clinical Feature #1: 'Time to Death'
| nPatients | nDeath | Duration Range (Median), Month | |
|---|---|---|---|
| ALL | 90 | 32 | 0.0 - 153.6 (36.3) |
| 11Q GAIN MUTATED | 6 | 6 | 12.6 - 60.9 (16.2) |
| 11Q GAIN WILD-TYPE | 84 | 26 | 0.0 - 153.6 (37.4) |
Figure S5. Get High-res Image Gene #22: '11q gain' versus Clinical Feature #1: 'Time to Death'
P value = 0.000123 (logrank test), Q value = 0.021
Table S6. Gene #48: '4p loss' versus Clinical Feature #1: 'Time to Death'
| nPatients | nDeath | Duration Range (Median), Month | |
|---|---|---|---|
| ALL | 90 | 32 | 0.0 - 153.6 (36.3) |
| 4P LOSS MUTATED | 10 | 7 | 4.1 - 46.5 (18.1) |
| 4P LOSS WILD-TYPE | 80 | 25 | 0.0 - 153.6 (39.5) |
Figure S6. Get High-res Image Gene #48: '4p loss' versus Clinical Feature #1: 'Time to Death'
P value = 0.00393 (Fisher's exact test), Q value = 0.24
Table S7. Gene #48: '4p loss' versus Clinical Feature #4: 'PATHOLOGY_T_STAGE'
| nPatients | T1 | T2 | T3 | T4 |
|---|---|---|---|---|
| ALL | 9 | 48 | 11 | 20 |
| 4P LOSS MUTATED | 1 | 2 | 0 | 7 |
| 4P LOSS WILD-TYPE | 8 | 46 | 11 | 13 |
Figure S7. Get High-res Image Gene #48: '4p loss' versus Clinical Feature #4: 'PATHOLOGY_T_STAGE'
P value = 1.53e-05 (logrank test), Q value = 0.01
Table S8. Gene #49: '4q loss' versus Clinical Feature #1: 'Time to Death'
| nPatients | nDeath | Duration Range (Median), Month | |
|---|---|---|---|
| ALL | 90 | 32 | 0.0 - 153.6 (36.3) |
| 4Q LOSS MUTATED | 11 | 8 | 4.1 - 46.5 (18.1) |
| 4Q LOSS WILD-TYPE | 79 | 24 | 0.0 - 153.6 (39.6) |
Figure S8. Get High-res Image Gene #49: '4q loss' versus Clinical Feature #1: 'Time to Death'
P value = 0.00069 (logrank test), Q value = 0.075
Table S9. Gene #69: '16p loss' versus Clinical Feature #1: 'Time to Death'
| nPatients | nDeath | Duration Range (Median), Month | |
|---|---|---|---|
| ALL | 90 | 32 | 0.0 - 153.6 (36.3) |
| 16P LOSS MUTATED | 6 | 5 | 12.6 - 39.4 (18.1) |
| 16P LOSS WILD-TYPE | 84 | 27 | 0.0 - 153.6 (39.0) |
Figure S9. Get High-res Image Gene #69: '16p loss' versus Clinical Feature #1: 'Time to Death'
P value = 0.00124 (logrank test), Q value = 0.12
Table S10. Gene #71: '17p loss' versus Clinical Feature #1: 'Time to Death'
| nPatients | nDeath | Duration Range (Median), Month | |
|---|---|---|---|
| ALL | 90 | 32 | 0.0 - 153.6 (36.3) |
| 17P LOSS MUTATED | 32 | 18 | 4.1 - 91.3 (31.5) |
| 17P LOSS WILD-TYPE | 58 | 14 | 0.0 - 153.6 (41.3) |
Figure S10. Get High-res Image Gene #71: '17p loss' versus Clinical Feature #1: 'Time to Death'
P value = 0.00299 (logrank test), Q value = 0.22
Table S11. Gene #75: '19p loss' versus Clinical Feature #1: 'Time to Death'
| nPatients | nDeath | Duration Range (Median), Month | |
|---|---|---|---|
| ALL | 90 | 32 | 0.0 - 153.6 (36.3) |
| 19P LOSS MUTATED | 5 | 4 | 12.6 - 44.5 (18.1) |
| 19P LOSS WILD-TYPE | 85 | 28 | 0.0 - 153.6 (38.5) |
Figure S11. Get High-res Image Gene #75: '19p loss' versus Clinical Feature #1: 'Time to Death'

P value = 0.00446 (logrank test), Q value = 0.24
Table S12. Gene #80: '22q loss' versus Clinical Feature #1: 'Time to Death'
| nPatients | nDeath | Duration Range (Median), Month | |
|---|---|---|---|
| ALL | 90 | 32 | 0.0 - 153.6 (36.3) |
| 22Q LOSS MUTATED | 48 | 24 | 0.0 - 121.2 (37.4) |
| 22Q LOSS WILD-TYPE | 42 | 8 | 12.0 - 153.6 (35.1) |
Figure S12. Get High-res Image Gene #80: '22q loss' versus Clinical Feature #1: 'Time to Death'
-
Copy number data file = broad_values_by_arm.txt from GISTIC pipeline
-
Processed Copy number data file = /xchip/cga/gdac-prod/tcga-gdac/jobResults/GDAC_Correlate_Genomic_Events_Preprocess/ACC-TP/15081747/transformed.cor.cli.txt
-
Clinical data file = /xchip/cga/gdac-prod/tcga-gdac/jobResults/Append_Data/ACC-TP/15074660/ACC-TP.merged_data.txt
-
Number of patients = 90
-
Number of significantly arm-level cnvs = 82
-
Number of selected clinical features = 8
-
Exclude regions that fewer than K tumors have mutations, K = 3
For survival clinical features, the Kaplan-Meier survival curves of tumors with and without gene mutations were plotted and the statistical significance P values were estimated by logrank test (Bland and Altman 2004) using the 'survdiff' function in R
For binary or multi-class clinical features (nominal or ordinal), two-tailed Fisher's exact tests (Fisher 1922) were used to estimate the P values using the 'fisher.test' function in R
For multiple hypothesis correction, Q value is the False Discovery Rate (FDR) analogue of the P value (Benjamini and Hochberg 1995), defined as the minimum FDR at which the test may be called significant. We used the 'Benjamini and Hochberg' method of 'p.adjust' function in R to convert P values into Q values.
In addition to the links below, the full results of the analysis summarized in this report can also be downloaded programmatically using firehose_get, or interactively from either the Broad GDAC website or TCGA Data Coordination Center Portal.