This pipeline computes the correlation between cancer subtypes identified by different molecular patterns and selected clinical features.
Testing the association between subtypes identified by 10 different clustering approaches and 8 clinical features across 92 patients, 26 significant findings detected with P value < 0.05 and Q value < 0.25.
-
4 subtypes identified in current cancer cohort by 'Copy Number Ratio CNMF subtypes'. These subtypes correlate to 'Time to Death', 'YEARS_TO_BIRTH', and 'PATHOLOGY_N_STAGE'.
-
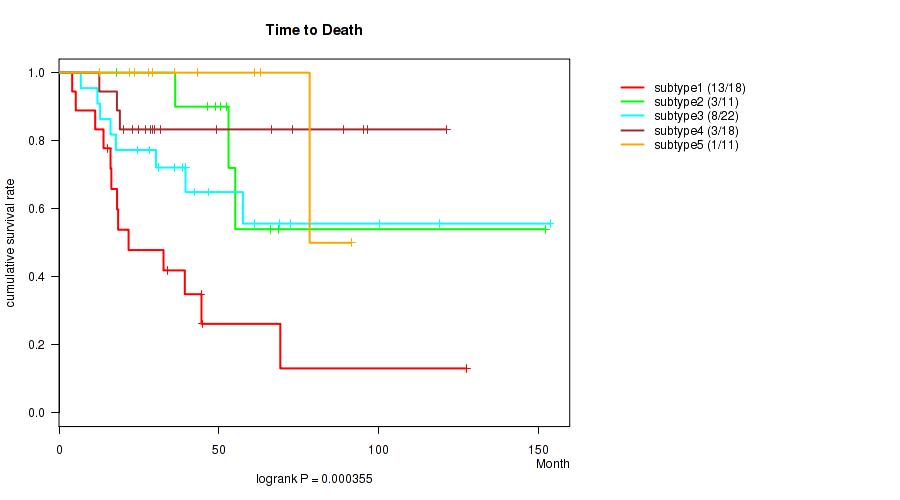
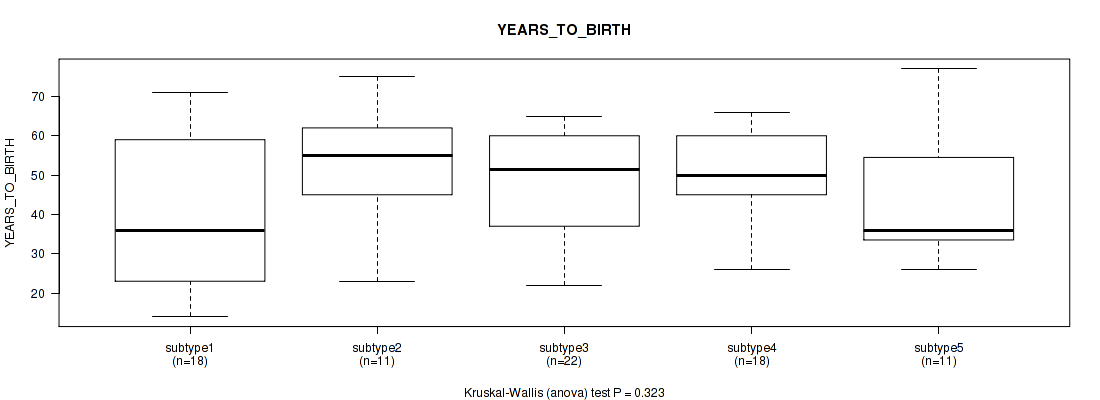
5 subtypes identified in current cancer cohort by 'METHLYATION CNMF'. These subtypes correlate to 'Time to Death' and 'GENDER'.
-
CNMF clustering analysis on RPPA data identified 2 subtypes that correlate to 'Time to Death'.
-
Consensus hierarchical clustering analysis on RPPA data identified 8 subtypes that correlate to 'Time to Death'.
-
CNMF clustering analysis on sequencing-based mRNA expression data identified 4 subtypes that correlate to 'Time to Death', 'NEOPLASM_DISEASESTAGE', and 'PATHOLOGY_N_STAGE'.
-
Consensus hierarchical clustering analysis on sequencing-based mRNA expression data identified 4 subtypes that correlate to 'Time to Death', 'NEOPLASM_DISEASESTAGE', 'PATHOLOGY_T_STAGE', 'PATHOLOGY_N_STAGE', and 'RACE'.
-
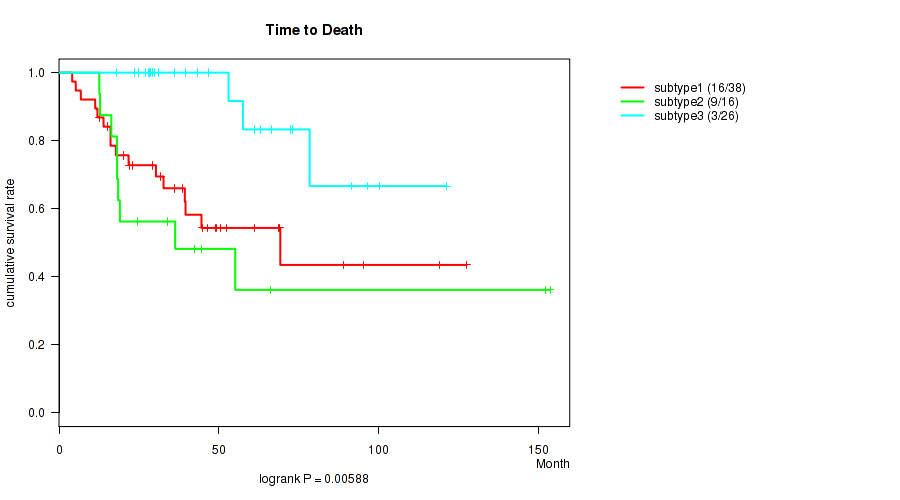
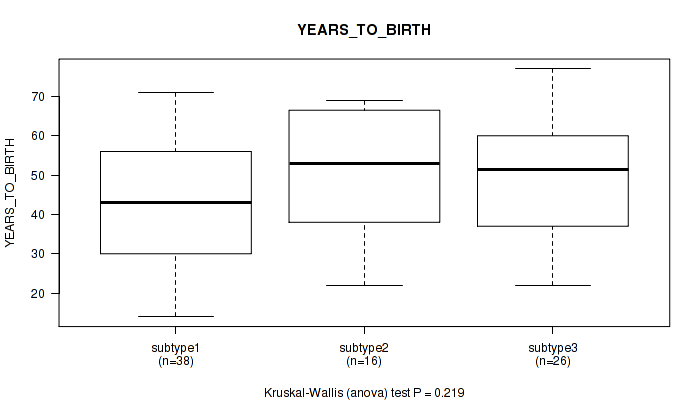
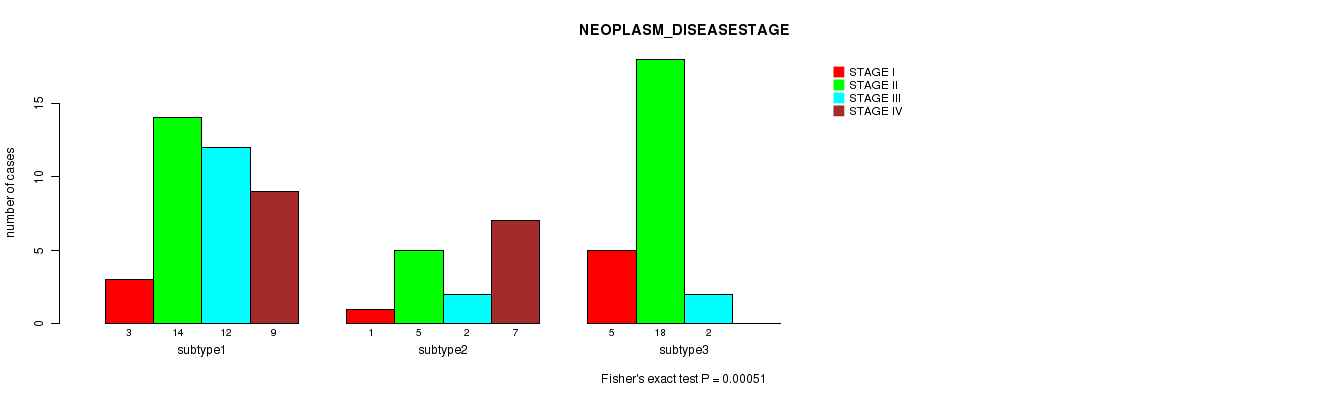
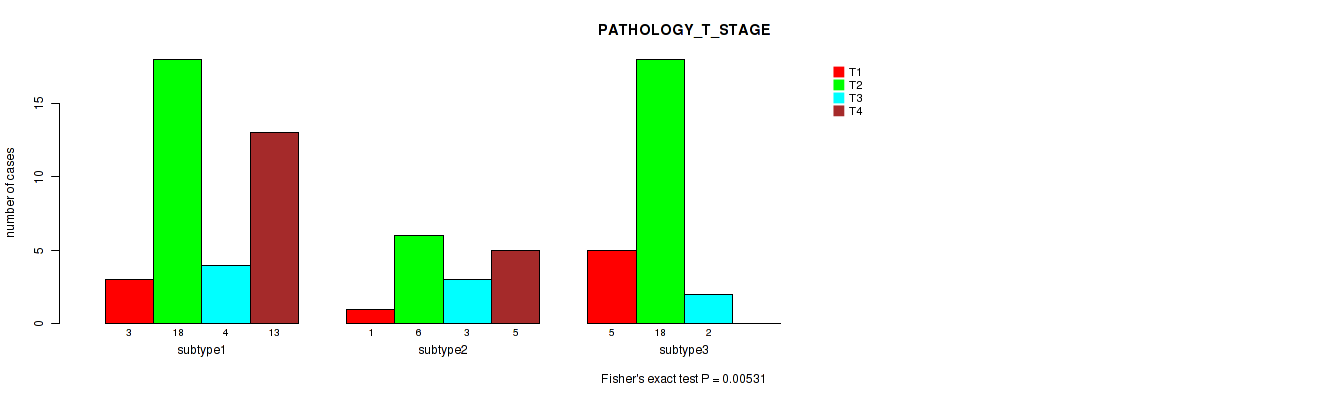
3 subtypes identified in current cancer cohort by 'MIRSEQ CNMF'. These subtypes correlate to 'Time to Death', 'NEOPLASM_DISEASESTAGE', 'PATHOLOGY_T_STAGE', and 'PATHOLOGY_N_STAGE'.
-
5 subtypes identified in current cancer cohort by 'MIRSEQ CHIERARCHICAL'. These subtypes correlate to 'Time to Death' and 'NEOPLASM_DISEASESTAGE'.
-
3 subtypes identified in current cancer cohort by 'MIRseq Mature CNMF subtypes'. These subtypes correlate to 'Time to Death', 'NEOPLASM_DISEASESTAGE', 'PATHOLOGY_T_STAGE', and 'PATHOLOGY_N_STAGE'.
-
3 subtypes identified in current cancer cohort by 'MIRseq Mature cHierClus subtypes'. These subtypes correlate to 'NEOPLASM_DISEASESTAGE'.
Table 1. Get Full Table Overview of the association between subtypes identified by 10 different clustering approaches and 8 clinical features. Shown in the table are P values (Q values). Thresholded by P value < 0.05 and Q value < 0.25, 26 significant findings detected.
|
Clinical Features |
Time to Death |
YEARS TO BIRTH |
NEOPLASM DISEASESTAGE |
PATHOLOGY T STAGE |
PATHOLOGY N STAGE |
GENDER | RACE | ETHNICITY |
| Statistical Tests | logrank test | Kruskal-Wallis (anova) | Fisher's exact test | Fisher's exact test | Fisher's exact test | Fisher's exact test | Fisher's exact test | Fisher's exact test |
| Copy Number Ratio CNMF subtypes |
0.00392 (0.0285) |
0.0265 (0.111) |
0.225 (0.408) |
0.746 (0.866) |
0.00575 (0.0313) |
0.732 (0.866) |
0.819 (0.923) |
0.22 (0.408) |
| METHLYATION CNMF |
0.000355 (0.00651) |
0.323 (0.497) |
0.231 (0.408) |
0.172 (0.344) |
0.0991 (0.24) |
0.0005 (0.00651) |
0.548 (0.708) |
0.749 (0.866) |
| RPPA CNMF subtypes |
0.0331 (0.125) |
0.676 (0.832) |
0.0825 (0.22) |
0.123 (0.281) |
0.667 (0.832) |
1 (1.00) |
0.203 (0.397) |
1 (1.00) |
| RPPA cHierClus subtypes |
0.0429 (0.143) |
0.491 (0.644) |
0.0713 (0.197) |
0.136 (0.298) |
0.469 (0.626) |
0.468 (0.626) |
0.264 (0.424) |
0.758 (0.866) |
| RNAseq CNMF subtypes |
0.000309 (0.00651) |
0.906 (0.992) |
0.013 (0.0614) |
0.0973 (0.24) |
0.0483 (0.148) |
0.239 (0.408) |
0.303 (0.475) |
0.944 (1.00) |
| RNAseq cHierClus subtypes |
0.000278 (0.00651) |
0.623 (0.791) |
0.00442 (0.0295) |
0.0359 (0.125) |
0.0357 (0.125) |
0.359 (0.528) |
0.00924 (0.0462) |
0.24 (0.408) |
| MIRSEQ CNMF |
0.00588 (0.0313) |
0.219 (0.408) |
0.00051 (0.00651) |
0.00531 (0.0313) |
0.0457 (0.146) |
0.138 (0.298) |
1 (1.00) |
0.385 (0.55) |
| MIRSEQ CHIERARCHICAL |
0.0277 (0.111) |
0.265 (0.424) |
0.0009 (0.00809) |
0.153 (0.319) |
0.254 (0.423) |
0.33 (0.499) |
0.105 (0.247) |
0.699 (0.847) |
| MIRseq Mature CNMF subtypes |
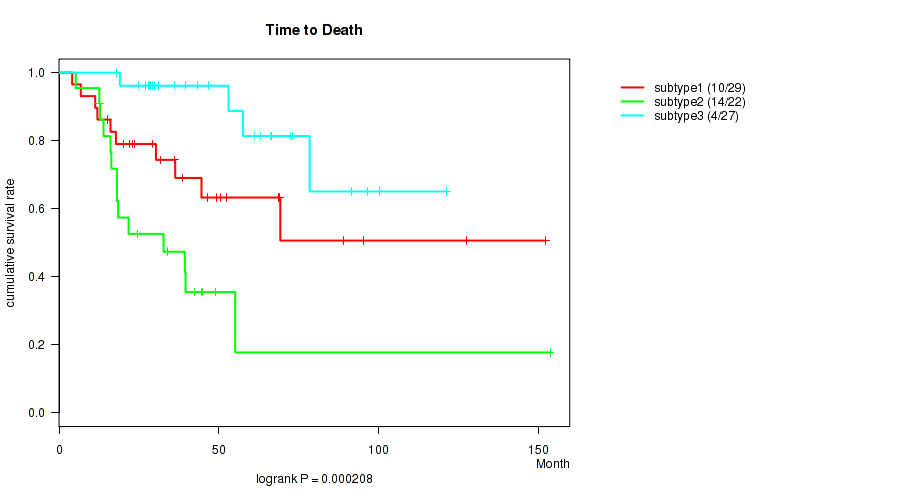
0.000208 (0.00651) |
0.412 (0.568) |
0.00057 (0.00651) |
0.00091 (0.00809) |
0.0276 (0.111) |
0.0611 (0.181) |
1 (1.00) |
0.866 (0.963) |
| MIRseq Mature cHierClus subtypes |
0.0634 (0.181) |
0.969 (1.00) |
0.00317 (0.0254) |
0.0907 (0.234) |
0.155 (0.319) |
0.363 (0.528) |
0.408 (0.568) |
1 (1.00) |
Table S1. Description of clustering approach #1: 'Copy Number Ratio CNMF subtypes'
| Cluster Labels | 1 | 2 | 3 | 4 |
|---|---|---|---|---|
| Number of samples | 36 | 26 | 16 | 12 |
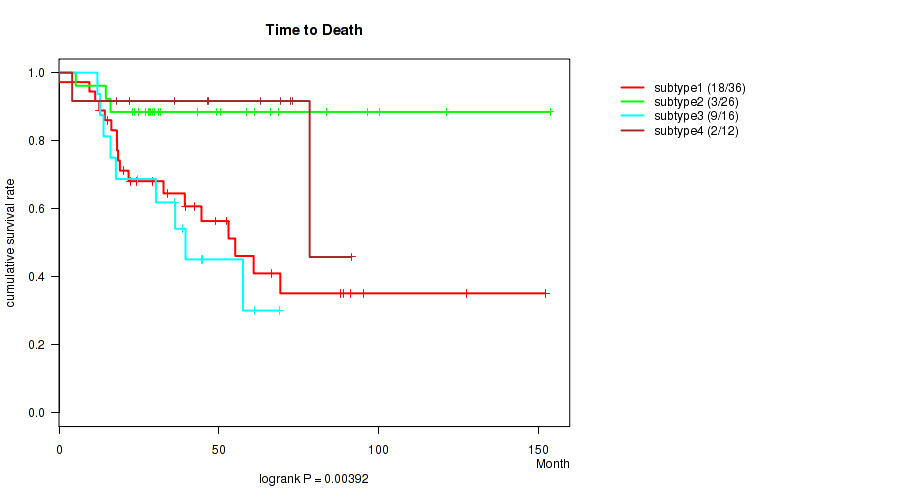
P value = 0.00392 (logrank test), Q value = 0.029
Table S2. Clustering Approach #1: 'Copy Number Ratio CNMF subtypes' versus Clinical Feature #1: 'Time to Death'
| nPatients | nDeath | Duration Range (Median), Month | |
|---|---|---|---|
| ALL | 90 | 32 | 0.0 - 153.6 (36.3) |
| subtype1 | 36 | 18 | 0.0 - 152.2 (33.3) |
| subtype2 | 26 | 3 | 5.2 - 153.6 (31.5) |
| subtype3 | 16 | 9 | 12.0 - 69.1 (36.2) |
| subtype4 | 12 | 2 | 4.1 - 91.5 (54.9) |
Figure S1. Get High-res Image Clustering Approach #1: 'Copy Number Ratio CNMF subtypes' versus Clinical Feature #1: 'Time to Death'
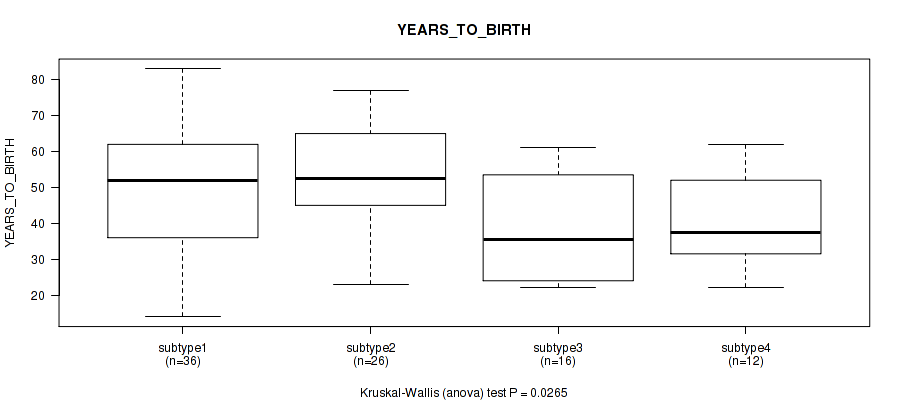
P value = 0.0265 (Kruskal-Wallis (anova)), Q value = 0.11
Table S3. Clustering Approach #1: 'Copy Number Ratio CNMF subtypes' versus Clinical Feature #2: 'YEARS_TO_BIRTH'
| nPatients | Mean (Std.Dev) | |
|---|---|---|
| ALL | 90 | 47.1 (16.5) |
| subtype1 | 36 | 48.5 (17.9) |
| subtype2 | 26 | 53.1 (14.3) |
| subtype3 | 16 | 39.2 (15.1) |
| subtype4 | 12 | 40.6 (12.8) |
Figure S2. Get High-res Image Clustering Approach #1: 'Copy Number Ratio CNMF subtypes' versus Clinical Feature #2: 'YEARS_TO_BIRTH'
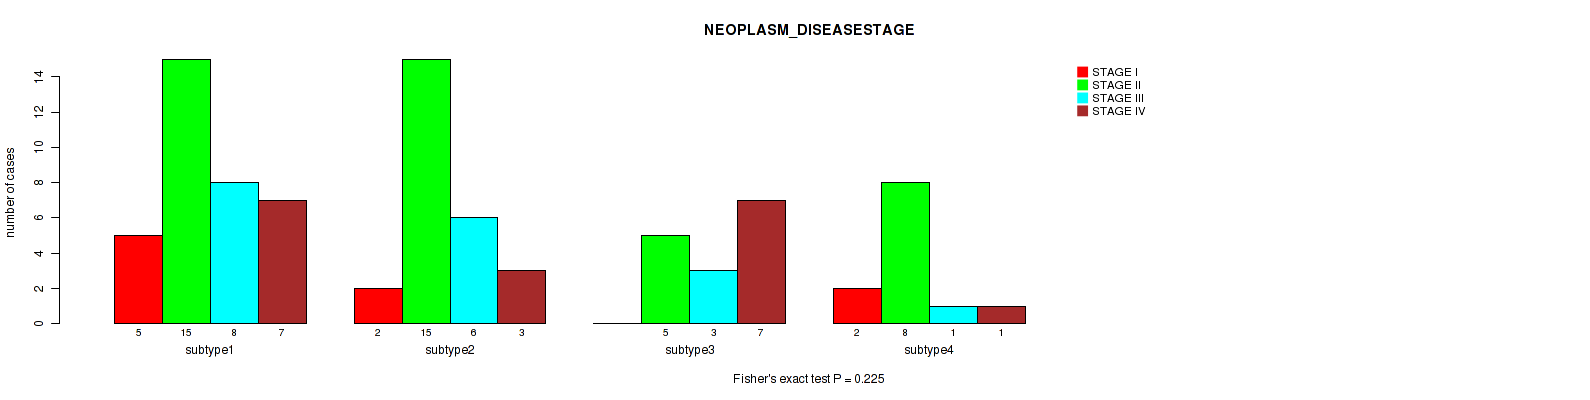
P value = 0.225 (Fisher's exact test), Q value = 0.41
Table S4. Clustering Approach #1: 'Copy Number Ratio CNMF subtypes' versus Clinical Feature #3: 'NEOPLASM_DISEASESTAGE'
| nPatients | STAGE I | STAGE II | STAGE III | STAGE IV |
|---|---|---|---|---|
| ALL | 9 | 43 | 18 | 18 |
| subtype1 | 5 | 15 | 8 | 7 |
| subtype2 | 2 | 15 | 6 | 3 |
| subtype3 | 0 | 5 | 3 | 7 |
| subtype4 | 2 | 8 | 1 | 1 |
Figure S3. Get High-res Image Clustering Approach #1: 'Copy Number Ratio CNMF subtypes' versus Clinical Feature #3: 'NEOPLASM_DISEASESTAGE'
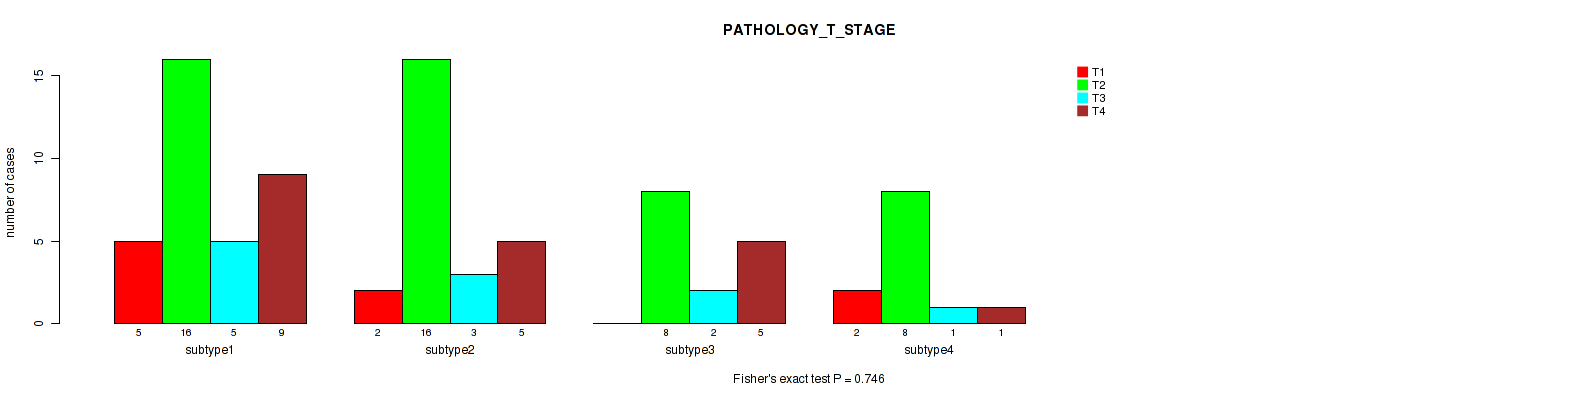
P value = 0.746 (Fisher's exact test), Q value = 0.87
Table S5. Clustering Approach #1: 'Copy Number Ratio CNMF subtypes' versus Clinical Feature #4: 'PATHOLOGY_T_STAGE'
| nPatients | T1 | T2 | T3 | T4 |
|---|---|---|---|---|
| ALL | 9 | 48 | 11 | 20 |
| subtype1 | 5 | 16 | 5 | 9 |
| subtype2 | 2 | 16 | 3 | 5 |
| subtype3 | 0 | 8 | 2 | 5 |
| subtype4 | 2 | 8 | 1 | 1 |
Figure S4. Get High-res Image Clustering Approach #1: 'Copy Number Ratio CNMF subtypes' versus Clinical Feature #4: 'PATHOLOGY_T_STAGE'
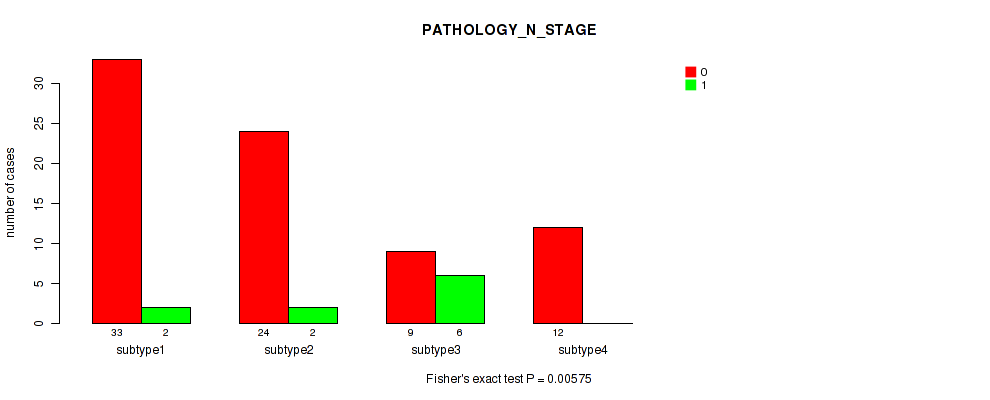
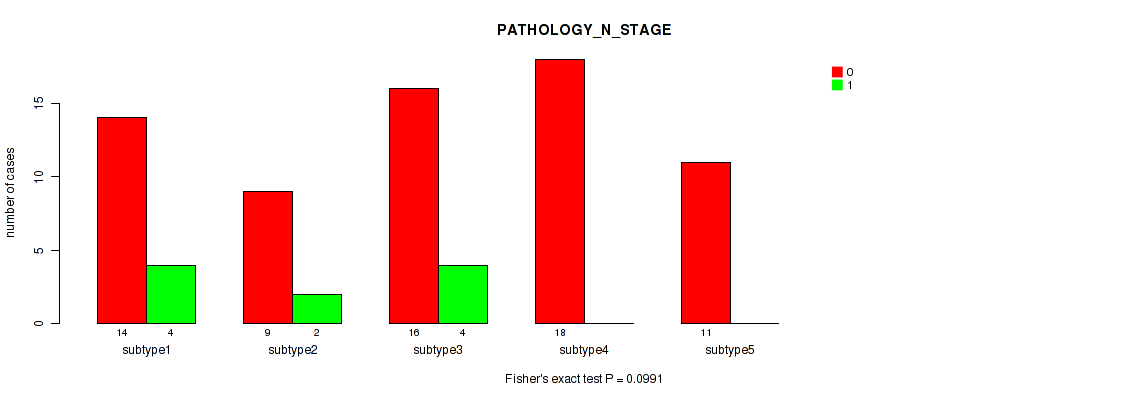
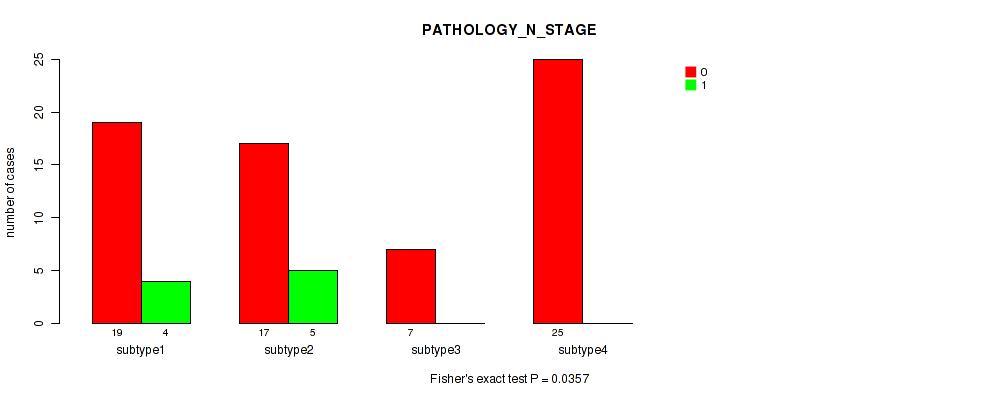
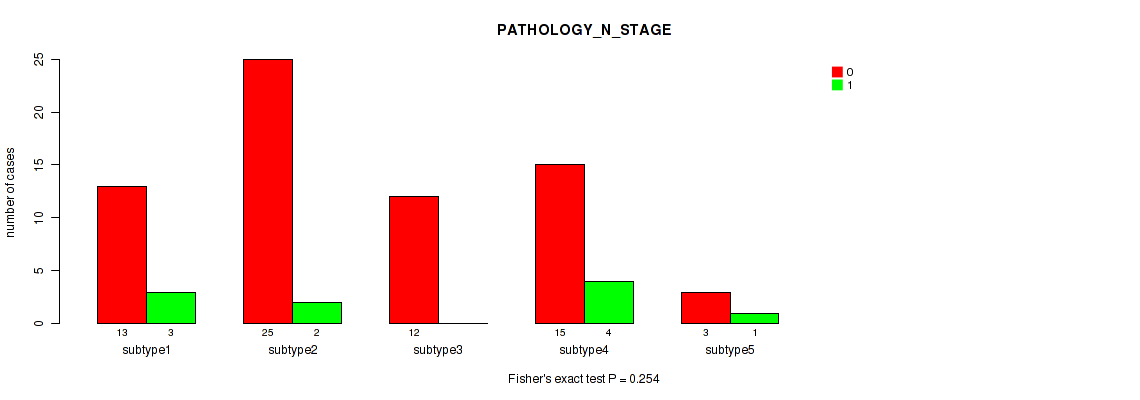
P value = 0.00575 (Fisher's exact test), Q value = 0.031
Table S6. Clustering Approach #1: 'Copy Number Ratio CNMF subtypes' versus Clinical Feature #5: 'PATHOLOGY_N_STAGE'
| nPatients | 0 | 1 |
|---|---|---|
| ALL | 78 | 10 |
| subtype1 | 33 | 2 |
| subtype2 | 24 | 2 |
| subtype3 | 9 | 6 |
| subtype4 | 12 | 0 |
Figure S5. Get High-res Image Clustering Approach #1: 'Copy Number Ratio CNMF subtypes' versus Clinical Feature #5: 'PATHOLOGY_N_STAGE'
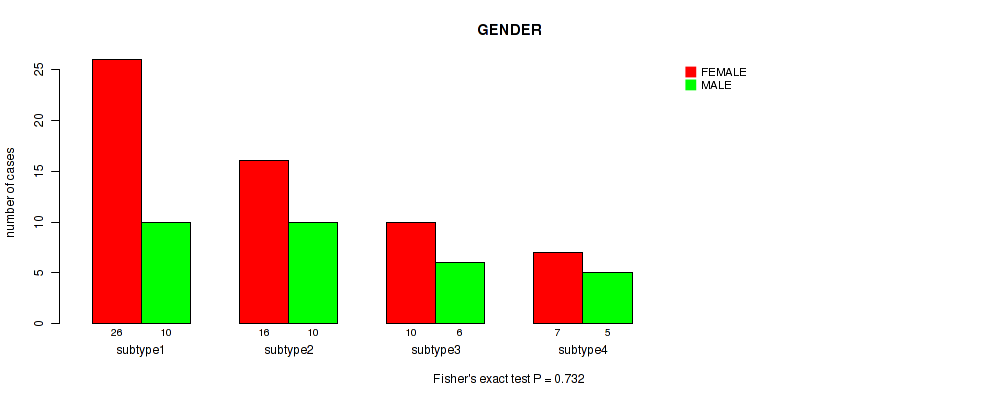
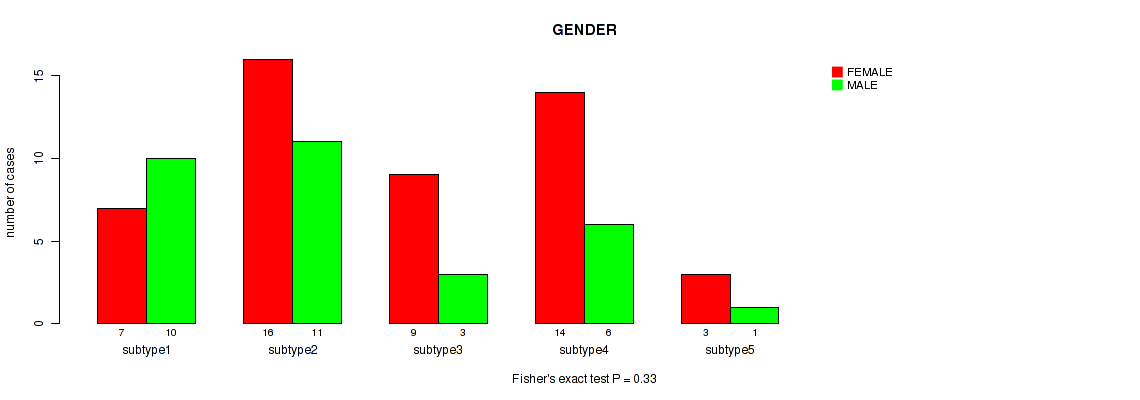
P value = 0.732 (Fisher's exact test), Q value = 0.87
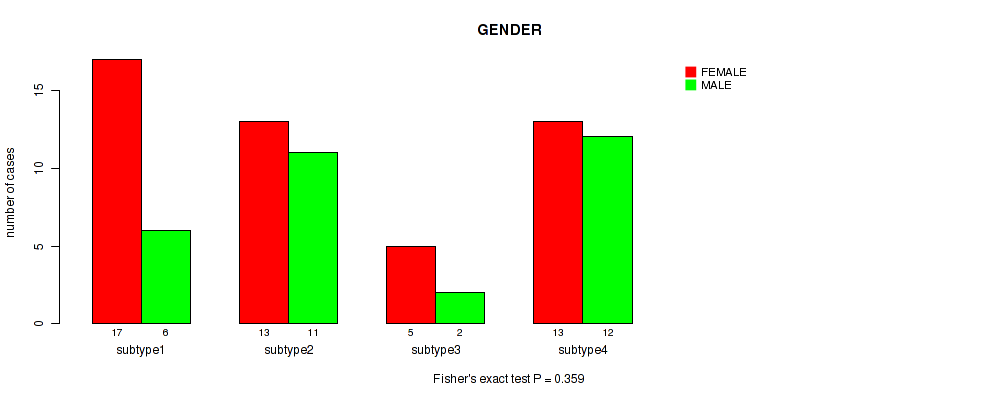
Table S7. Clustering Approach #1: 'Copy Number Ratio CNMF subtypes' versus Clinical Feature #6: 'GENDER'
| nPatients | FEMALE | MALE |
|---|---|---|
| ALL | 59 | 31 |
| subtype1 | 26 | 10 |
| subtype2 | 16 | 10 |
| subtype3 | 10 | 6 |
| subtype4 | 7 | 5 |
Figure S6. Get High-res Image Clustering Approach #1: 'Copy Number Ratio CNMF subtypes' versus Clinical Feature #6: 'GENDER'
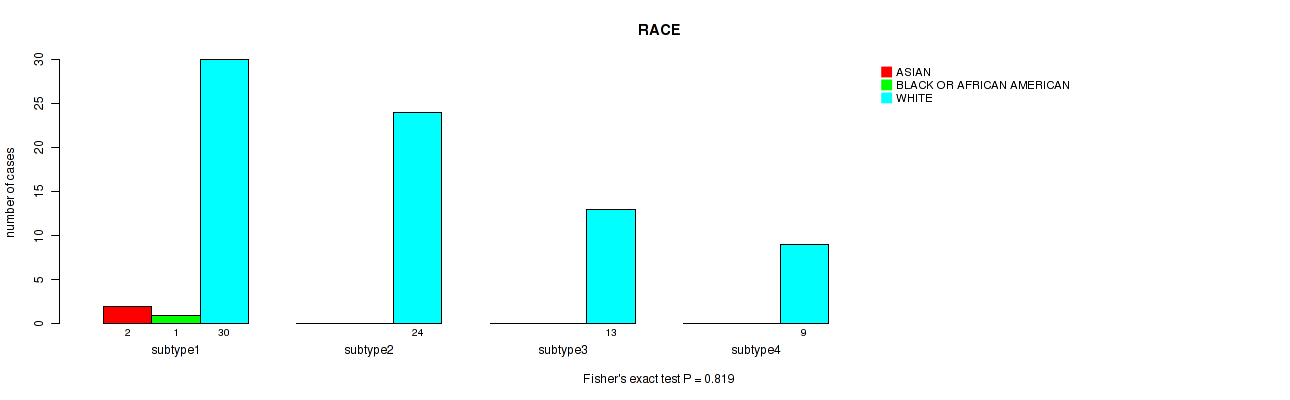
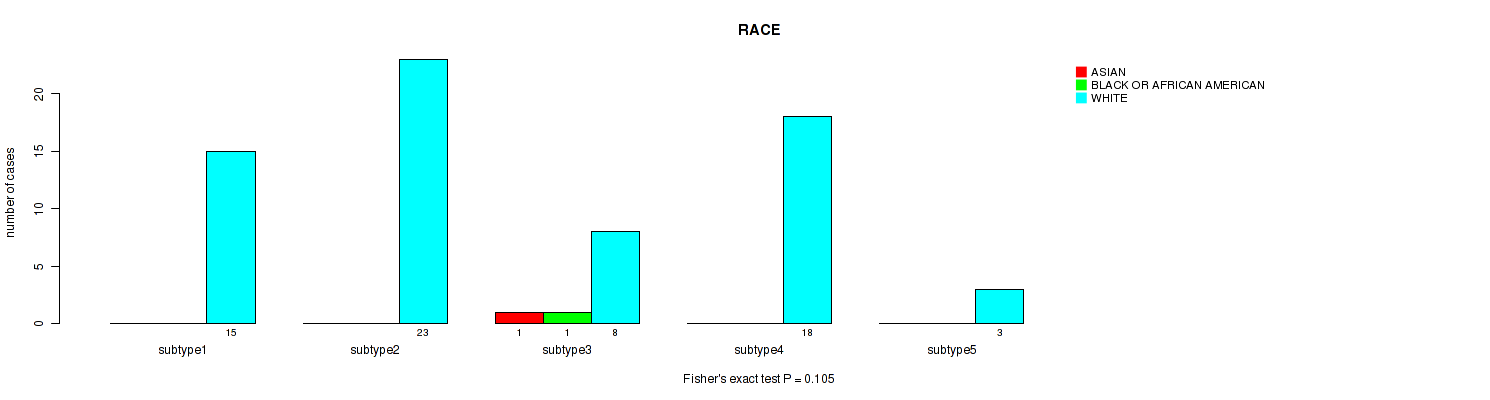
P value = 0.819 (Fisher's exact test), Q value = 0.92
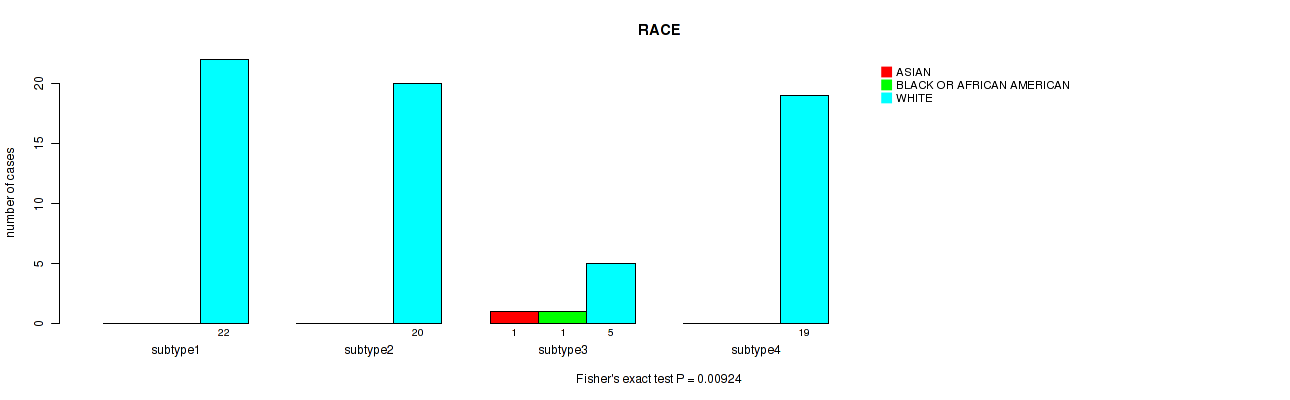
Table S8. Clustering Approach #1: 'Copy Number Ratio CNMF subtypes' versus Clinical Feature #7: 'RACE'
| nPatients | ASIAN | BLACK OR AFRICAN AMERICAN | WHITE |
|---|---|---|---|
| ALL | 2 | 1 | 76 |
| subtype1 | 2 | 1 | 30 |
| subtype2 | 0 | 0 | 24 |
| subtype3 | 0 | 0 | 13 |
| subtype4 | 0 | 0 | 9 |
Figure S7. Get High-res Image Clustering Approach #1: 'Copy Number Ratio CNMF subtypes' versus Clinical Feature #7: 'RACE'
P value = 0.22 (Fisher's exact test), Q value = 0.41
Table S9. Clustering Approach #1: 'Copy Number Ratio CNMF subtypes' versus Clinical Feature #8: 'ETHNICITY'
| nPatients | HISPANIC OR LATINO | NOT HISPANIC OR LATINO |
|---|---|---|
| ALL | 8 | 38 |
| subtype1 | 3 | 16 |
| subtype2 | 1 | 13 |
| subtype3 | 4 | 6 |
| subtype4 | 0 | 3 |
Figure S8. Get High-res Image Clustering Approach #1: 'Copy Number Ratio CNMF subtypes' versus Clinical Feature #8: 'ETHNICITY'
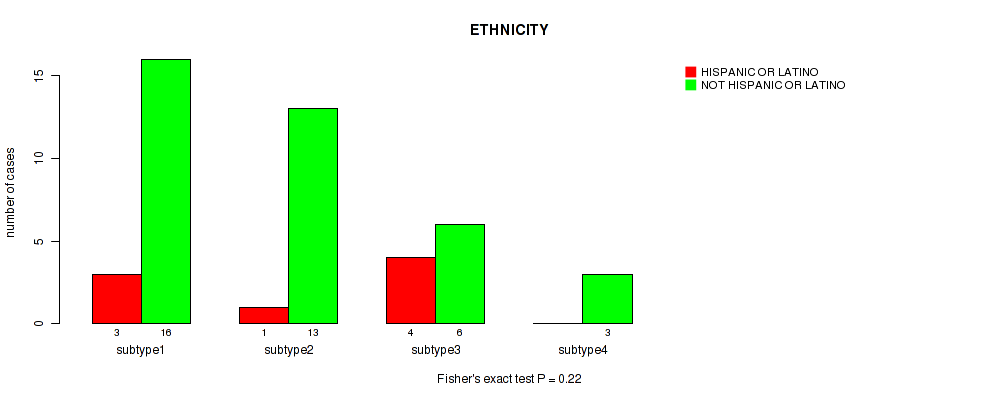
Table S10. Description of clustering approach #2: 'METHLYATION CNMF'
| Cluster Labels | 1 | 2 | 3 | 4 | 5 |
|---|---|---|---|---|---|
| Number of samples | 18 | 11 | 22 | 18 | 11 |
P value = 0.000355 (logrank test), Q value = 0.0065
Table S11. Clustering Approach #2: 'METHLYATION CNMF' versus Clinical Feature #1: 'Time to Death'
| nPatients | nDeath | Duration Range (Median), Month | |
|---|---|---|---|
| ALL | 80 | 28 | 4.1 - 153.6 (36.3) |
| subtype1 | 18 | 13 | 4.1 - 127.5 (20.1) |
| subtype2 | 11 | 3 | 18.1 - 152.2 (52.2) |
| subtype3 | 22 | 8 | 6.8 - 153.6 (39.0) |
| subtype4 | 18 | 3 | 12.6 - 121.2 (29.5) |
| subtype5 | 11 | 1 | 12.6 - 91.5 (36.3) |
Figure S9. Get High-res Image Clustering Approach #2: 'METHLYATION CNMF' versus Clinical Feature #1: 'Time to Death'
P value = 0.323 (Kruskal-Wallis (anova)), Q value = 0.5
Table S12. Clustering Approach #2: 'METHLYATION CNMF' versus Clinical Feature #2: 'YEARS_TO_BIRTH'
| nPatients | Mean (Std.Dev) | |
|---|---|---|
| ALL | 80 | 46.4 (15.9) |
| subtype1 | 18 | 40.3 (20.0) |
| subtype2 | 11 | 53.2 (14.8) |
| subtype3 | 22 | 46.8 (14.2) |
| subtype4 | 18 | 49.4 (12.4) |
| subtype5 | 11 | 43.9 (16.4) |
Figure S10. Get High-res Image Clustering Approach #2: 'METHLYATION CNMF' versus Clinical Feature #2: 'YEARS_TO_BIRTH'
P value = 0.231 (Fisher's exact test), Q value = 0.41
Table S13. Clustering Approach #2: 'METHLYATION CNMF' versus Clinical Feature #3: 'NEOPLASM_DISEASESTAGE'
| nPatients | STAGE I | STAGE II | STAGE III | STAGE IV |
|---|---|---|---|---|
| ALL | 9 | 37 | 16 | 16 |
| subtype1 | 1 | 7 | 6 | 4 |
| subtype2 | 1 | 3 | 4 | 3 |
| subtype3 | 2 | 9 | 3 | 6 |
| subtype4 | 3 | 9 | 3 | 3 |
| subtype5 | 2 | 9 | 0 | 0 |
Figure S11. Get High-res Image Clustering Approach #2: 'METHLYATION CNMF' versus Clinical Feature #3: 'NEOPLASM_DISEASESTAGE'
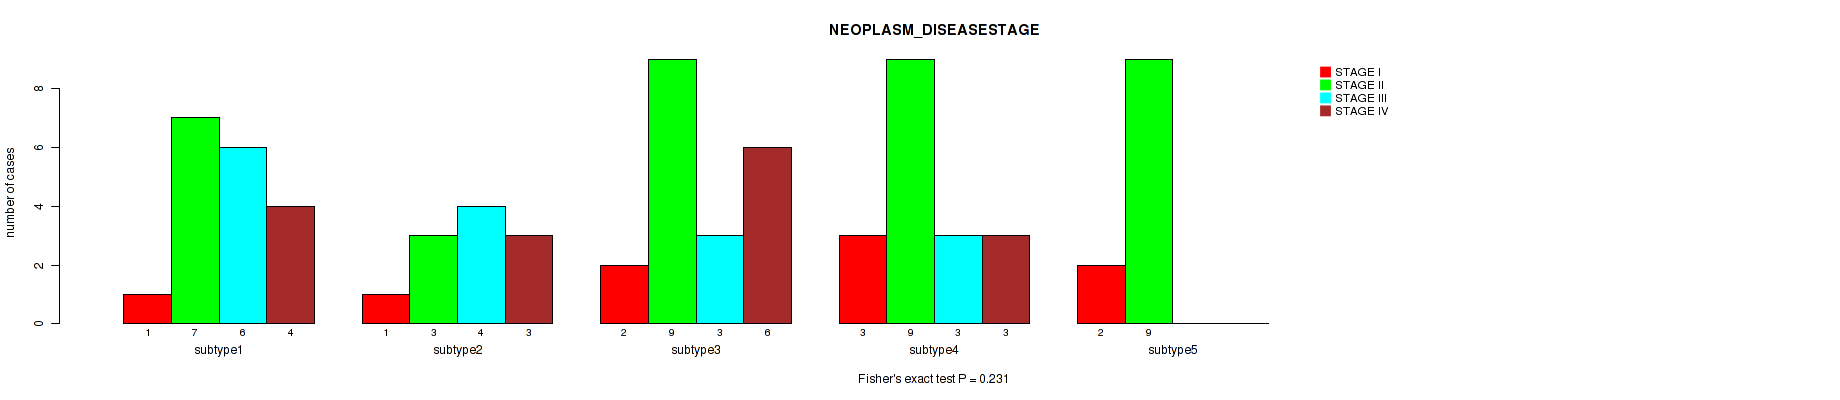
P value = 0.172 (Fisher's exact test), Q value = 0.34
Table S14. Clustering Approach #2: 'METHLYATION CNMF' versus Clinical Feature #4: 'PATHOLOGY_T_STAGE'
| nPatients | T1 | T2 | T3 | T4 |
|---|---|---|---|---|
| ALL | 9 | 42 | 9 | 18 |
| subtype1 | 1 | 9 | 3 | 5 |
| subtype2 | 1 | 5 | 4 | 1 |
| subtype3 | 2 | 10 | 1 | 7 |
| subtype4 | 3 | 9 | 1 | 5 |
| subtype5 | 2 | 9 | 0 | 0 |
Figure S12. Get High-res Image Clustering Approach #2: 'METHLYATION CNMF' versus Clinical Feature #4: 'PATHOLOGY_T_STAGE'
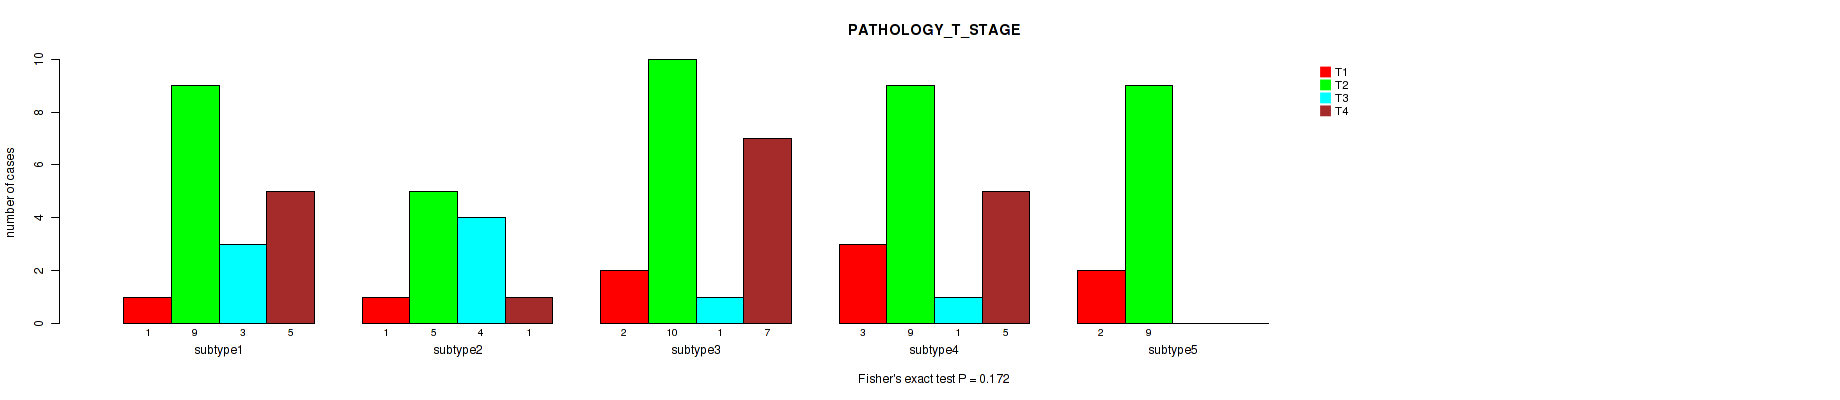
P value = 0.0991 (Fisher's exact test), Q value = 0.24
Table S15. Clustering Approach #2: 'METHLYATION CNMF' versus Clinical Feature #5: 'PATHOLOGY_N_STAGE'
| nPatients | 0 | 1 |
|---|---|---|
| ALL | 68 | 10 |
| subtype1 | 14 | 4 |
| subtype2 | 9 | 2 |
| subtype3 | 16 | 4 |
| subtype4 | 18 | 0 |
| subtype5 | 11 | 0 |
Figure S13. Get High-res Image Clustering Approach #2: 'METHLYATION CNMF' versus Clinical Feature #5: 'PATHOLOGY_N_STAGE'
P value = 5e-04 (Fisher's exact test), Q value = 0.0065
Table S16. Clustering Approach #2: 'METHLYATION CNMF' versus Clinical Feature #6: 'GENDER'
| nPatients | FEMALE | MALE |
|---|---|---|
| ALL | 49 | 31 |
| subtype1 | 13 | 5 |
| subtype2 | 9 | 2 |
| subtype3 | 7 | 15 |
| subtype4 | 9 | 9 |
| subtype5 | 11 | 0 |
Figure S14. Get High-res Image Clustering Approach #2: 'METHLYATION CNMF' versus Clinical Feature #6: 'GENDER'
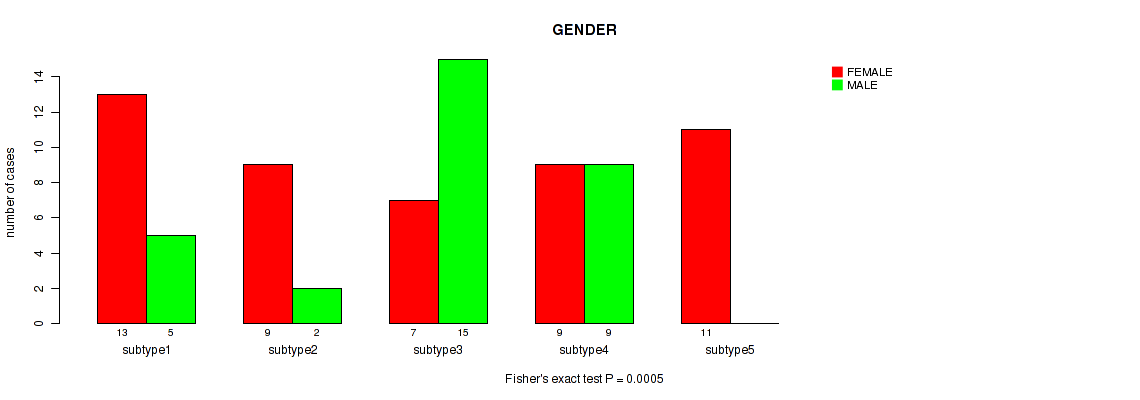
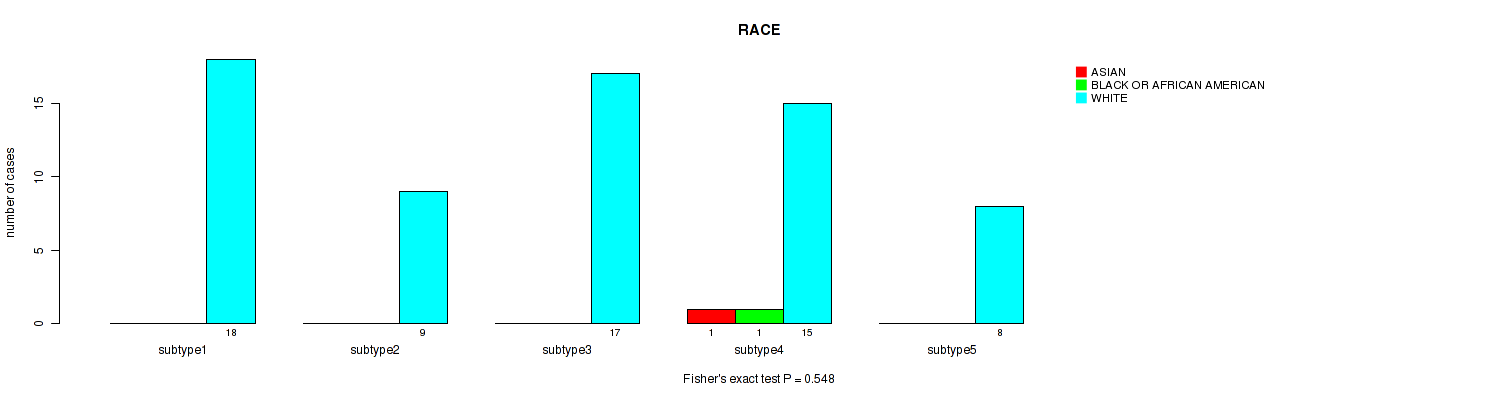
P value = 0.548 (Fisher's exact test), Q value = 0.71
Table S17. Clustering Approach #2: 'METHLYATION CNMF' versus Clinical Feature #7: 'RACE'
| nPatients | ASIAN | BLACK OR AFRICAN AMERICAN | WHITE |
|---|---|---|---|
| ALL | 1 | 1 | 67 |
| subtype1 | 0 | 0 | 18 |
| subtype2 | 0 | 0 | 9 |
| subtype3 | 0 | 0 | 17 |
| subtype4 | 1 | 1 | 15 |
| subtype5 | 0 | 0 | 8 |
Figure S15. Get High-res Image Clustering Approach #2: 'METHLYATION CNMF' versus Clinical Feature #7: 'RACE'
P value = 0.749 (Fisher's exact test), Q value = 0.87
Table S18. Clustering Approach #2: 'METHLYATION CNMF' versus Clinical Feature #8: 'ETHNICITY'
| nPatients | HISPANIC OR LATINO | NOT HISPANIC OR LATINO |
|---|---|---|
| ALL | 8 | 30 |
| subtype1 | 3 | 6 |
| subtype2 | 2 | 6 |
| subtype3 | 1 | 8 |
| subtype4 | 2 | 6 |
| subtype5 | 0 | 4 |
Figure S16. Get High-res Image Clustering Approach #2: 'METHLYATION CNMF' versus Clinical Feature #8: 'ETHNICITY'
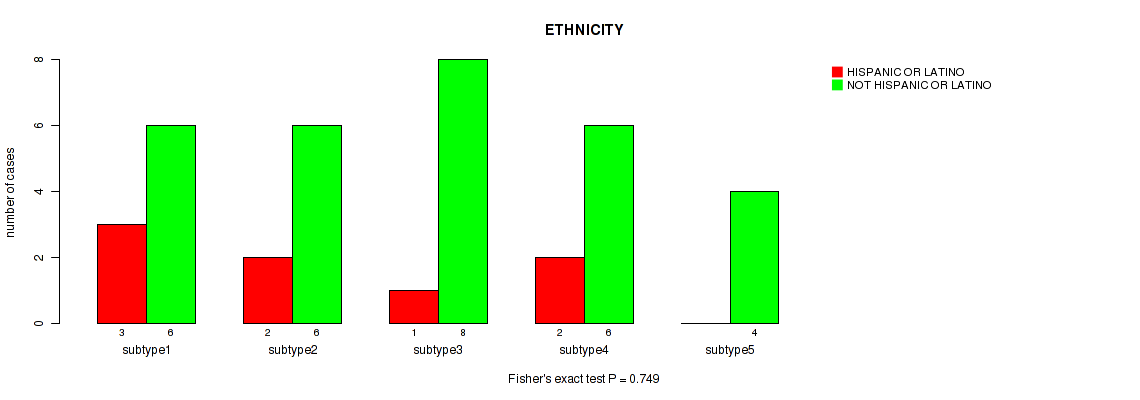
Table S19. Description of clustering approach #3: 'RPPA CNMF subtypes'
| Cluster Labels | 1 | 2 |
|---|---|---|
| Number of samples | 22 | 24 |
P value = 0.0331 (logrank test), Q value = 0.12
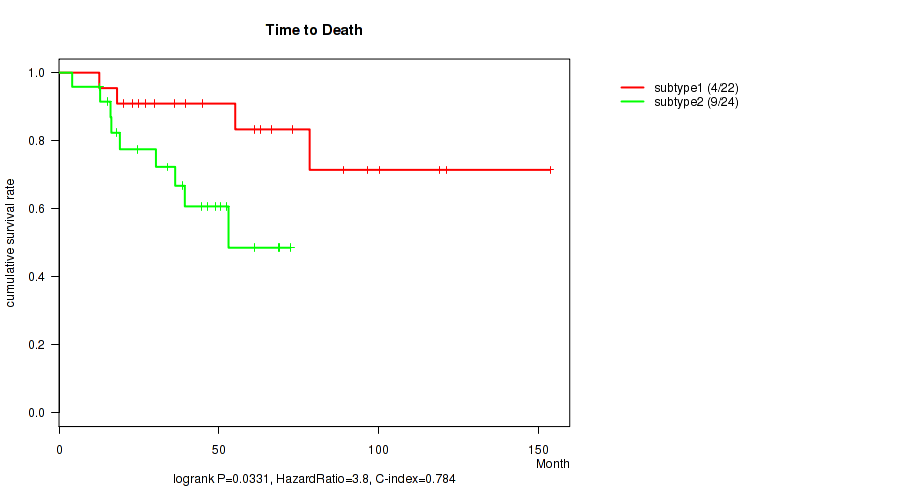
Table S20. Clustering Approach #3: 'RPPA CNMF subtypes' versus Clinical Feature #1: 'Time to Death'
| nPatients | nDeath | Duration Range (Median), Month | |
|---|---|---|---|
| ALL | 46 | 13 | 4.1 - 153.6 (42.0) |
| subtype1 | 22 | 4 | 12.6 - 153.6 (58.1) |
| subtype2 | 24 | 9 | 4.1 - 72.4 (37.4) |
Figure S17. Get High-res Image Clustering Approach #3: 'RPPA CNMF subtypes' versus Clinical Feature #1: 'Time to Death'
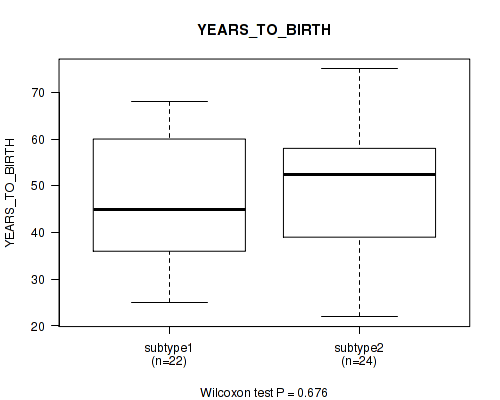
P value = 0.676 (Wilcoxon-test), Q value = 0.83
Table S21. Clustering Approach #3: 'RPPA CNMF subtypes' versus Clinical Feature #2: 'YEARS_TO_BIRTH'
| nPatients | Mean (Std.Dev) | |
|---|---|---|
| ALL | 46 | 47.2 (14.4) |
| subtype1 | 22 | 46.4 (13.5) |
| subtype2 | 24 | 47.9 (15.5) |
Figure S18. Get High-res Image Clustering Approach #3: 'RPPA CNMF subtypes' versus Clinical Feature #2: 'YEARS_TO_BIRTH'
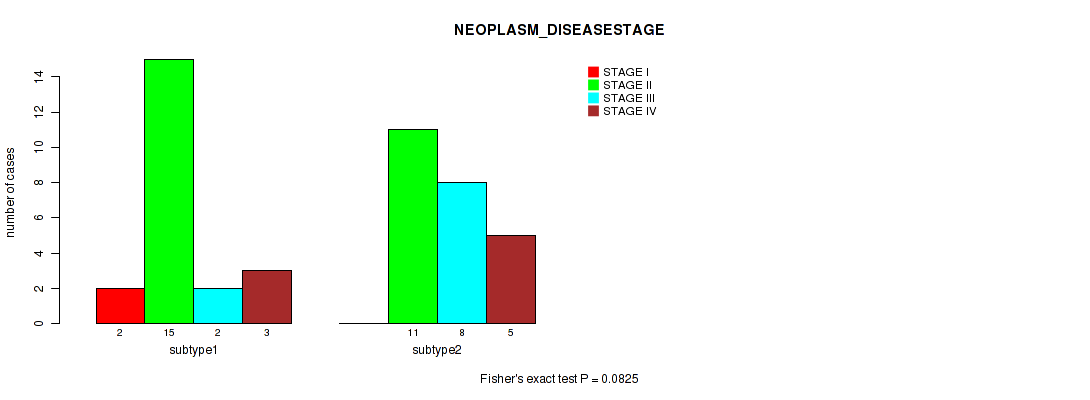
P value = 0.0825 (Fisher's exact test), Q value = 0.22
Table S22. Clustering Approach #3: 'RPPA CNMF subtypes' versus Clinical Feature #3: 'NEOPLASM_DISEASESTAGE'
| nPatients | STAGE I | STAGE II | STAGE III | STAGE IV |
|---|---|---|---|---|
| ALL | 2 | 26 | 10 | 8 |
| subtype1 | 2 | 15 | 2 | 3 |
| subtype2 | 0 | 11 | 8 | 5 |
Figure S19. Get High-res Image Clustering Approach #3: 'RPPA CNMF subtypes' versus Clinical Feature #3: 'NEOPLASM_DISEASESTAGE'
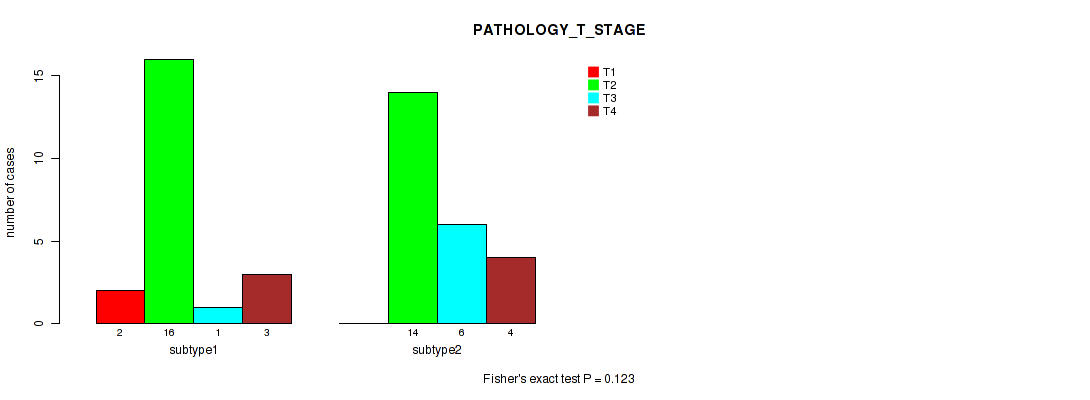
P value = 0.123 (Fisher's exact test), Q value = 0.28
Table S23. Clustering Approach #3: 'RPPA CNMF subtypes' versus Clinical Feature #4: 'PATHOLOGY_T_STAGE'
| nPatients | T1 | T2 | T3 | T4 |
|---|---|---|---|---|
| ALL | 2 | 30 | 7 | 7 |
| subtype1 | 2 | 16 | 1 | 3 |
| subtype2 | 0 | 14 | 6 | 4 |
Figure S20. Get High-res Image Clustering Approach #3: 'RPPA CNMF subtypes' versus Clinical Feature #4: 'PATHOLOGY_T_STAGE'
P value = 0.667 (Fisher's exact test), Q value = 0.83
Table S24. Clustering Approach #3: 'RPPA CNMF subtypes' versus Clinical Feature #5: 'PATHOLOGY_N_STAGE'
| nPatients | 0 | 1 |
|---|---|---|
| ALL | 40 | 6 |
| subtype1 | 20 | 2 |
| subtype2 | 20 | 4 |
Figure S21. Get High-res Image Clustering Approach #3: 'RPPA CNMF subtypes' versus Clinical Feature #5: 'PATHOLOGY_N_STAGE'
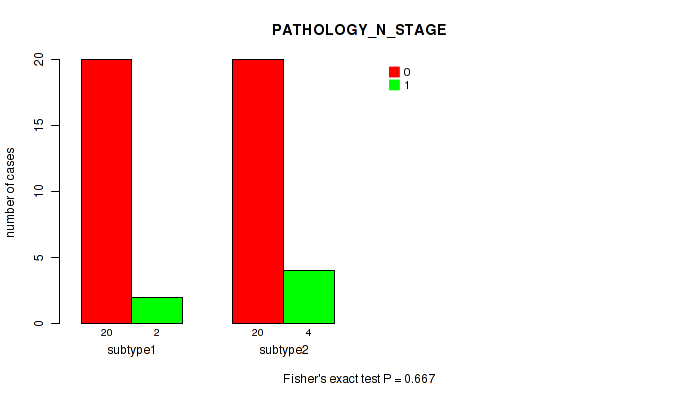
P value = 1 (Fisher's exact test), Q value = 1
Table S25. Clustering Approach #3: 'RPPA CNMF subtypes' versus Clinical Feature #6: 'GENDER'
| nPatients | FEMALE | MALE |
|---|---|---|
| ALL | 28 | 18 |
| subtype1 | 13 | 9 |
| subtype2 | 15 | 9 |
Figure S22. Get High-res Image Clustering Approach #3: 'RPPA CNMF subtypes' versus Clinical Feature #6: 'GENDER'
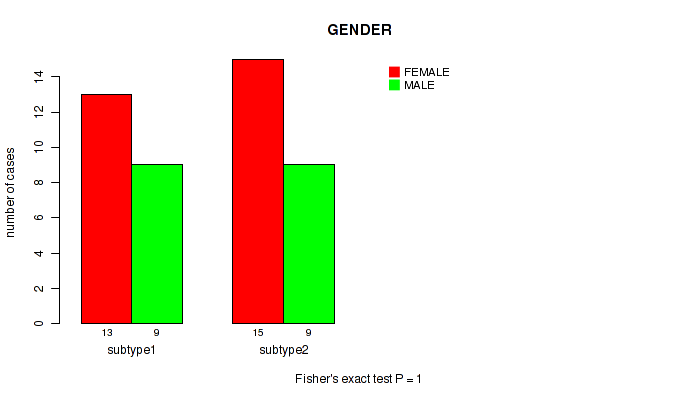
P value = 0.203 (Fisher's exact test), Q value = 0.4
Table S26. Clustering Approach #3: 'RPPA CNMF subtypes' versus Clinical Feature #7: 'RACE'
| nPatients | ASIAN | BLACK OR AFRICAN AMERICAN | WHITE |
|---|---|---|---|
| ALL | 1 | 1 | 35 |
| subtype1 | 1 | 1 | 15 |
| subtype2 | 0 | 0 | 20 |
Figure S23. Get High-res Image Clustering Approach #3: 'RPPA CNMF subtypes' versus Clinical Feature #7: 'RACE'
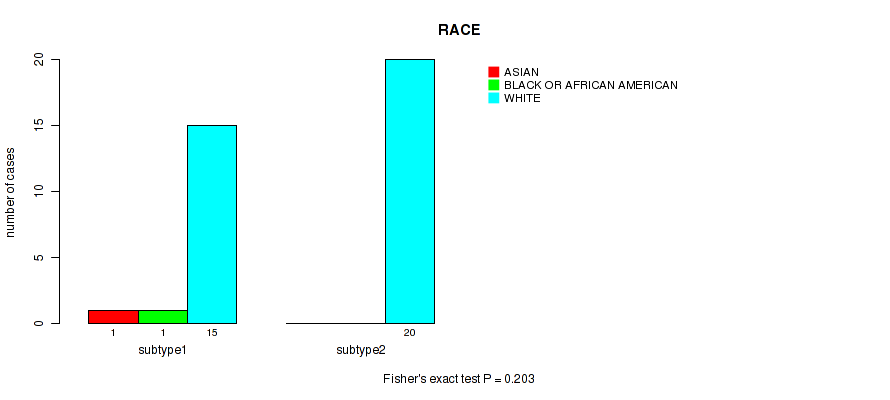
P value = 1 (Fisher's exact test), Q value = 1
Table S27. Clustering Approach #3: 'RPPA CNMF subtypes' versus Clinical Feature #8: 'ETHNICITY'
| nPatients | HISPANIC OR LATINO | NOT HISPANIC OR LATINO |
|---|---|---|
| ALL | 6 | 17 |
| subtype1 | 2 | 7 |
| subtype2 | 4 | 10 |
Figure S24. Get High-res Image Clustering Approach #3: 'RPPA CNMF subtypes' versus Clinical Feature #8: 'ETHNICITY'
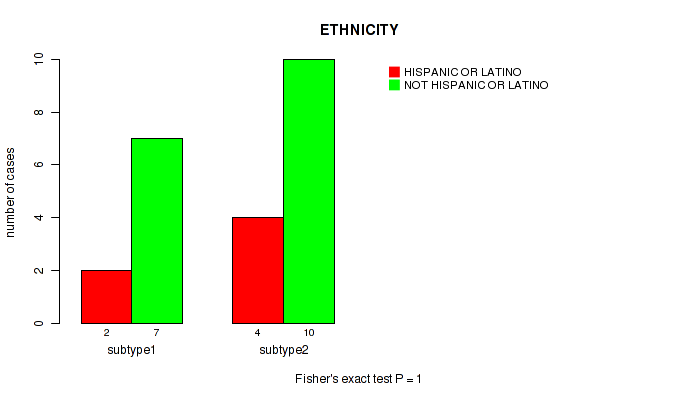
Table S28. Description of clustering approach #4: 'RPPA cHierClus subtypes'
| Cluster Labels | 1 | 2 | 3 | 4 | 5 | 6 | 7 | 8 |
|---|---|---|---|---|---|---|---|---|
| Number of samples | 8 | 7 | 7 | 3 | 4 | 4 | 7 | 6 |
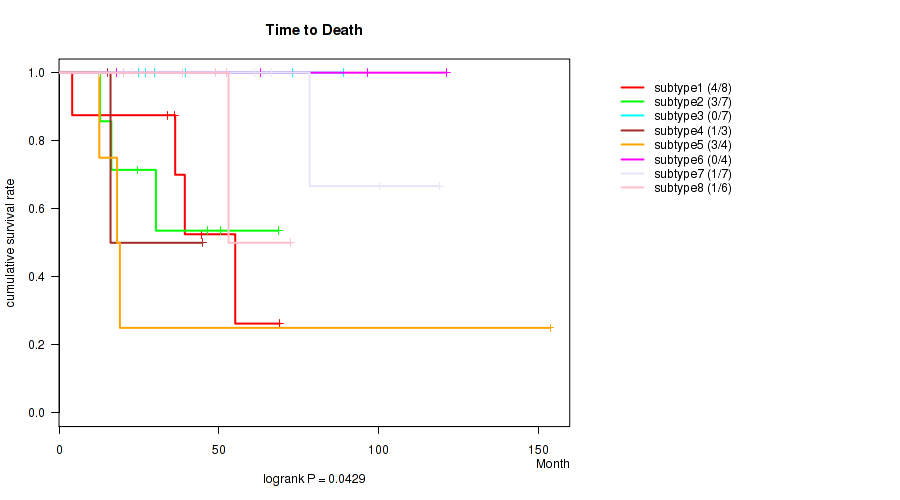
P value = 0.0429 (logrank test), Q value = 0.14
Table S29. Clustering Approach #4: 'RPPA cHierClus subtypes' versus Clinical Feature #1: 'Time to Death'
| nPatients | nDeath | Duration Range (Median), Month | |
|---|---|---|---|
| ALL | 46 | 13 | 4.1 - 153.6 (42.0) |
| subtype1 | 8 | 4 | 4.1 - 69.1 (37.8) |
| subtype2 | 7 | 3 | 12.8 - 68.8 (30.3) |
| subtype3 | 7 | 0 | 24.9 - 88.9 (39.5) |
| subtype4 | 3 | 1 | 15.2 - 44.8 (16.1) |
| subtype5 | 4 | 3 | 12.6 - 153.6 (18.6) |
| subtype6 | 4 | 0 | 18.1 - 121.2 (79.8) |
| subtype7 | 7 | 1 | 12.6 - 119.1 (66.5) |
| subtype8 | 6 | 1 | 20.2 - 72.4 (50.7) |
Figure S25. Get High-res Image Clustering Approach #4: 'RPPA cHierClus subtypes' versus Clinical Feature #1: 'Time to Death'
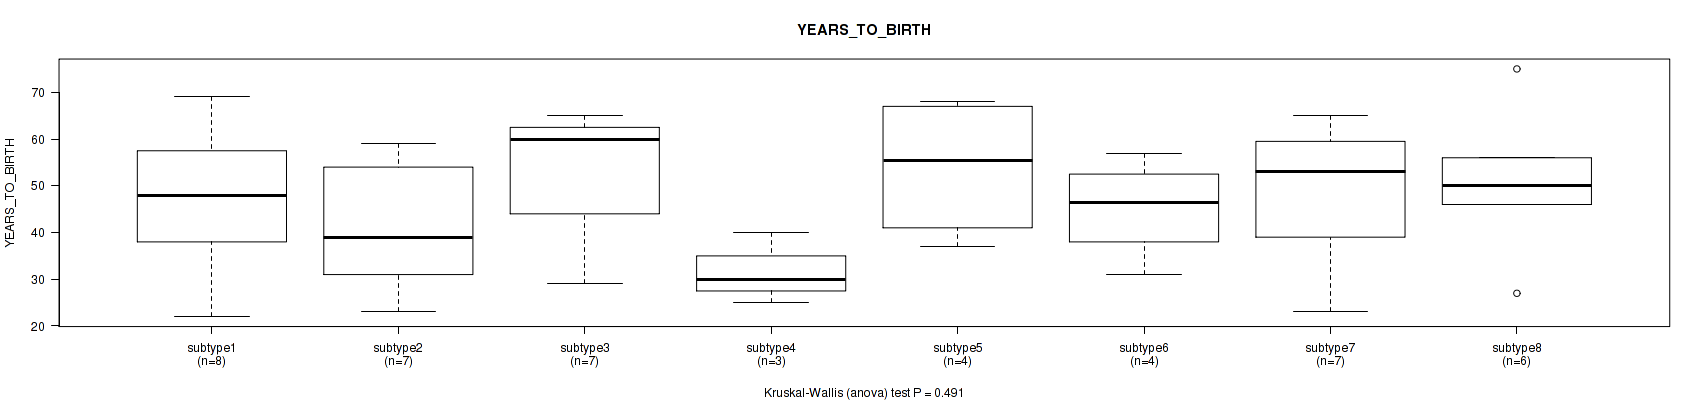
P value = 0.491 (Kruskal-Wallis (anova)), Q value = 0.64
Table S30. Clustering Approach #4: 'RPPA cHierClus subtypes' versus Clinical Feature #2: 'YEARS_TO_BIRTH'
| nPatients | Mean (Std.Dev) | |
|---|---|---|
| ALL | 46 | 47.2 (14.4) |
| subtype1 | 8 | 47.2 (15.0) |
| subtype2 | 7 | 41.6 (14.8) |
| subtype3 | 7 | 52.4 (14.2) |
| subtype4 | 3 | 31.7 (7.6) |
| subtype5 | 4 | 54.0 (15.4) |
| subtype6 | 4 | 45.2 (10.8) |
| subtype7 | 7 | 48.3 (15.4) |
| subtype8 | 6 | 50.7 (15.6) |
Figure S26. Get High-res Image Clustering Approach #4: 'RPPA cHierClus subtypes' versus Clinical Feature #2: 'YEARS_TO_BIRTH'
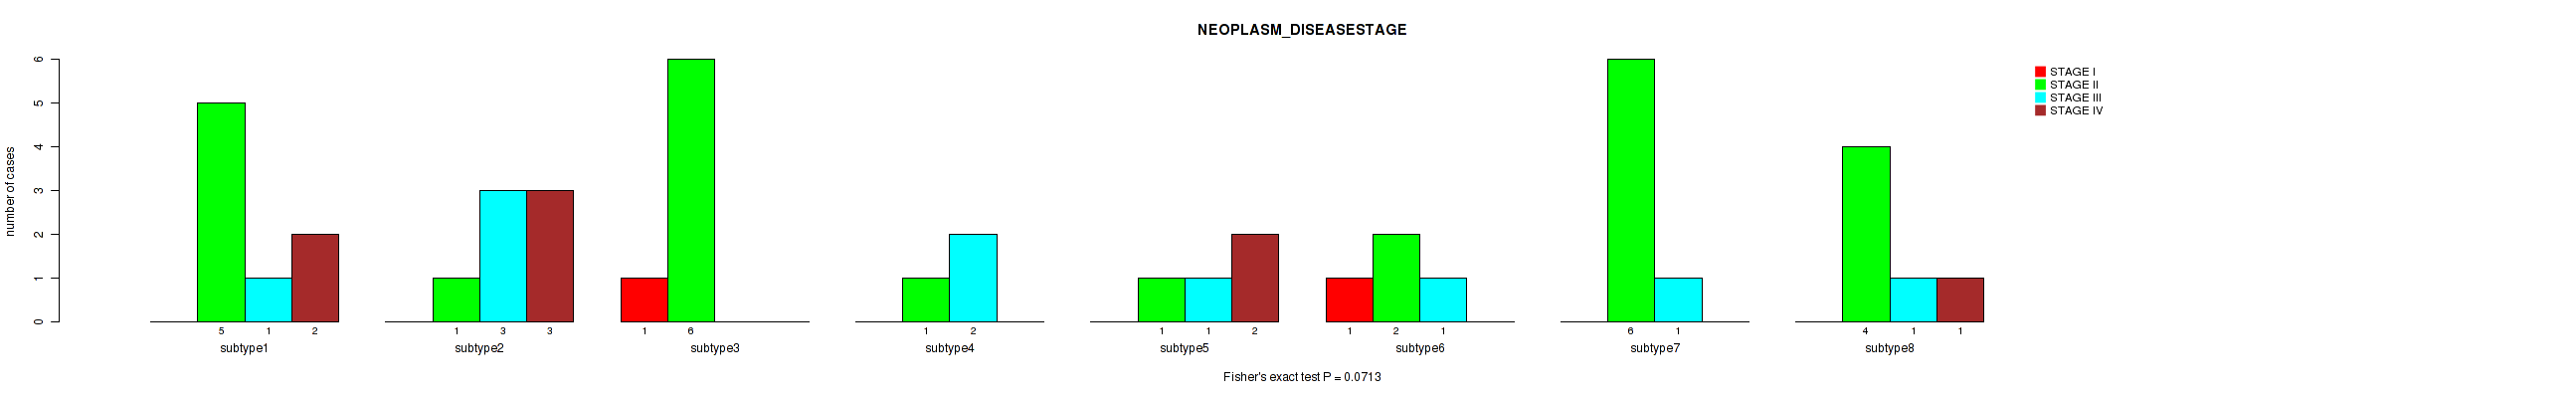
P value = 0.0713 (Fisher's exact test), Q value = 0.2
Table S31. Clustering Approach #4: 'RPPA cHierClus subtypes' versus Clinical Feature #3: 'NEOPLASM_DISEASESTAGE'
| nPatients | STAGE I | STAGE II | STAGE III | STAGE IV |
|---|---|---|---|---|
| ALL | 2 | 26 | 10 | 8 |
| subtype1 | 0 | 5 | 1 | 2 |
| subtype2 | 0 | 1 | 3 | 3 |
| subtype3 | 1 | 6 | 0 | 0 |
| subtype4 | 0 | 1 | 2 | 0 |
| subtype5 | 0 | 1 | 1 | 2 |
| subtype6 | 1 | 2 | 1 | 0 |
| subtype7 | 0 | 6 | 1 | 0 |
| subtype8 | 0 | 4 | 1 | 1 |
Figure S27. Get High-res Image Clustering Approach #4: 'RPPA cHierClus subtypes' versus Clinical Feature #3: 'NEOPLASM_DISEASESTAGE'
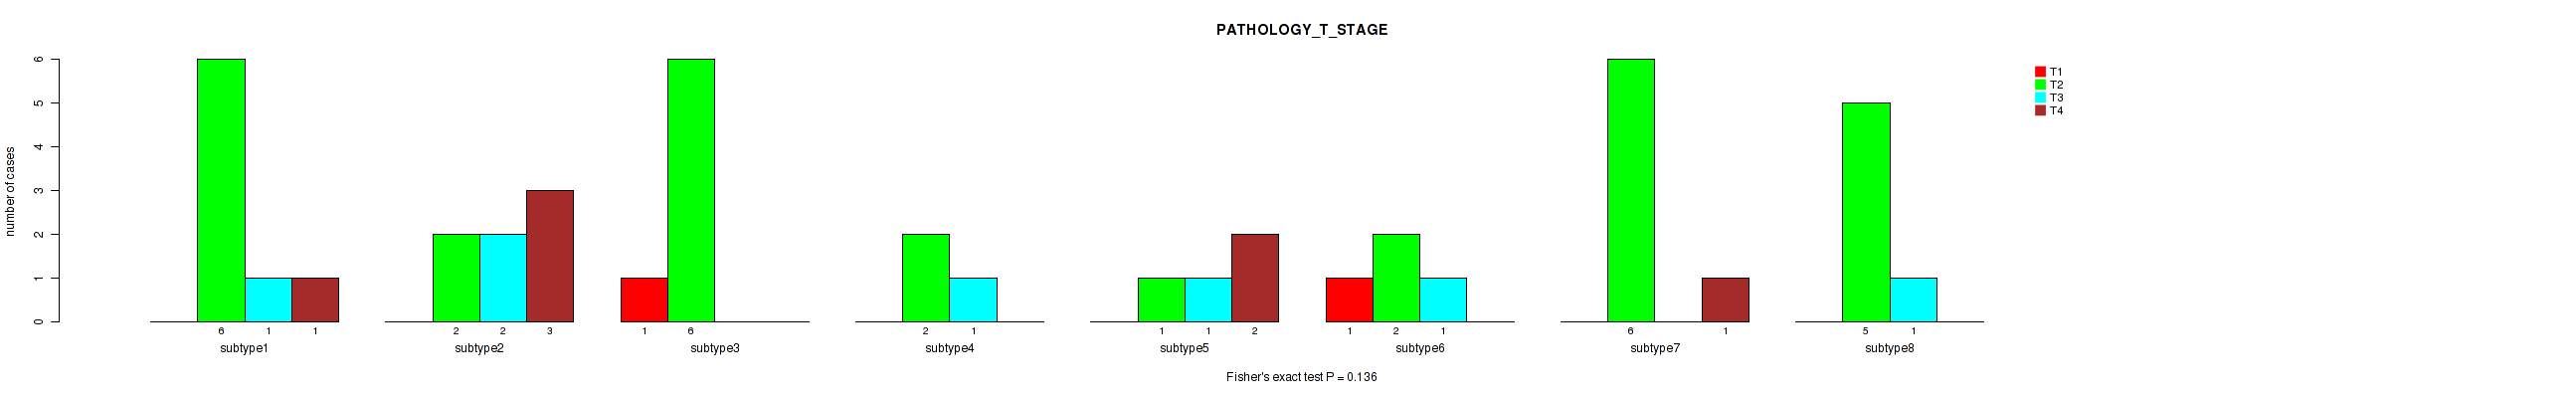
P value = 0.136 (Fisher's exact test), Q value = 0.3
Table S32. Clustering Approach #4: 'RPPA cHierClus subtypes' versus Clinical Feature #4: 'PATHOLOGY_T_STAGE'
| nPatients | T1 | T2 | T3 | T4 |
|---|---|---|---|---|
| ALL | 2 | 30 | 7 | 7 |
| subtype1 | 0 | 6 | 1 | 1 |
| subtype2 | 0 | 2 | 2 | 3 |
| subtype3 | 1 | 6 | 0 | 0 |
| subtype4 | 0 | 2 | 1 | 0 |
| subtype5 | 0 | 1 | 1 | 2 |
| subtype6 | 1 | 2 | 1 | 0 |
| subtype7 | 0 | 6 | 0 | 1 |
| subtype8 | 0 | 5 | 1 | 0 |
Figure S28. Get High-res Image Clustering Approach #4: 'RPPA cHierClus subtypes' versus Clinical Feature #4: 'PATHOLOGY_T_STAGE'
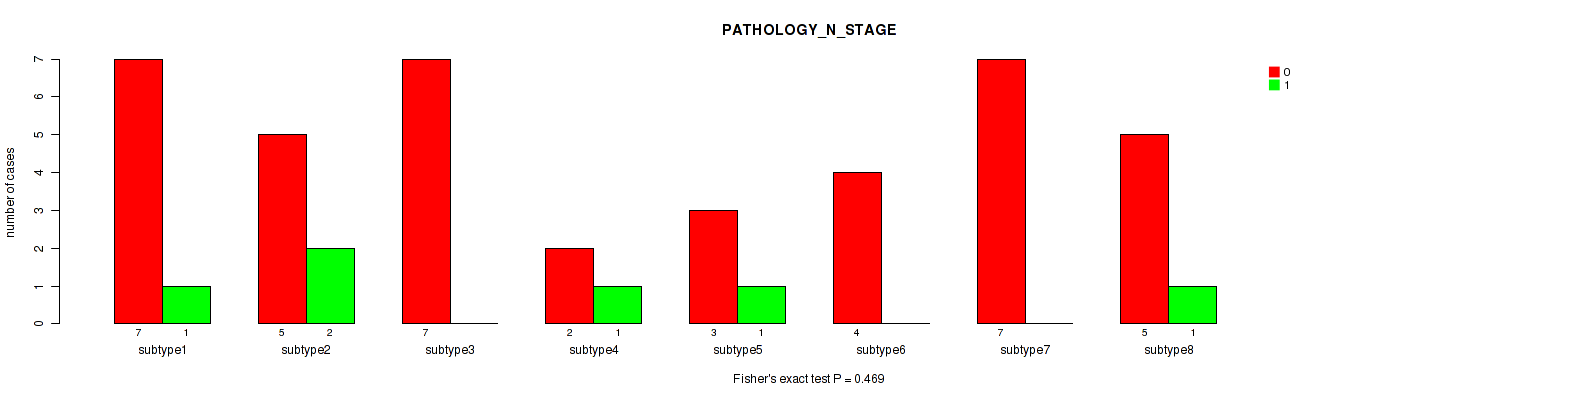
P value = 0.469 (Fisher's exact test), Q value = 0.63
Table S33. Clustering Approach #4: 'RPPA cHierClus subtypes' versus Clinical Feature #5: 'PATHOLOGY_N_STAGE'
| nPatients | 0 | 1 |
|---|---|---|
| ALL | 40 | 6 |
| subtype1 | 7 | 1 |
| subtype2 | 5 | 2 |
| subtype3 | 7 | 0 |
| subtype4 | 2 | 1 |
| subtype5 | 3 | 1 |
| subtype6 | 4 | 0 |
| subtype7 | 7 | 0 |
| subtype8 | 5 | 1 |
Figure S29. Get High-res Image Clustering Approach #4: 'RPPA cHierClus subtypes' versus Clinical Feature #5: 'PATHOLOGY_N_STAGE'
P value = 0.468 (Fisher's exact test), Q value = 0.63
Table S34. Clustering Approach #4: 'RPPA cHierClus subtypes' versus Clinical Feature #6: 'GENDER'
| nPatients | FEMALE | MALE |
|---|---|---|
| ALL | 28 | 18 |
| subtype1 | 6 | 2 |
| subtype2 | 6 | 1 |
| subtype3 | 3 | 4 |
| subtype4 | 2 | 1 |
| subtype5 | 3 | 1 |
| subtype6 | 1 | 3 |
| subtype7 | 3 | 4 |
| subtype8 | 4 | 2 |
Figure S30. Get High-res Image Clustering Approach #4: 'RPPA cHierClus subtypes' versus Clinical Feature #6: 'GENDER'
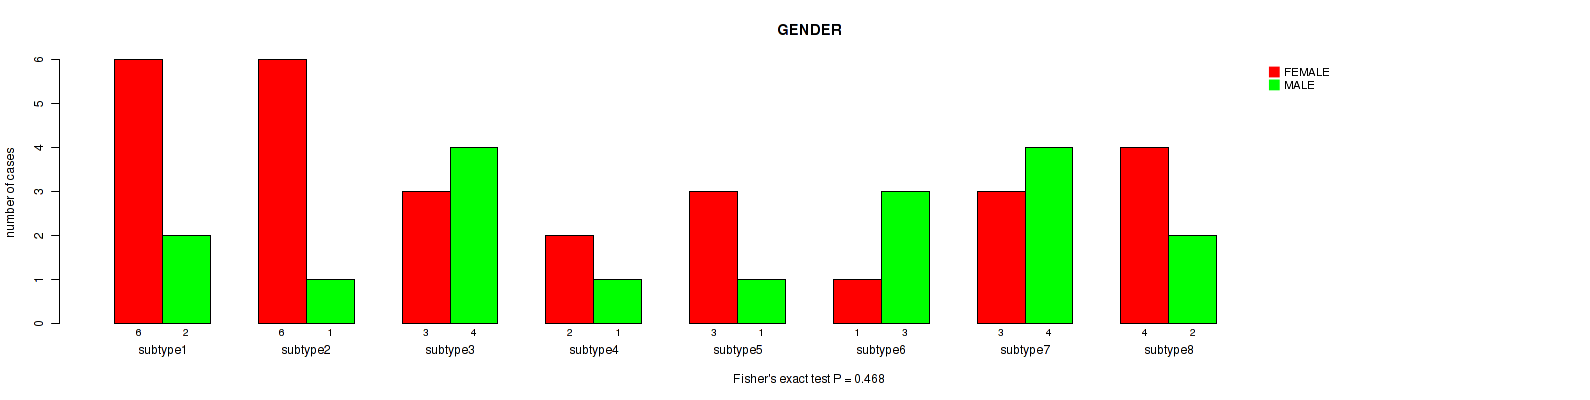
P value = 0.264 (Fisher's exact test), Q value = 0.42
Table S35. Clustering Approach #4: 'RPPA cHierClus subtypes' versus Clinical Feature #7: 'RACE'
| nPatients | ASIAN | BLACK OR AFRICAN AMERICAN | WHITE |
|---|---|---|---|
| ALL | 1 | 1 | 35 |
| subtype1 | 0 | 0 | 6 |
| subtype2 | 0 | 0 | 7 |
| subtype3 | 0 | 1 | 3 |
| subtype4 | 0 | 0 | 3 |
| subtype5 | 0 | 0 | 4 |
| subtype6 | 0 | 0 | 2 |
| subtype7 | 0 | 0 | 6 |
| subtype8 | 1 | 0 | 4 |
Figure S31. Get High-res Image Clustering Approach #4: 'RPPA cHierClus subtypes' versus Clinical Feature #7: 'RACE'
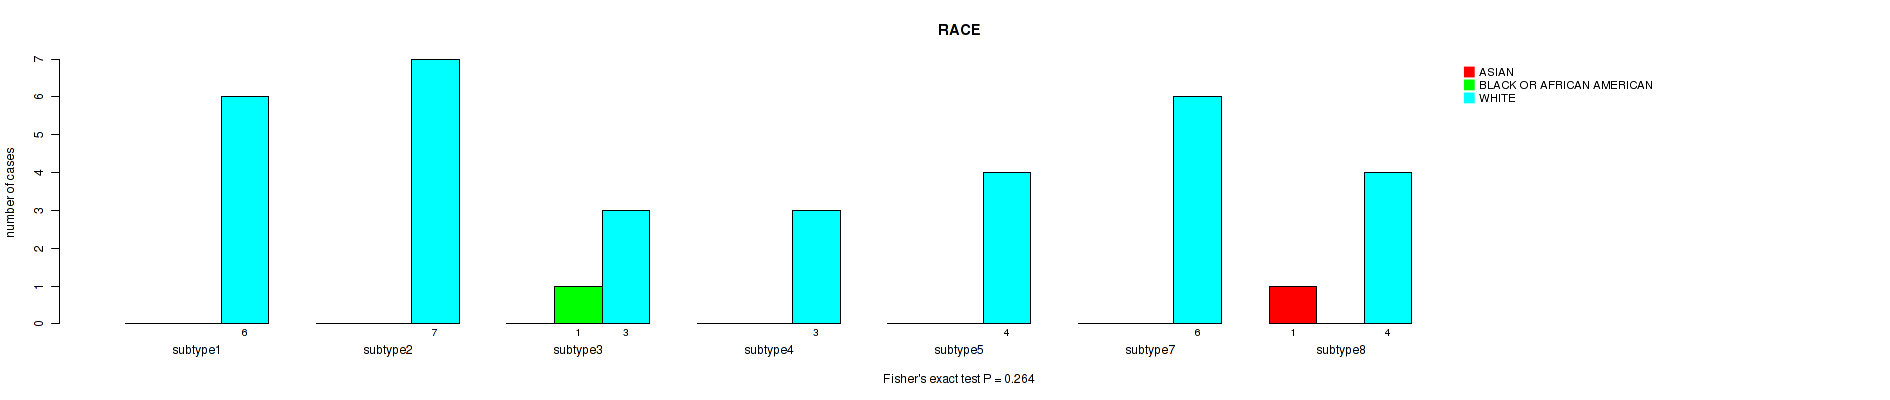
P value = 0.758 (Fisher's exact test), Q value = 0.87
Table S36. Clustering Approach #4: 'RPPA cHierClus subtypes' versus Clinical Feature #8: 'ETHNICITY'
| nPatients | HISPANIC OR LATINO | NOT HISPANIC OR LATINO |
|---|---|---|
| ALL | 6 | 17 |
| subtype1 | 2 | 3 |
| subtype2 | 1 | 4 |
| subtype3 | 1 | 1 |
| subtype4 | 1 | 1 |
| subtype5 | 1 | 2 |
| subtype6 | 0 | 0 |
| subtype7 | 0 | 2 |
| subtype8 | 0 | 4 |
Figure S32. Get High-res Image Clustering Approach #4: 'RPPA cHierClus subtypes' versus Clinical Feature #8: 'ETHNICITY'
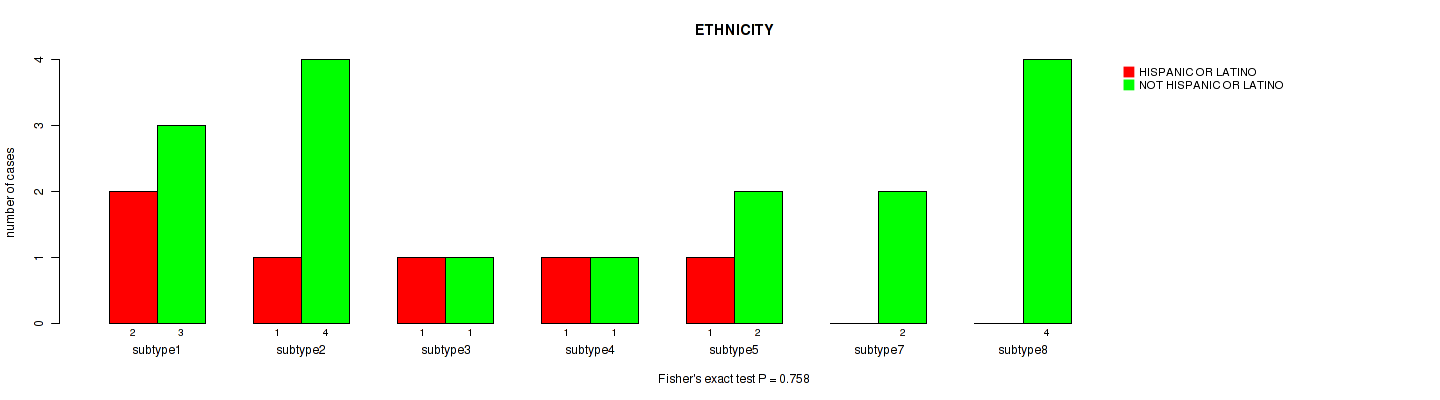
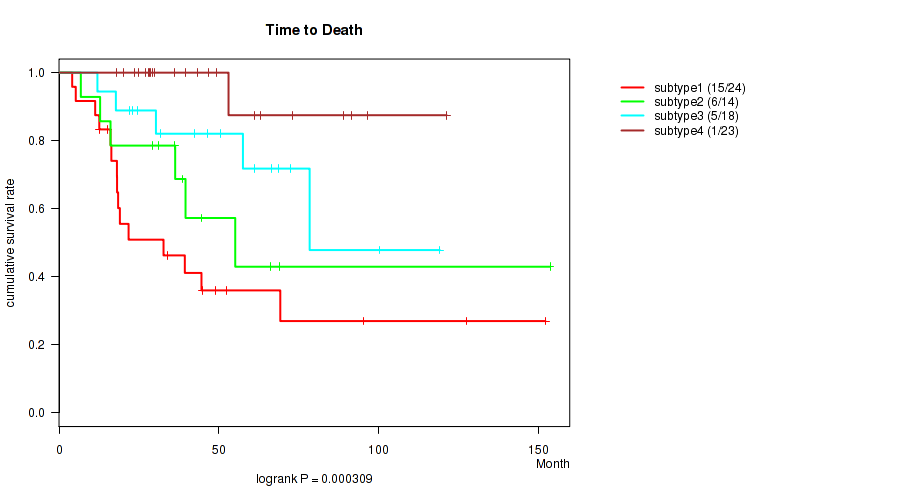
Table S37. Description of clustering approach #5: 'RNAseq CNMF subtypes'
| Cluster Labels | 1 | 2 | 3 | 4 |
|---|---|---|---|---|
| Number of samples | 24 | 14 | 18 | 23 |
P value = 0.000309 (logrank test), Q value = 0.0065
Table S38. Clustering Approach #5: 'RNAseq CNMF subtypes' versus Clinical Feature #1: 'Time to Death'
| nPatients | nDeath | Duration Range (Median), Month | |
|---|---|---|---|
| ALL | 79 | 27 | 4.1 - 153.6 (36.3) |
| subtype1 | 24 | 15 | 4.1 - 152.2 (20.4) |
| subtype2 | 14 | 6 | 6.8 - 153.6 (37.4) |
| subtype3 | 18 | 5 | 12.0 - 119.1 (48.4) |
| subtype4 | 23 | 1 | 18.1 - 121.2 (39.5) |
Figure S33. Get High-res Image Clustering Approach #5: 'RNAseq CNMF subtypes' versus Clinical Feature #1: 'Time to Death'
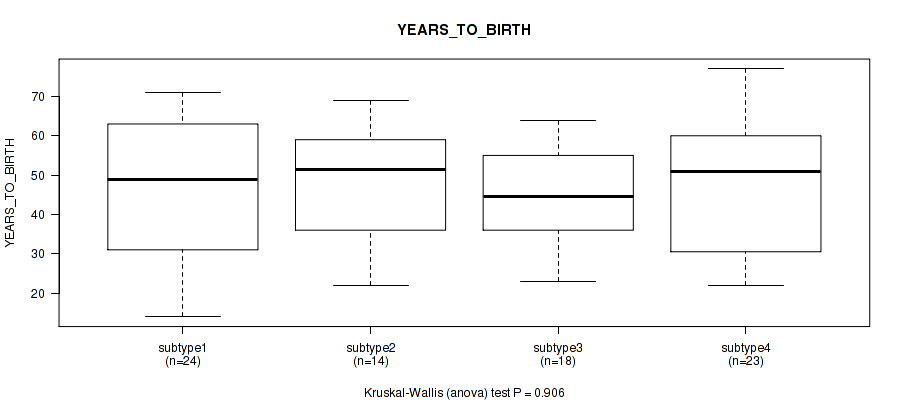
P value = 0.906 (Kruskal-Wallis (anova)), Q value = 0.99
Table S39. Clustering Approach #5: 'RNAseq CNMF subtypes' versus Clinical Feature #2: 'YEARS_TO_BIRTH'
| nPatients | Mean (Std.Dev) | |
|---|---|---|
| ALL | 79 | 46.7 (15.8) |
| subtype1 | 24 | 46.7 (18.2) |
| subtype2 | 14 | 47.3 (14.9) |
| subtype3 | 18 | 44.7 (12.8) |
| subtype4 | 23 | 47.9 (16.5) |
Figure S34. Get High-res Image Clustering Approach #5: 'RNAseq CNMF subtypes' versus Clinical Feature #2: 'YEARS_TO_BIRTH'
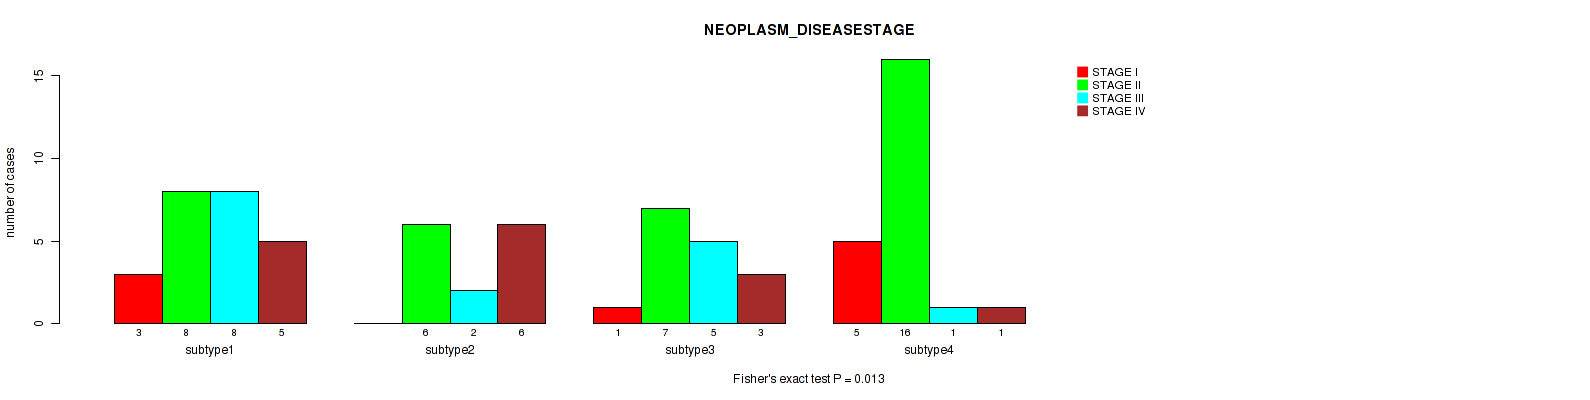
P value = 0.013 (Fisher's exact test), Q value = 0.061
Table S40. Clustering Approach #5: 'RNAseq CNMF subtypes' versus Clinical Feature #3: 'NEOPLASM_DISEASESTAGE'
| nPatients | STAGE I | STAGE II | STAGE III | STAGE IV |
|---|---|---|---|---|
| ALL | 9 | 37 | 16 | 15 |
| subtype1 | 3 | 8 | 8 | 5 |
| subtype2 | 0 | 6 | 2 | 6 |
| subtype3 | 1 | 7 | 5 | 3 |
| subtype4 | 5 | 16 | 1 | 1 |
Figure S35. Get High-res Image Clustering Approach #5: 'RNAseq CNMF subtypes' versus Clinical Feature #3: 'NEOPLASM_DISEASESTAGE'
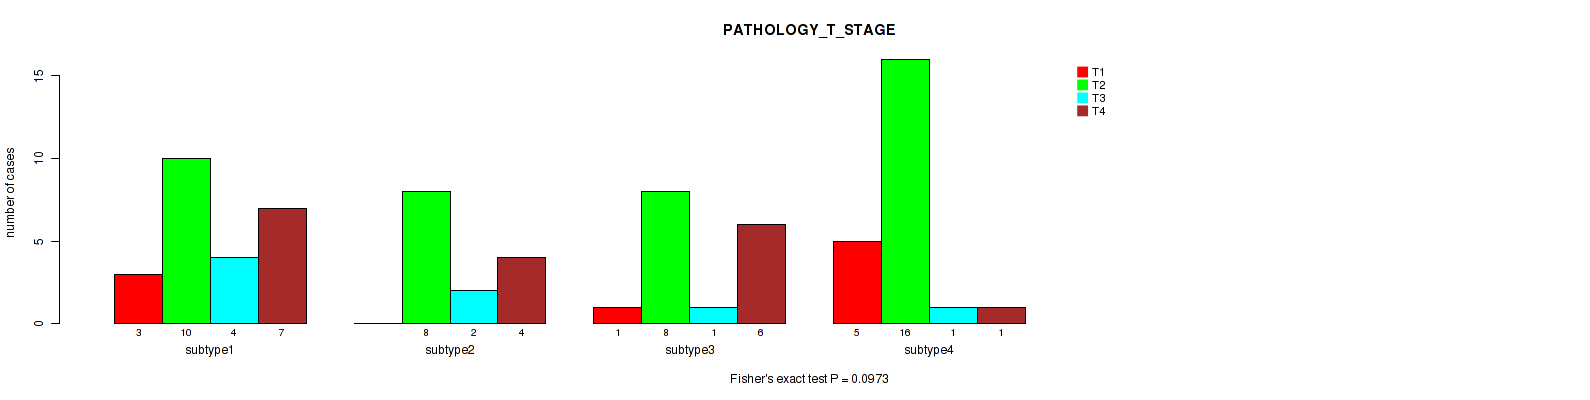
P value = 0.0973 (Fisher's exact test), Q value = 0.24
Table S41. Clustering Approach #5: 'RNAseq CNMF subtypes' versus Clinical Feature #4: 'PATHOLOGY_T_STAGE'
| nPatients | T1 | T2 | T3 | T4 |
|---|---|---|---|---|
| ALL | 9 | 42 | 8 | 18 |
| subtype1 | 3 | 10 | 4 | 7 |
| subtype2 | 0 | 8 | 2 | 4 |
| subtype3 | 1 | 8 | 1 | 6 |
| subtype4 | 5 | 16 | 1 | 1 |
Figure S36. Get High-res Image Clustering Approach #5: 'RNAseq CNMF subtypes' versus Clinical Feature #4: 'PATHOLOGY_T_STAGE'
P value = 0.0483 (Fisher's exact test), Q value = 0.15
Table S42. Clustering Approach #5: 'RNAseq CNMF subtypes' versus Clinical Feature #5: 'PATHOLOGY_N_STAGE'
| nPatients | 0 | 1 |
|---|---|---|
| ALL | 68 | 9 |
| subtype1 | 21 | 3 |
| subtype2 | 10 | 4 |
| subtype3 | 14 | 2 |
| subtype4 | 23 | 0 |
Figure S37. Get High-res Image Clustering Approach #5: 'RNAseq CNMF subtypes' versus Clinical Feature #5: 'PATHOLOGY_N_STAGE'
P value = 0.239 (Fisher's exact test), Q value = 0.41
Table S43. Clustering Approach #5: 'RNAseq CNMF subtypes' versus Clinical Feature #6: 'GENDER'
| nPatients | FEMALE | MALE |
|---|---|---|
| ALL | 48 | 31 |
| subtype1 | 16 | 8 |
| subtype2 | 11 | 3 |
| subtype3 | 8 | 10 |
| subtype4 | 13 | 10 |
Figure S38. Get High-res Image Clustering Approach #5: 'RNAseq CNMF subtypes' versus Clinical Feature #6: 'GENDER'
P value = 0.303 (Fisher's exact test), Q value = 0.47
Table S44. Clustering Approach #5: 'RNAseq CNMF subtypes' versus Clinical Feature #7: 'RACE'
| nPatients | ASIAN | BLACK OR AFRICAN AMERICAN | WHITE |
|---|---|---|---|
| ALL | 1 | 1 | 66 |
| subtype1 | 0 | 0 | 24 |
| subtype2 | 0 | 0 | 12 |
| subtype3 | 0 | 0 | 16 |
| subtype4 | 1 | 1 | 14 |
Figure S39. Get High-res Image Clustering Approach #5: 'RNAseq CNMF subtypes' versus Clinical Feature #7: 'RACE'
P value = 0.944 (Fisher's exact test), Q value = 1
Table S45. Clustering Approach #5: 'RNAseq CNMF subtypes' versus Clinical Feature #8: 'ETHNICITY'
| nPatients | HISPANIC OR LATINO | NOT HISPANIC OR LATINO |
|---|---|---|
| ALL | 7 | 30 |
| subtype1 | 2 | 11 |
| subtype2 | 2 | 7 |
| subtype3 | 2 | 6 |
| subtype4 | 1 | 6 |
Figure S40. Get High-res Image Clustering Approach #5: 'RNAseq CNMF subtypes' versus Clinical Feature #8: 'ETHNICITY'
Table S46. Description of clustering approach #6: 'RNAseq cHierClus subtypes'
| Cluster Labels | 1 | 2 | 3 | 4 |
|---|---|---|---|---|
| Number of samples | 23 | 24 | 7 | 25 |
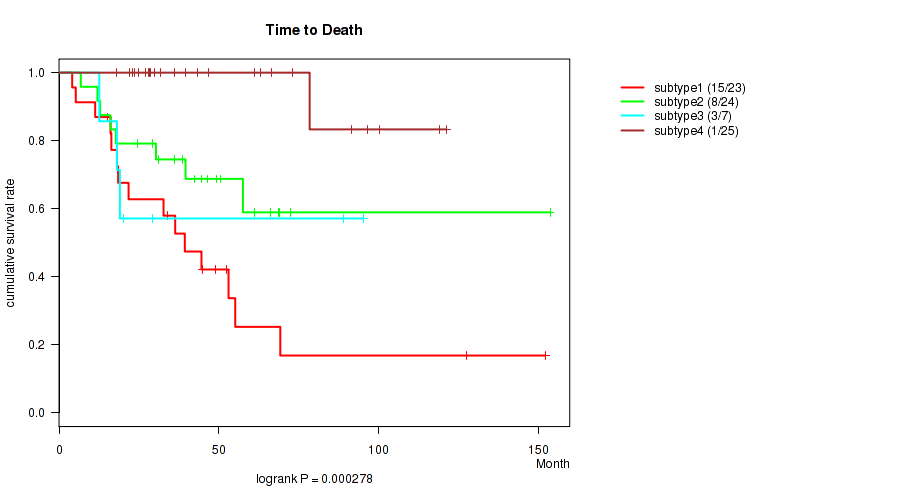
P value = 0.000278 (logrank test), Q value = 0.0065
Table S47. Clustering Approach #6: 'RNAseq cHierClus subtypes' versus Clinical Feature #1: 'Time to Death'
| nPatients | nDeath | Duration Range (Median), Month | |
|---|---|---|---|
| ALL | 79 | 27 | 4.1 - 153.6 (36.3) |
| subtype1 | 23 | 15 | 4.1 - 152.2 (33.8) |
| subtype2 | 24 | 8 | 6.8 - 153.6 (41.0) |
| subtype3 | 7 | 3 | 12.6 - 95.2 (20.2) |
| subtype4 | 25 | 1 | 18.1 - 121.2 (39.5) |
Figure S41. Get High-res Image Clustering Approach #6: 'RNAseq cHierClus subtypes' versus Clinical Feature #1: 'Time to Death'
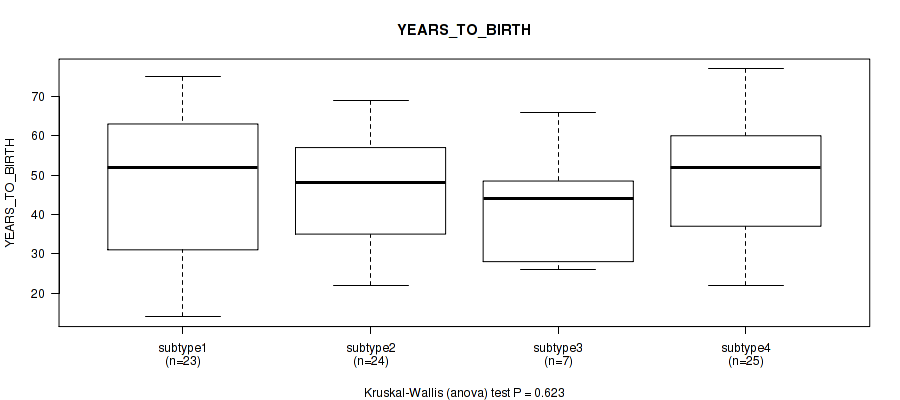
P value = 0.623 (Kruskal-Wallis (anova)), Q value = 0.79
Table S48. Clustering Approach #6: 'RNAseq cHierClus subtypes' versus Clinical Feature #2: 'YEARS_TO_BIRTH'
| nPatients | Mean (Std.Dev) | |
|---|---|---|
| ALL | 79 | 46.7 (15.8) |
| subtype1 | 23 | 47.3 (19.2) |
| subtype2 | 24 | 45.1 (14.7) |
| subtype3 | 7 | 41.3 (14.9) |
| subtype4 | 25 | 49.2 (13.8) |
Figure S42. Get High-res Image Clustering Approach #6: 'RNAseq cHierClus subtypes' versus Clinical Feature #2: 'YEARS_TO_BIRTH'
P value = 0.00442 (Fisher's exact test), Q value = 0.029
Table S49. Clustering Approach #6: 'RNAseq cHierClus subtypes' versus Clinical Feature #3: 'NEOPLASM_DISEASESTAGE'
| nPatients | STAGE I | STAGE II | STAGE III | STAGE IV |
|---|---|---|---|---|
| ALL | 9 | 37 | 16 | 15 |
| subtype1 | 2 | 9 | 7 | 5 |
| subtype2 | 0 | 9 | 5 | 8 |
| subtype3 | 2 | 2 | 1 | 2 |
| subtype4 | 5 | 17 | 3 | 0 |
Figure S43. Get High-res Image Clustering Approach #6: 'RNAseq cHierClus subtypes' versus Clinical Feature #3: 'NEOPLASM_DISEASESTAGE'
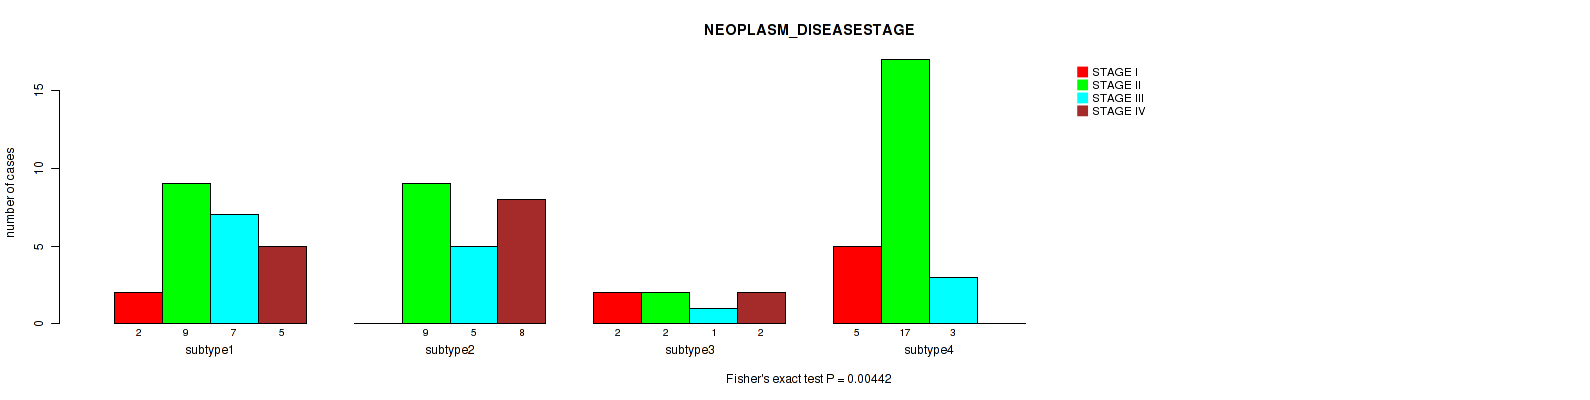
P value = 0.0359 (Fisher's exact test), Q value = 0.12
Table S50. Clustering Approach #6: 'RNAseq cHierClus subtypes' versus Clinical Feature #4: 'PATHOLOGY_T_STAGE'
| nPatients | T1 | T2 | T3 | T4 |
|---|---|---|---|---|
| ALL | 9 | 42 | 8 | 18 |
| subtype1 | 2 | 12 | 4 | 5 |
| subtype2 | 0 | 11 | 2 | 9 |
| subtype3 | 2 | 2 | 1 | 2 |
| subtype4 | 5 | 17 | 1 | 2 |
Figure S44. Get High-res Image Clustering Approach #6: 'RNAseq cHierClus subtypes' versus Clinical Feature #4: 'PATHOLOGY_T_STAGE'
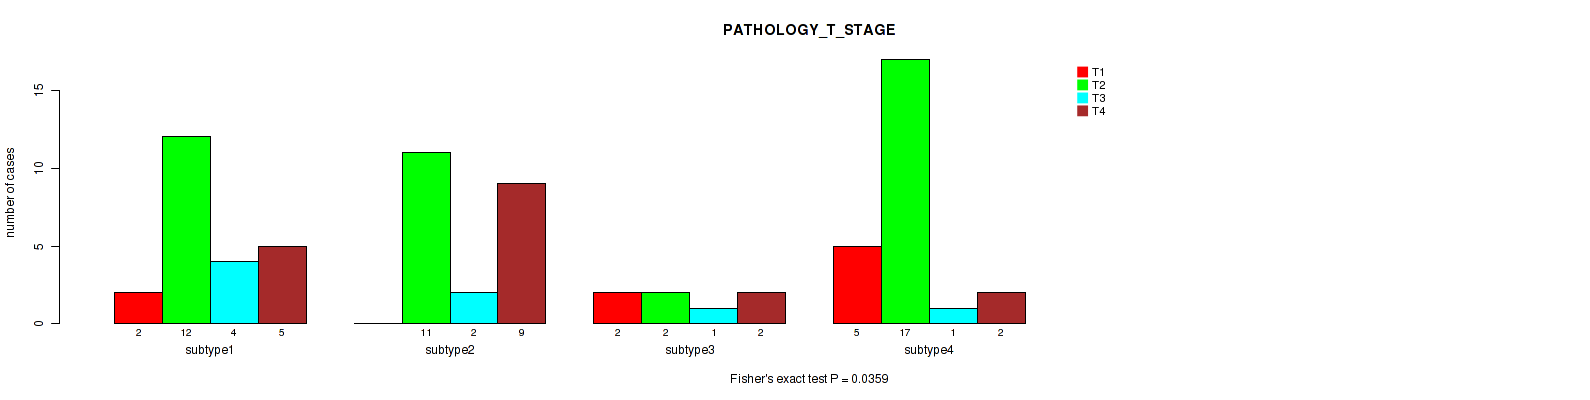
P value = 0.0357 (Fisher's exact test), Q value = 0.12
Table S51. Clustering Approach #6: 'RNAseq cHierClus subtypes' versus Clinical Feature #5: 'PATHOLOGY_N_STAGE'
| nPatients | 0 | 1 |
|---|---|---|
| ALL | 68 | 9 |
| subtype1 | 19 | 4 |
| subtype2 | 17 | 5 |
| subtype3 | 7 | 0 |
| subtype4 | 25 | 0 |
Figure S45. Get High-res Image Clustering Approach #6: 'RNAseq cHierClus subtypes' versus Clinical Feature #5: 'PATHOLOGY_N_STAGE'
P value = 0.359 (Fisher's exact test), Q value = 0.53
Table S52. Clustering Approach #6: 'RNAseq cHierClus subtypes' versus Clinical Feature #6: 'GENDER'
| nPatients | FEMALE | MALE |
|---|---|---|
| ALL | 48 | 31 |
| subtype1 | 17 | 6 |
| subtype2 | 13 | 11 |
| subtype3 | 5 | 2 |
| subtype4 | 13 | 12 |
Figure S46. Get High-res Image Clustering Approach #6: 'RNAseq cHierClus subtypes' versus Clinical Feature #6: 'GENDER'
P value = 0.00924 (Fisher's exact test), Q value = 0.046
Table S53. Clustering Approach #6: 'RNAseq cHierClus subtypes' versus Clinical Feature #7: 'RACE'
| nPatients | ASIAN | BLACK OR AFRICAN AMERICAN | WHITE |
|---|---|---|---|
| ALL | 1 | 1 | 66 |
| subtype1 | 0 | 0 | 22 |
| subtype2 | 0 | 0 | 20 |
| subtype3 | 1 | 1 | 5 |
| subtype4 | 0 | 0 | 19 |
Figure S47. Get High-res Image Clustering Approach #6: 'RNAseq cHierClus subtypes' versus Clinical Feature #7: 'RACE'
P value = 0.24 (Fisher's exact test), Q value = 0.41
Table S54. Clustering Approach #6: 'RNAseq cHierClus subtypes' versus Clinical Feature #8: 'ETHNICITY'
| nPatients | HISPANIC OR LATINO | NOT HISPANIC OR LATINO |
|---|---|---|
| ALL | 7 | 30 |
| subtype1 | 2 | 10 |
| subtype2 | 3 | 9 |
| subtype3 | 2 | 3 |
| subtype4 | 0 | 8 |
Figure S48. Get High-res Image Clustering Approach #6: 'RNAseq cHierClus subtypes' versus Clinical Feature #8: 'ETHNICITY'
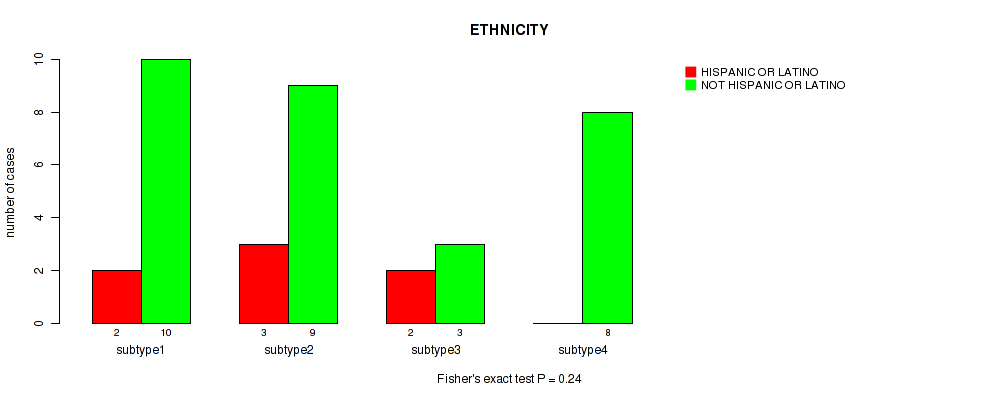
Table S55. Description of clustering approach #7: 'MIRSEQ CNMF'
| Cluster Labels | 1 | 2 | 3 |
|---|---|---|---|
| Number of samples | 38 | 16 | 26 |
P value = 0.00588 (logrank test), Q value = 0.031
Table S56. Clustering Approach #7: 'MIRSEQ CNMF' versus Clinical Feature #1: 'Time to Death'
| nPatients | nDeath | Duration Range (Median), Month | |
|---|---|---|---|
| ALL | 80 | 28 | 4.1 - 153.6 (36.3) |
| subtype1 | 38 | 16 | 4.1 - 127.5 (34.4) |
| subtype2 | 16 | 9 | 12.6 - 153.6 (29.2) |
| subtype3 | 26 | 3 | 18.1 - 121.2 (45.1) |
Figure S49. Get High-res Image Clustering Approach #7: 'MIRSEQ CNMF' versus Clinical Feature #1: 'Time to Death'
P value = 0.219 (Kruskal-Wallis (anova)), Q value = 0.41
Table S57. Clustering Approach #7: 'MIRSEQ CNMF' versus Clinical Feature #2: 'YEARS_TO_BIRTH'
| nPatients | Mean (Std.Dev) | |
|---|---|---|
| ALL | 80 | 46.4 (15.9) |
| subtype1 | 38 | 43.0 (15.8) |
| subtype2 | 16 | 50.1 (17.0) |
| subtype3 | 26 | 49.0 (14.8) |
Figure S50. Get High-res Image Clustering Approach #7: 'MIRSEQ CNMF' versus Clinical Feature #2: 'YEARS_TO_BIRTH'
P value = 0.00051 (Fisher's exact test), Q value = 0.0065
Table S58. Clustering Approach #7: 'MIRSEQ CNMF' versus Clinical Feature #3: 'NEOPLASM_DISEASESTAGE'
| nPatients | STAGE I | STAGE II | STAGE III | STAGE IV |
|---|---|---|---|---|
| ALL | 9 | 37 | 16 | 16 |
| subtype1 | 3 | 14 | 12 | 9 |
| subtype2 | 1 | 5 | 2 | 7 |
| subtype3 | 5 | 18 | 2 | 0 |
Figure S51. Get High-res Image Clustering Approach #7: 'MIRSEQ CNMF' versus Clinical Feature #3: 'NEOPLASM_DISEASESTAGE'
P value = 0.00531 (Fisher's exact test), Q value = 0.031
Table S59. Clustering Approach #7: 'MIRSEQ CNMF' versus Clinical Feature #4: 'PATHOLOGY_T_STAGE'
| nPatients | T1 | T2 | T3 | T4 |
|---|---|---|---|---|
| ALL | 9 | 42 | 9 | 18 |
| subtype1 | 3 | 18 | 4 | 13 |
| subtype2 | 1 | 6 | 3 | 5 |
| subtype3 | 5 | 18 | 2 | 0 |
Figure S52. Get High-res Image Clustering Approach #7: 'MIRSEQ CNMF' versus Clinical Feature #4: 'PATHOLOGY_T_STAGE'
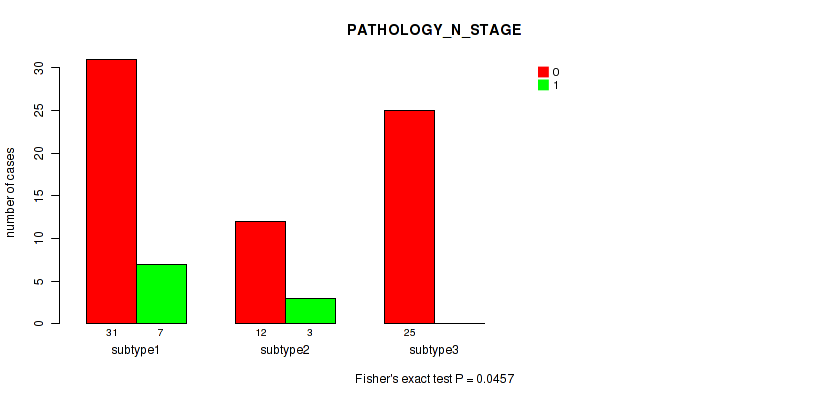
P value = 0.0457 (Fisher's exact test), Q value = 0.15
Table S60. Clustering Approach #7: 'MIRSEQ CNMF' versus Clinical Feature #5: 'PATHOLOGY_N_STAGE'
| nPatients | 0 | 1 |
|---|---|---|
| ALL | 68 | 10 |
| subtype1 | 31 | 7 |
| subtype2 | 12 | 3 |
| subtype3 | 25 | 0 |
Figure S53. Get High-res Image Clustering Approach #7: 'MIRSEQ CNMF' versus Clinical Feature #5: 'PATHOLOGY_N_STAGE'
P value = 0.138 (Fisher's exact test), Q value = 0.3
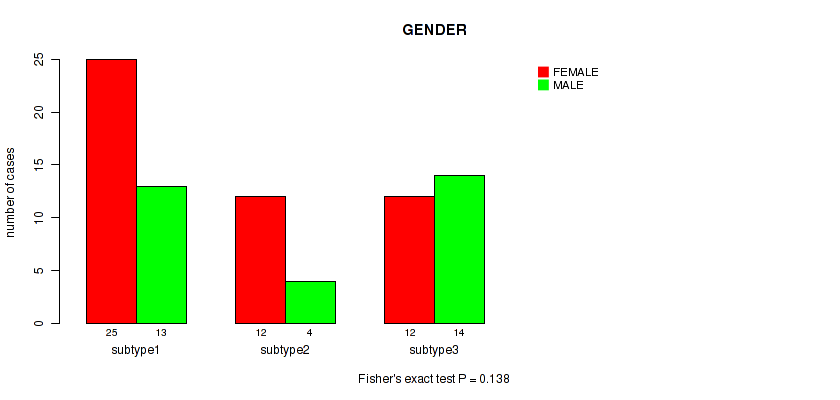
Table S61. Clustering Approach #7: 'MIRSEQ CNMF' versus Clinical Feature #6: 'GENDER'
| nPatients | FEMALE | MALE |
|---|---|---|
| ALL | 49 | 31 |
| subtype1 | 25 | 13 |
| subtype2 | 12 | 4 |
| subtype3 | 12 | 14 |
Figure S54. Get High-res Image Clustering Approach #7: 'MIRSEQ CNMF' versus Clinical Feature #6: 'GENDER'
P value = 1 (Fisher's exact test), Q value = 1
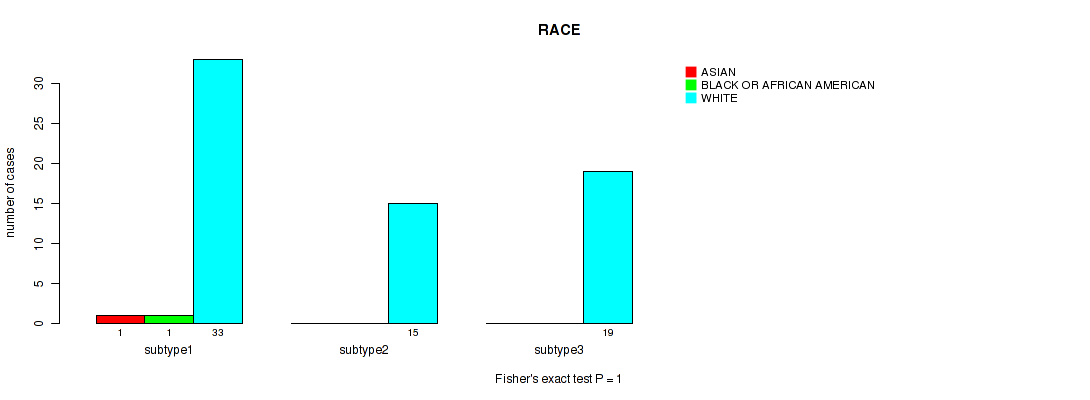
Table S62. Clustering Approach #7: 'MIRSEQ CNMF' versus Clinical Feature #7: 'RACE'
| nPatients | ASIAN | BLACK OR AFRICAN AMERICAN | WHITE |
|---|---|---|---|
| ALL | 1 | 1 | 67 |
| subtype1 | 1 | 1 | 33 |
| subtype2 | 0 | 0 | 15 |
| subtype3 | 0 | 0 | 19 |
Figure S55. Get High-res Image Clustering Approach #7: 'MIRSEQ CNMF' versus Clinical Feature #7: 'RACE'
P value = 0.385 (Fisher's exact test), Q value = 0.55
Table S63. Clustering Approach #7: 'MIRSEQ CNMF' versus Clinical Feature #8: 'ETHNICITY'
| nPatients | HISPANIC OR LATINO | NOT HISPANIC OR LATINO |
|---|---|---|
| ALL | 8 | 30 |
| subtype1 | 5 | 18 |
| subtype2 | 3 | 6 |
| subtype3 | 0 | 6 |
Figure S56. Get High-res Image Clustering Approach #7: 'MIRSEQ CNMF' versus Clinical Feature #8: 'ETHNICITY'
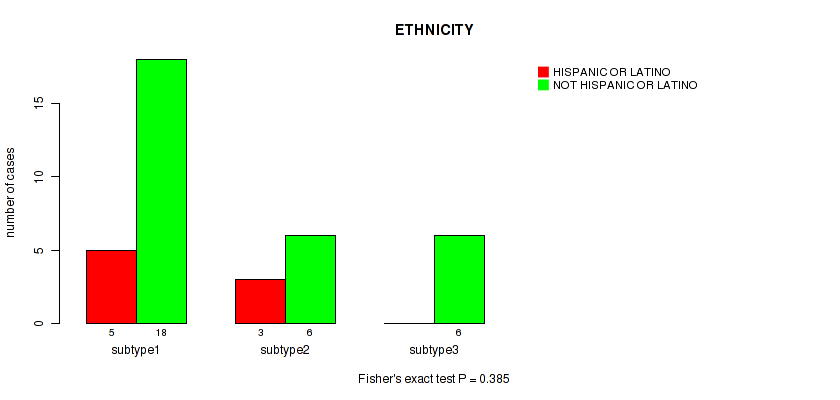
Table S64. Description of clustering approach #8: 'MIRSEQ CHIERARCHICAL'
| Cluster Labels | 1 | 2 | 3 | 4 | 5 |
|---|---|---|---|---|---|
| Number of samples | 17 | 27 | 12 | 20 | 4 |
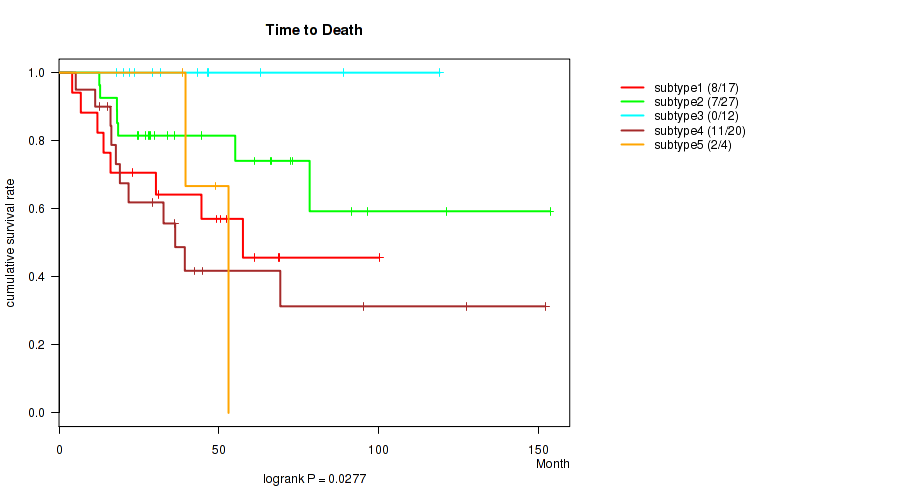
P value = 0.0277 (logrank test), Q value = 0.11
Table S65. Clustering Approach #8: 'MIRSEQ CHIERARCHICAL' versus Clinical Feature #1: 'Time to Death'
| nPatients | nDeath | Duration Range (Median), Month | |
|---|---|---|---|
| ALL | 80 | 28 | 4.1 - 153.6 (36.3) |
| subtype1 | 17 | 8 | 4.1 - 100.2 (44.5) |
| subtype2 | 27 | 7 | 12.6 - 153.6 (36.3) |
| subtype3 | 12 | 0 | 18.1 - 119.1 (37.5) |
| subtype4 | 20 | 11 | 5.2 - 152.2 (30.9) |
| subtype5 | 4 | 2 | 38.5 - 53.0 (44.3) |
Figure S57. Get High-res Image Clustering Approach #8: 'MIRSEQ CHIERARCHICAL' versus Clinical Feature #1: 'Time to Death'
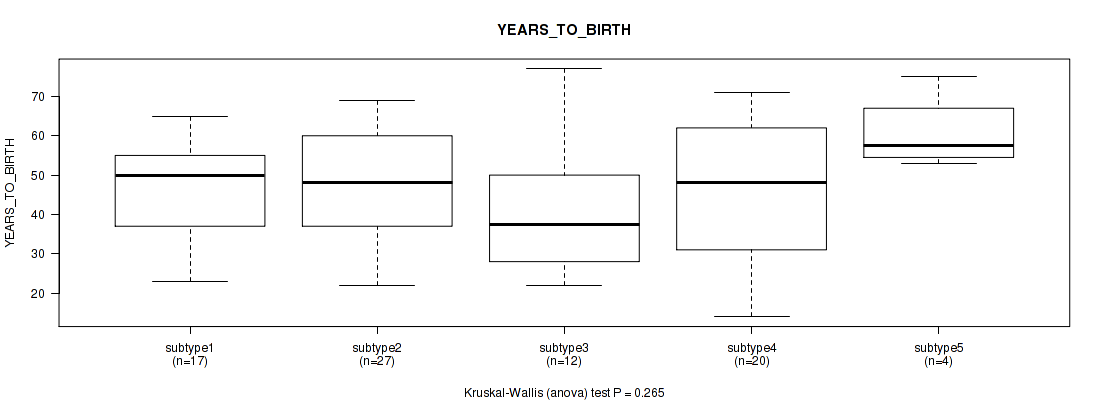
P value = 0.265 (Kruskal-Wallis (anova)), Q value = 0.42
Table S66. Clustering Approach #8: 'MIRSEQ CHIERARCHICAL' versus Clinical Feature #2: 'YEARS_TO_BIRTH'
| nPatients | Mean (Std.Dev) | |
|---|---|---|
| ALL | 80 | 46.4 (15.9) |
| subtype1 | 17 | 46.3 (14.3) |
| subtype2 | 27 | 47.7 (14.7) |
| subtype3 | 12 | 40.5 (15.9) |
| subtype4 | 20 | 45.4 (18.8) |
| subtype5 | 4 | 60.8 (9.8) |
Figure S58. Get High-res Image Clustering Approach #8: 'MIRSEQ CHIERARCHICAL' versus Clinical Feature #2: 'YEARS_TO_BIRTH'
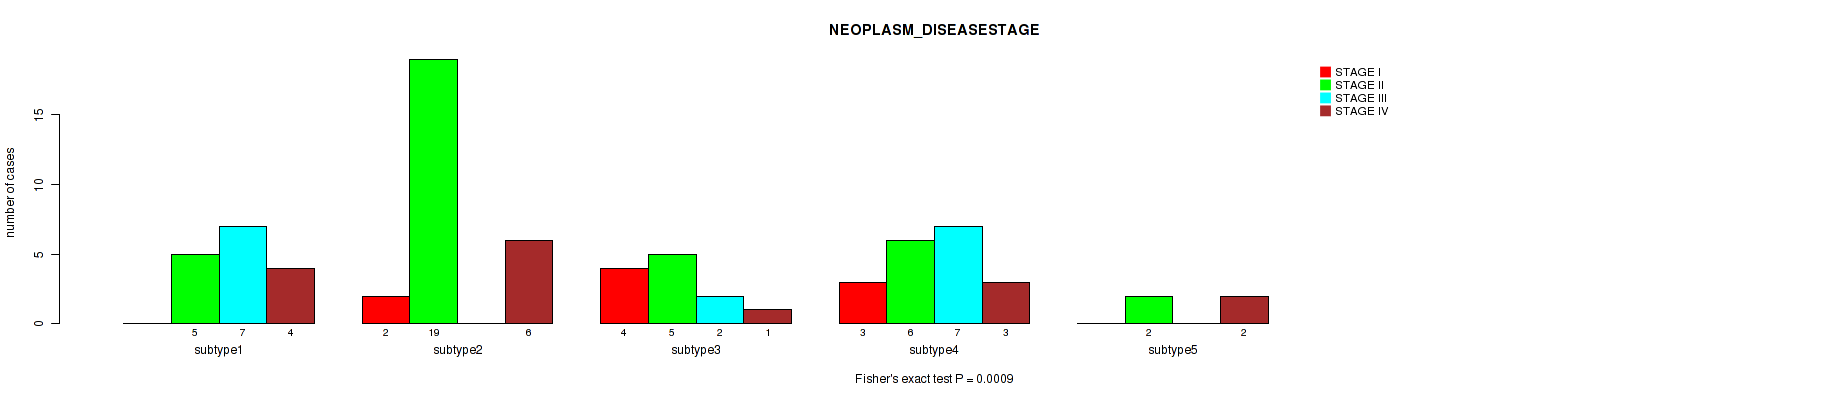
P value = 9e-04 (Fisher's exact test), Q value = 0.0081
Table S67. Clustering Approach #8: 'MIRSEQ CHIERARCHICAL' versus Clinical Feature #3: 'NEOPLASM_DISEASESTAGE'
| nPatients | STAGE I | STAGE II | STAGE III | STAGE IV |
|---|---|---|---|---|
| ALL | 9 | 37 | 16 | 16 |
| subtype1 | 0 | 5 | 7 | 4 |
| subtype2 | 2 | 19 | 0 | 6 |
| subtype3 | 4 | 5 | 2 | 1 |
| subtype4 | 3 | 6 | 7 | 3 |
| subtype5 | 0 | 2 | 0 | 2 |
Figure S59. Get High-res Image Clustering Approach #8: 'MIRSEQ CHIERARCHICAL' versus Clinical Feature #3: 'NEOPLASM_DISEASESTAGE'
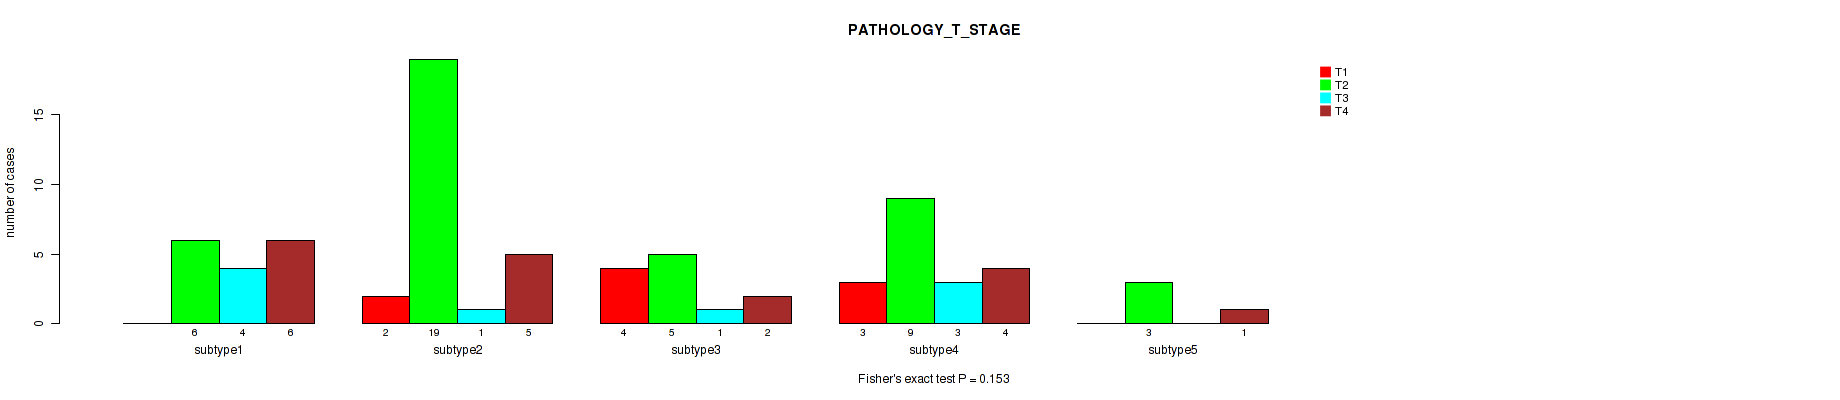
P value = 0.153 (Fisher's exact test), Q value = 0.32
Table S68. Clustering Approach #8: 'MIRSEQ CHIERARCHICAL' versus Clinical Feature #4: 'PATHOLOGY_T_STAGE'
| nPatients | T1 | T2 | T3 | T4 |
|---|---|---|---|---|
| ALL | 9 | 42 | 9 | 18 |
| subtype1 | 0 | 6 | 4 | 6 |
| subtype2 | 2 | 19 | 1 | 5 |
| subtype3 | 4 | 5 | 1 | 2 |
| subtype4 | 3 | 9 | 3 | 4 |
| subtype5 | 0 | 3 | 0 | 1 |
Figure S60. Get High-res Image Clustering Approach #8: 'MIRSEQ CHIERARCHICAL' versus Clinical Feature #4: 'PATHOLOGY_T_STAGE'
P value = 0.254 (Fisher's exact test), Q value = 0.42
Table S69. Clustering Approach #8: 'MIRSEQ CHIERARCHICAL' versus Clinical Feature #5: 'PATHOLOGY_N_STAGE'
| nPatients | 0 | 1 |
|---|---|---|
| ALL | 68 | 10 |
| subtype1 | 13 | 3 |
| subtype2 | 25 | 2 |
| subtype3 | 12 | 0 |
| subtype4 | 15 | 4 |
| subtype5 | 3 | 1 |
Figure S61. Get High-res Image Clustering Approach #8: 'MIRSEQ CHIERARCHICAL' versus Clinical Feature #5: 'PATHOLOGY_N_STAGE'
P value = 0.33 (Fisher's exact test), Q value = 0.5
Table S70. Clustering Approach #8: 'MIRSEQ CHIERARCHICAL' versus Clinical Feature #6: 'GENDER'
| nPatients | FEMALE | MALE |
|---|---|---|
| ALL | 49 | 31 |
| subtype1 | 7 | 10 |
| subtype2 | 16 | 11 |
| subtype3 | 9 | 3 |
| subtype4 | 14 | 6 |
| subtype5 | 3 | 1 |
Figure S62. Get High-res Image Clustering Approach #8: 'MIRSEQ CHIERARCHICAL' versus Clinical Feature #6: 'GENDER'
P value = 0.105 (Fisher's exact test), Q value = 0.25
Table S71. Clustering Approach #8: 'MIRSEQ CHIERARCHICAL' versus Clinical Feature #7: 'RACE'
| nPatients | ASIAN | BLACK OR AFRICAN AMERICAN | WHITE |
|---|---|---|---|
| ALL | 1 | 1 | 67 |
| subtype1 | 0 | 0 | 15 |
| subtype2 | 0 | 0 | 23 |
| subtype3 | 1 | 1 | 8 |
| subtype4 | 0 | 0 | 18 |
| subtype5 | 0 | 0 | 3 |
Figure S63. Get High-res Image Clustering Approach #8: 'MIRSEQ CHIERARCHICAL' versus Clinical Feature #7: 'RACE'
P value = 0.699 (Fisher's exact test), Q value = 0.85
Table S72. Clustering Approach #8: 'MIRSEQ CHIERARCHICAL' versus Clinical Feature #8: 'ETHNICITY'
| nPatients | HISPANIC OR LATINO | NOT HISPANIC OR LATINO |
|---|---|---|
| ALL | 8 | 30 |
| subtype1 | 3 | 4 |
| subtype2 | 2 | 8 |
| subtype3 | 1 | 6 |
| subtype4 | 2 | 9 |
| subtype5 | 0 | 3 |
Figure S64. Get High-res Image Clustering Approach #8: 'MIRSEQ CHIERARCHICAL' versus Clinical Feature #8: 'ETHNICITY'
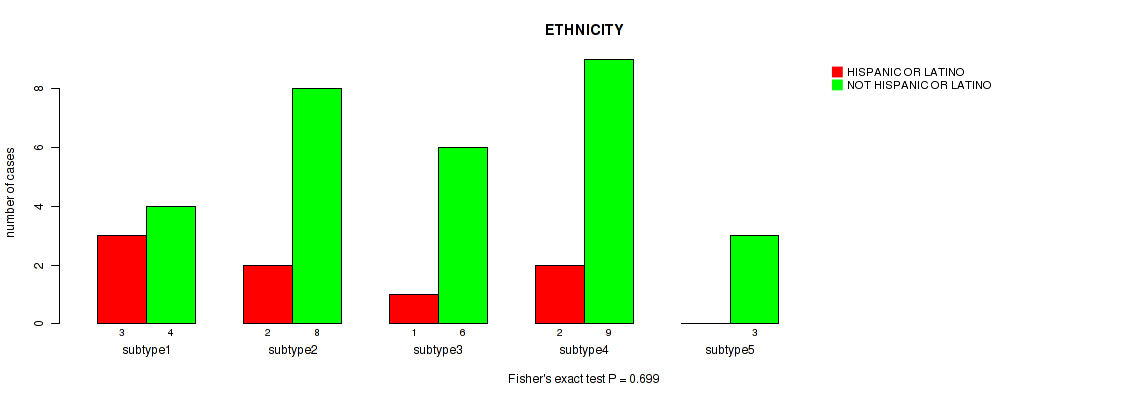
Table S73. Description of clustering approach #9: 'MIRseq Mature CNMF subtypes'
| Cluster Labels | 1 | 2 | 3 |
|---|---|---|---|
| Number of samples | 29 | 22 | 27 |
P value = 0.000208 (logrank test), Q value = 0.0065
Table S74. Clustering Approach #9: 'MIRseq Mature CNMF subtypes' versus Clinical Feature #1: 'Time to Death'
| nPatients | nDeath | Duration Range (Median), Month | |
|---|---|---|---|
| ALL | 78 | 28 | 4.1 - 153.6 (36.1) |
| subtype1 | 29 | 10 | 4.1 - 152.2 (36.0) |
| subtype2 | 22 | 14 | 5.2 - 153.6 (23.2) |
| subtype3 | 27 | 4 | 18.1 - 121.2 (46.8) |
Figure S65. Get High-res Image Clustering Approach #9: 'MIRseq Mature CNMF subtypes' versus Clinical Feature #1: 'Time to Death'
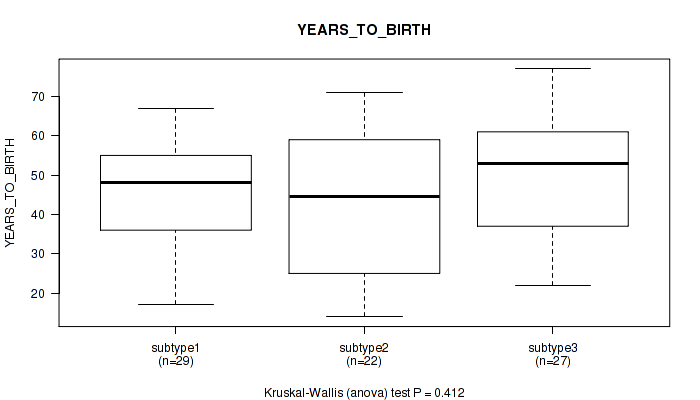
P value = 0.412 (Kruskal-Wallis (anova)), Q value = 0.57
Table S75. Clustering Approach #9: 'MIRseq Mature CNMF subtypes' versus Clinical Feature #2: 'YEARS_TO_BIRTH'
| nPatients | Mean (Std.Dev) | |
|---|---|---|
| ALL | 78 | 46.8 (15.9) |
| subtype1 | 29 | 45.4 (14.5) |
| subtype2 | 22 | 44.2 (18.1) |
| subtype3 | 27 | 50.3 (15.3) |
Figure S66. Get High-res Image Clustering Approach #9: 'MIRseq Mature CNMF subtypes' versus Clinical Feature #2: 'YEARS_TO_BIRTH'
P value = 0.00057 (Fisher's exact test), Q value = 0.0065
Table S76. Clustering Approach #9: 'MIRseq Mature CNMF subtypes' versus Clinical Feature #3: 'NEOPLASM_DISEASESTAGE'
| nPatients | STAGE I | STAGE II | STAGE III | STAGE IV |
|---|---|---|---|---|
| ALL | 9 | 35 | 16 | 16 |
| subtype1 | 4 | 10 | 8 | 7 |
| subtype2 | 0 | 7 | 5 | 9 |
| subtype3 | 5 | 18 | 3 | 0 |
Figure S67. Get High-res Image Clustering Approach #9: 'MIRseq Mature CNMF subtypes' versus Clinical Feature #3: 'NEOPLASM_DISEASESTAGE'
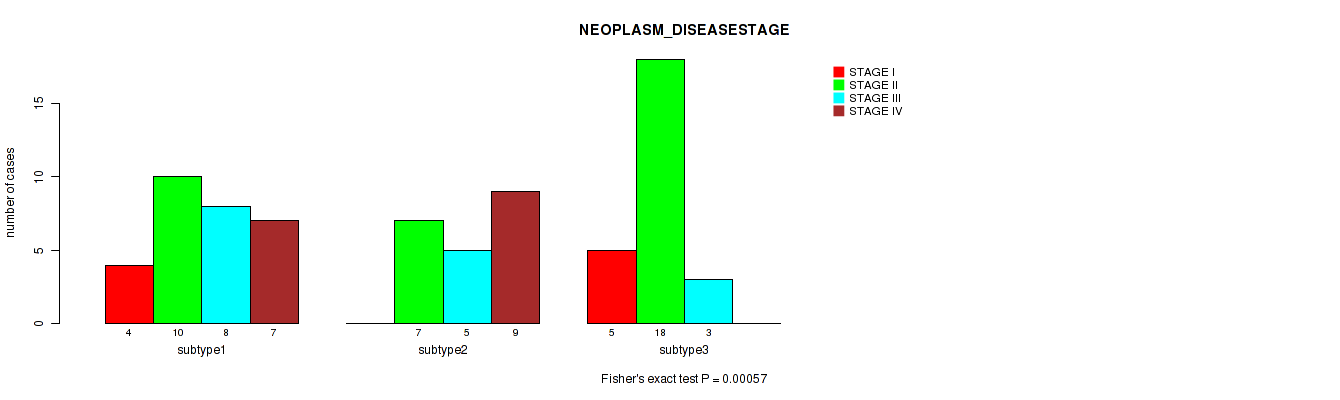
P value = 0.00091 (Fisher's exact test), Q value = 0.0081
Table S77. Clustering Approach #9: 'MIRseq Mature CNMF subtypes' versus Clinical Feature #4: 'PATHOLOGY_T_STAGE'
| nPatients | T1 | T2 | T3 | T4 |
|---|---|---|---|---|
| ALL | 9 | 40 | 9 | 18 |
| subtype1 | 4 | 14 | 2 | 9 |
| subtype2 | 0 | 8 | 4 | 9 |
| subtype3 | 5 | 18 | 3 | 0 |
Figure S68. Get High-res Image Clustering Approach #9: 'MIRseq Mature CNMF subtypes' versus Clinical Feature #4: 'PATHOLOGY_T_STAGE'
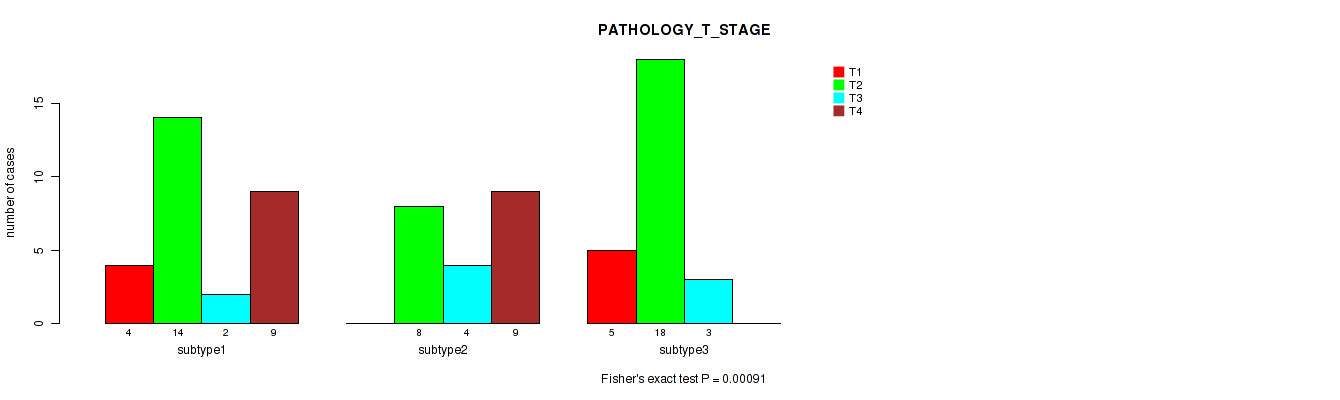
P value = 0.0276 (Fisher's exact test), Q value = 0.11
Table S78. Clustering Approach #9: 'MIRseq Mature CNMF subtypes' versus Clinical Feature #5: 'PATHOLOGY_N_STAGE'
| nPatients | 0 | 1 |
|---|---|---|
| ALL | 66 | 10 |
| subtype1 | 23 | 6 |
| subtype2 | 17 | 4 |
| subtype3 | 26 | 0 |
Figure S69. Get High-res Image Clustering Approach #9: 'MIRseq Mature CNMF subtypes' versus Clinical Feature #5: 'PATHOLOGY_N_STAGE'
P value = 0.0611 (Fisher's exact test), Q value = 0.18
Table S79. Clustering Approach #9: 'MIRseq Mature CNMF subtypes' versus Clinical Feature #6: 'GENDER'
| nPatients | FEMALE | MALE |
|---|---|---|
| ALL | 49 | 29 |
| subtype1 | 21 | 8 |
| subtype2 | 16 | 6 |
| subtype3 | 12 | 15 |
Figure S70. Get High-res Image Clustering Approach #9: 'MIRseq Mature CNMF subtypes' versus Clinical Feature #6: 'GENDER'
P value = 1 (Fisher's exact test), Q value = 1
Table S80. Clustering Approach #9: 'MIRseq Mature CNMF subtypes' versus Clinical Feature #7: 'RACE'
| nPatients | ASIAN | BLACK OR AFRICAN AMERICAN | WHITE |
|---|---|---|---|
| ALL | 1 | 1 | 66 |
| subtype1 | 1 | 1 | 25 |
| subtype2 | 0 | 0 | 21 |
| subtype3 | 0 | 0 | 20 |
Figure S71. Get High-res Image Clustering Approach #9: 'MIRseq Mature CNMF subtypes' versus Clinical Feature #7: 'RACE'
P value = 0.866 (Fisher's exact test), Q value = 0.96
Table S81. Clustering Approach #9: 'MIRseq Mature CNMF subtypes' versus Clinical Feature #8: 'ETHNICITY'
| nPatients | HISPANIC OR LATINO | NOT HISPANIC OR LATINO |
|---|---|---|
| ALL | 8 | 29 |
| subtype1 | 3 | 14 |
| subtype2 | 4 | 10 |
| subtype3 | 1 | 5 |
Figure S72. Get High-res Image Clustering Approach #9: 'MIRseq Mature CNMF subtypes' versus Clinical Feature #8: 'ETHNICITY'
Table S82. Description of clustering approach #10: 'MIRseq Mature cHierClus subtypes'
| Cluster Labels | 1 | 2 | 3 |
|---|---|---|---|
| Number of samples | 40 | 24 | 14 |
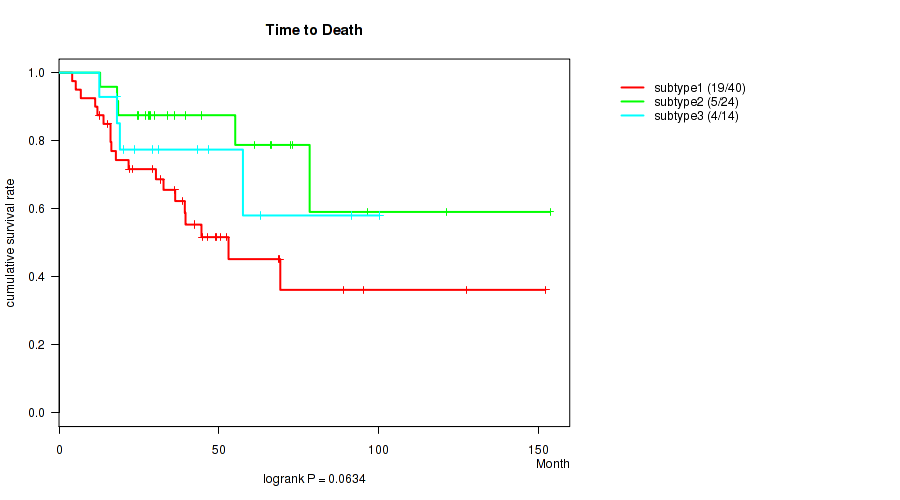
P value = 0.0634 (logrank test), Q value = 0.18
Table S83. Clustering Approach #10: 'MIRseq Mature cHierClus subtypes' versus Clinical Feature #1: 'Time to Death'
| nPatients | nDeath | Duration Range (Median), Month | |
|---|---|---|---|
| ALL | 78 | 28 | 4.1 - 153.6 (36.1) |
| subtype1 | 40 | 19 | 4.1 - 152.2 (36.2) |
| subtype2 | 24 | 5 | 12.8 - 153.6 (37.9) |
| subtype3 | 14 | 4 | 12.6 - 100.2 (30.2) |
Figure S73. Get High-res Image Clustering Approach #10: 'MIRseq Mature cHierClus subtypes' versus Clinical Feature #1: 'Time to Death'
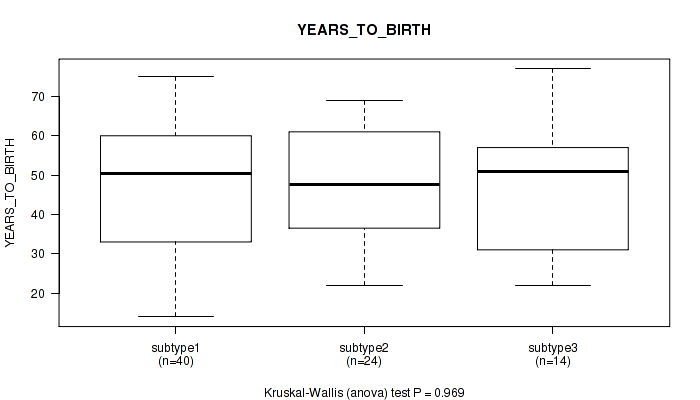
P value = 0.969 (Kruskal-Wallis (anova)), Q value = 1
Table S84. Clustering Approach #10: 'MIRseq Mature cHierClus subtypes' versus Clinical Feature #2: 'YEARS_TO_BIRTH'
| nPatients | Mean (Std.Dev) | |
|---|---|---|
| ALL | 78 | 46.8 (15.9) |
| subtype1 | 40 | 46.5 (16.4) |
| subtype2 | 24 | 47.2 (15.4) |
| subtype3 | 14 | 46.6 (16.1) |
Figure S74. Get High-res Image Clustering Approach #10: 'MIRseq Mature cHierClus subtypes' versus Clinical Feature #2: 'YEARS_TO_BIRTH'
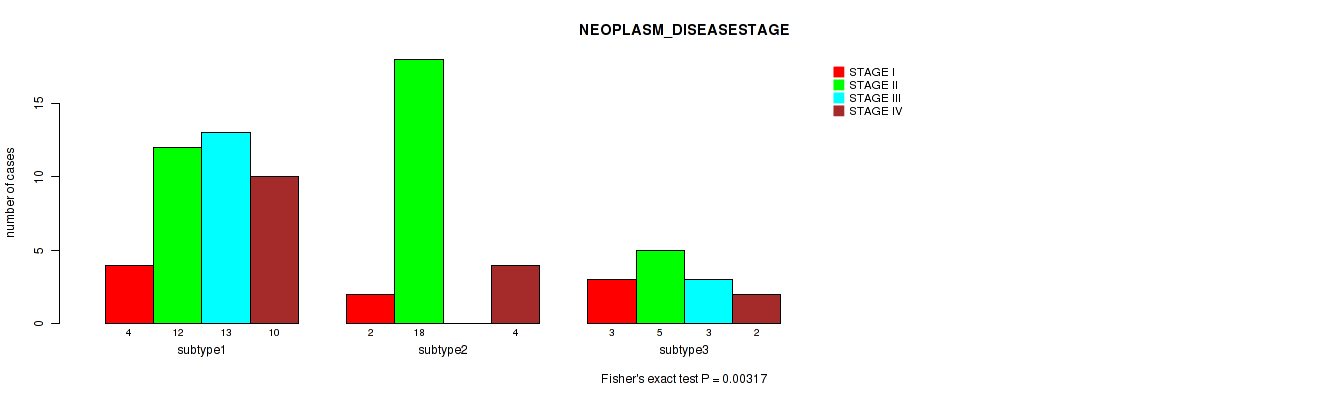
P value = 0.00317 (Fisher's exact test), Q value = 0.025
Table S85. Clustering Approach #10: 'MIRseq Mature cHierClus subtypes' versus Clinical Feature #3: 'NEOPLASM_DISEASESTAGE'
| nPatients | STAGE I | STAGE II | STAGE III | STAGE IV |
|---|---|---|---|---|
| ALL | 9 | 35 | 16 | 16 |
| subtype1 | 4 | 12 | 13 | 10 |
| subtype2 | 2 | 18 | 0 | 4 |
| subtype3 | 3 | 5 | 3 | 2 |
Figure S75. Get High-res Image Clustering Approach #10: 'MIRseq Mature cHierClus subtypes' versus Clinical Feature #3: 'NEOPLASM_DISEASESTAGE'
P value = 0.0907 (Fisher's exact test), Q value = 0.23
Table S86. Clustering Approach #10: 'MIRseq Mature cHierClus subtypes' versus Clinical Feature #4: 'PATHOLOGY_T_STAGE'
| nPatients | T1 | T2 | T3 | T4 |
|---|---|---|---|---|
| ALL | 9 | 40 | 9 | 18 |
| subtype1 | 4 | 17 | 5 | 13 |
| subtype2 | 2 | 18 | 1 | 3 |
| subtype3 | 3 | 5 | 3 | 2 |
Figure S76. Get High-res Image Clustering Approach #10: 'MIRseq Mature cHierClus subtypes' versus Clinical Feature #4: 'PATHOLOGY_T_STAGE'
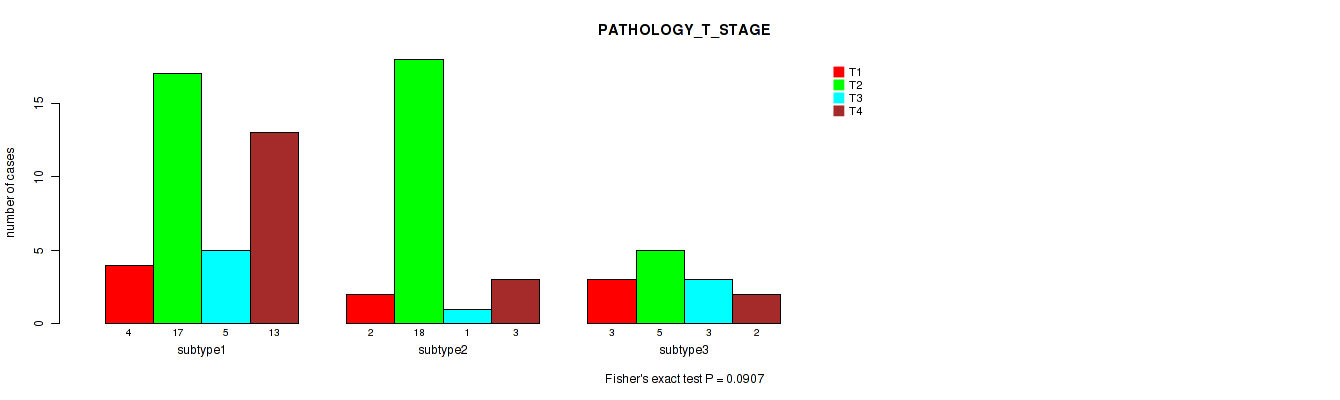
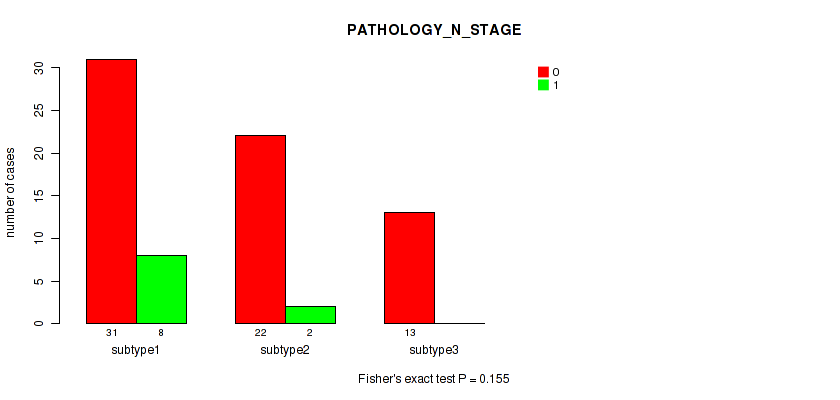
P value = 0.155 (Fisher's exact test), Q value = 0.32
Table S87. Clustering Approach #10: 'MIRseq Mature cHierClus subtypes' versus Clinical Feature #5: 'PATHOLOGY_N_STAGE'
| nPatients | 0 | 1 |
|---|---|---|
| ALL | 66 | 10 |
| subtype1 | 31 | 8 |
| subtype2 | 22 | 2 |
| subtype3 | 13 | 0 |
Figure S77. Get High-res Image Clustering Approach #10: 'MIRseq Mature cHierClus subtypes' versus Clinical Feature #5: 'PATHOLOGY_N_STAGE'
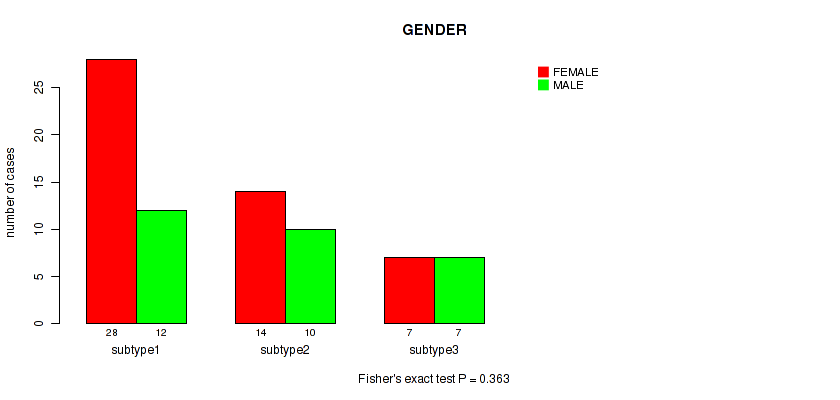
P value = 0.363 (Fisher's exact test), Q value = 0.53
Table S88. Clustering Approach #10: 'MIRseq Mature cHierClus subtypes' versus Clinical Feature #6: 'GENDER'
| nPatients | FEMALE | MALE |
|---|---|---|
| ALL | 49 | 29 |
| subtype1 | 28 | 12 |
| subtype2 | 14 | 10 |
| subtype3 | 7 | 7 |
Figure S78. Get High-res Image Clustering Approach #10: 'MIRseq Mature cHierClus subtypes' versus Clinical Feature #6: 'GENDER'
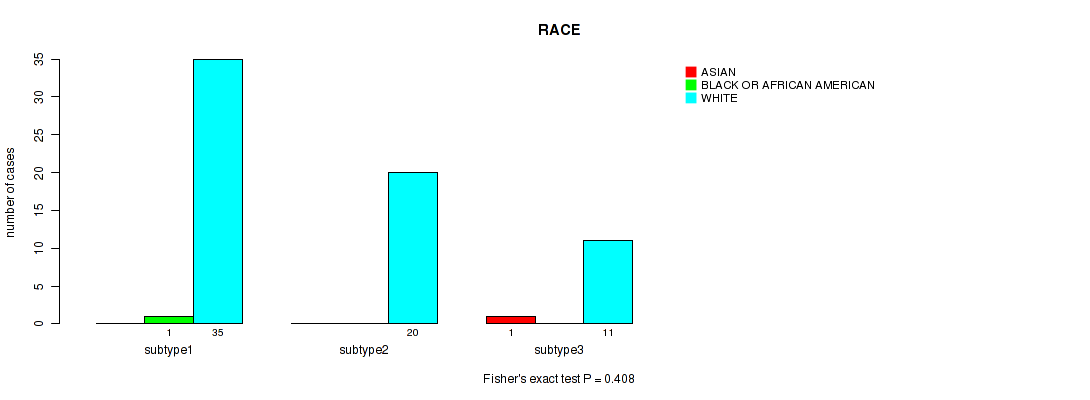
P value = 0.408 (Fisher's exact test), Q value = 0.57
Table S89. Clustering Approach #10: 'MIRseq Mature cHierClus subtypes' versus Clinical Feature #7: 'RACE'
| nPatients | ASIAN | BLACK OR AFRICAN AMERICAN | WHITE |
|---|---|---|---|
| ALL | 1 | 1 | 66 |
| subtype1 | 0 | 1 | 35 |
| subtype2 | 0 | 0 | 20 |
| subtype3 | 1 | 0 | 11 |
Figure S79. Get High-res Image Clustering Approach #10: 'MIRseq Mature cHierClus subtypes' versus Clinical Feature #7: 'RACE'
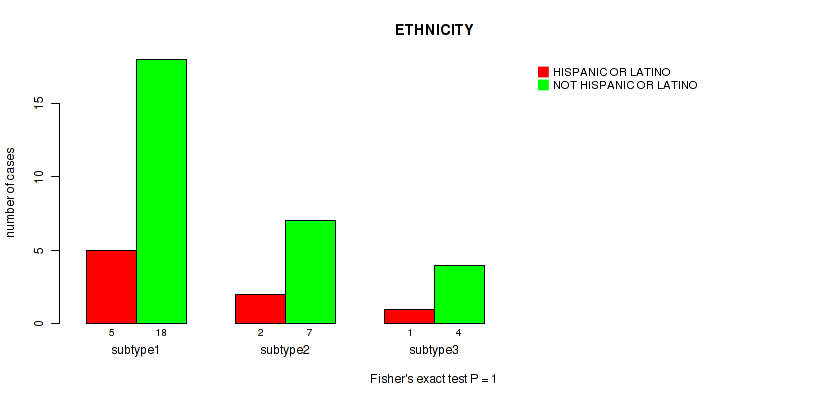
P value = 1 (Fisher's exact test), Q value = 1
Table S90. Clustering Approach #10: 'MIRseq Mature cHierClus subtypes' versus Clinical Feature #8: 'ETHNICITY'
| nPatients | HISPANIC OR LATINO | NOT HISPANIC OR LATINO |
|---|---|---|
| ALL | 8 | 29 |
| subtype1 | 5 | 18 |
| subtype2 | 2 | 7 |
| subtype3 | 1 | 4 |
Figure S80. Get High-res Image Clustering Approach #10: 'MIRseq Mature cHierClus subtypes' versus Clinical Feature #8: 'ETHNICITY'
-
Cluster data file = /xchip/cga/gdac-prod/tcga-gdac/jobResults/GDAC_mergedClustering/ACC-TP/15087341/ACC-TP.mergedcluster.txt
-
Clinical data file = /xchip/cga/gdac-prod/tcga-gdac/jobResults/Append_Data/ACC-TP/15074660/ACC-TP.merged_data.txt
-
Number of patients = 92
-
Number of clustering approaches = 10
-
Number of selected clinical features = 8
-
Exclude small clusters that include fewer than K patients, K = 3
consensus non-negative matrix factorization clustering approach (Brunet et al. 2004)
Resampling-based clustering method (Monti et al. 2003)
For survival clinical features, the Kaplan-Meier survival curves of tumors with and without gene mutations were plotted and the statistical significance P values were estimated by logrank test (Bland and Altman 2004) using the 'survdiff' function in R
For binary clinical features, two-tailed Fisher's exact tests (Fisher 1922) were used to estimate the P values using the 'fisher.test' function in R
For multiple hypothesis correction, Q value is the False Discovery Rate (FDR) analogue of the P value (Benjamini and Hochberg 1995), defined as the minimum FDR at which the test may be called significant. We used the 'Benjamini and Hochberg' method of 'p.adjust' function in R to convert P values into Q values.
In addition to the links below, the full results of the analysis summarized in this report can also be downloaded programmatically using firehose_get, or interactively from either the Broad GDAC website or TCGA Data Coordination Center Portal.