This pipeline computes the correlation between APOBRC groups and selected clinical features.
Testing the association between APOBEC groups identified by 2 different apobec score and 12 clinical features across 967 patients, 7 significant findings detected with Q value < 0.25.
-
3 subtypes identified in current cancer cohort by 'APOBEC MUTLOAD MINESTIMATE'. These subtypes correlate to 'YEARS_TO_BIRTH', 'HISTOLOGICAL_TYPE', 'RADIATIONS_RADIATION_REGIMENINDICATION', and 'RACE'.
-
3 subtypes identified in current cancer cohort by 'APOBEC ENRICH'. These subtypes correlate to 'HISTOLOGICAL_TYPE', 'RADIATIONS_RADIATION_REGIMENINDICATION', and 'RACE'.
Table 1. Get Full Table Overview of the association between APOBEC groups by 2 different APOBEC scores and 12 clinical features. Shown in the table are P values (Q values). Thresholded by Q value < 0.25, 7 significant findings detected.
|
Clinical Features |
Statistical Tests |
APOBEC MUTLOAD MINESTIMATE |
APOBEC ENRICH |
| Time to Death | logrank test |
0.184 (0.481) |
0.618 (0.872) |
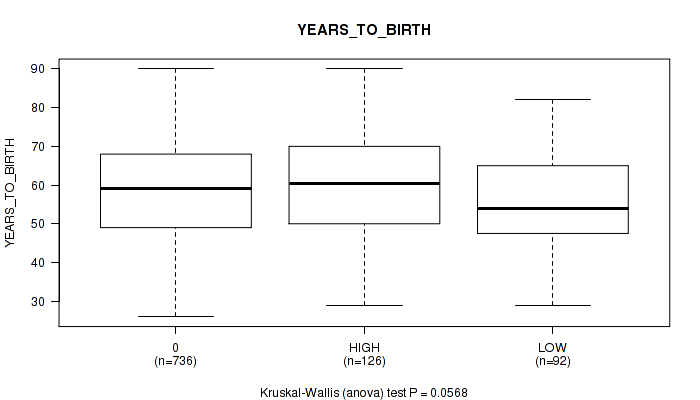
| YEARS TO BIRTH | Kruskal-Wallis (anova) |
0.0568 (0.195) |
0.875 (0.913) |
| NEOPLASM DISEASESTAGE | Fisher's exact test |
0.727 (0.913) |
0.802 (0.913) |
| PATHOLOGY T STAGE | Fisher's exact test |
0.358 (0.573) |
0.341 (0.573) |
| PATHOLOGY N STAGE | Fisher's exact test |
0.284 (0.525) |
0.81 (0.913) |
| PATHOLOGY M STAGE | Fisher's exact test |
0.579 (0.869) |
0.662 (0.882) |
| GENDER | Fisher's exact test |
0.237 (0.481) |
1 (1.00) |
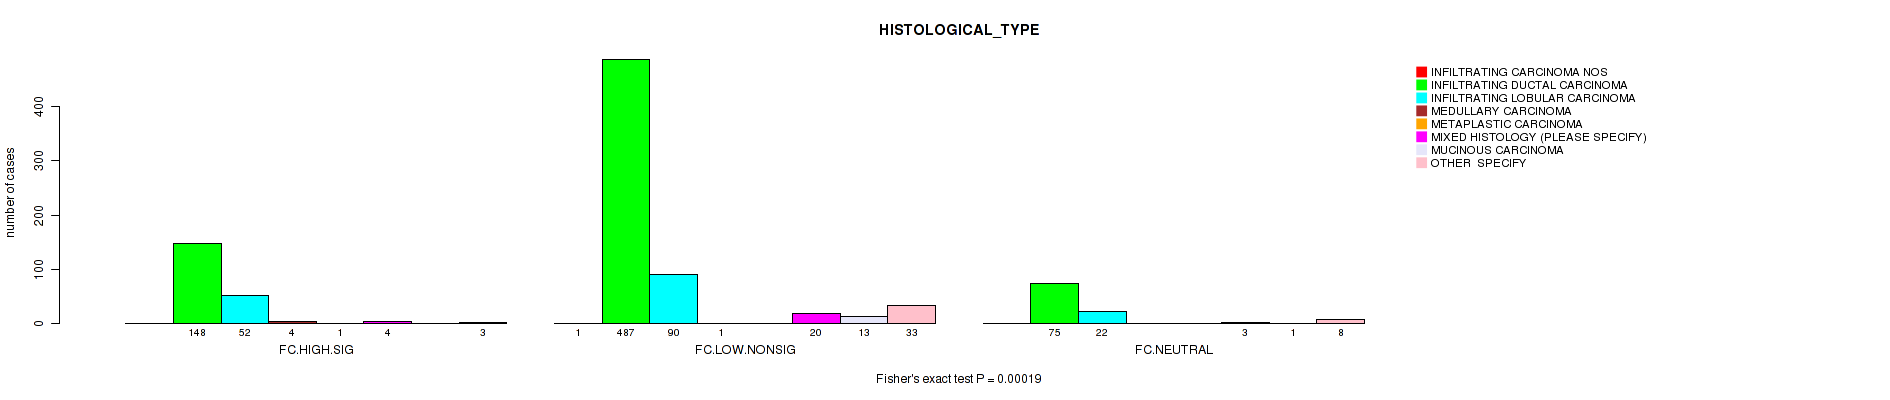
| HISTOLOGICAL TYPE | Fisher's exact test |
6e-05 (0.00144) |
0.00019 (0.00228) |
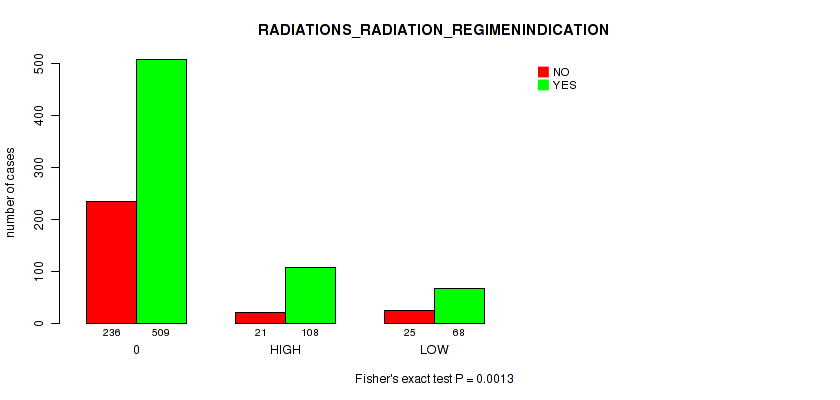
| RADIATIONS RADIATION REGIMENINDICATION | Fisher's exact test |
0.0013 (0.00749) |
0.00156 (0.00749) |
| NUMBER OF LYMPH NODES | Kruskal-Wallis (anova) |
0.174 (0.481) |
0.241 (0.481) |
| RACE | Fisher's exact test |
0.00407 (0.0163) |
0.00034 (0.00272) |
| ETHNICITY | Fisher's exact test |
0.862 (0.913) |
0.208 (0.481) |
Table S1. Description of APOBEC group #1: 'APOBEC MUTLOAD MINESTIMATE'
| Cluster Labels | 0 | HIGH | LOW |
|---|---|---|---|
| Number of samples | 745 | 129 | 93 |
P value = 0.0568 (Kruskal-Wallis (anova)), Q value = 0.19
Table S2. Clustering Approach #1: 'APOBEC MUTLOAD MINESTIMATE' versus Clinical Feature #2: 'YEARS_TO_BIRTH'
| nPatients | Mean (Std.Dev) | |
|---|---|---|
| ALL | 954 | 58.7 (13.1) |
| 0 | 736 | 58.7 (13.1) |
| HIGH | 126 | 60.6 (13.8) |
| LOW | 92 | 56.0 (12.0) |
Figure S1. Get High-res Image Clustering Approach #1: 'APOBEC MUTLOAD MINESTIMATE' versus Clinical Feature #2: 'YEARS_TO_BIRTH'
P value = 6e-05 (Fisher's exact test), Q value = 0.0014
Table S3. Clustering Approach #1: 'APOBEC MUTLOAD MINESTIMATE' versus Clinical Feature #8: 'HISTOLOGICAL_TYPE'
| nPatients | INFILTRATING CARCINOMA NOS | INFILTRATING DUCTAL CARCINOMA | INFILTRATING LOBULAR CARCINOMA | MEDULLARY CARCINOMA | METAPLASTIC CARCINOMA | MIXED HISTOLOGY (PLEASE SPECIFY) | MUCINOUS CARCINOMA | OTHER SPECIFY |
|---|---|---|---|---|---|---|---|---|
| ALL | 1 | 710 | 164 | 5 | 1 | 27 | 14 | 44 |
| 0 | 1 | 555 | 111 | 1 | 0 | 23 | 14 | 40 |
| HIGH | 0 | 86 | 39 | 2 | 0 | 1 | 0 | 1 |
| LOW | 0 | 69 | 14 | 2 | 1 | 3 | 0 | 3 |
Figure S2. Get High-res Image Clustering Approach #1: 'APOBEC MUTLOAD MINESTIMATE' versus Clinical Feature #8: 'HISTOLOGICAL_TYPE'

P value = 0.0013 (Fisher's exact test), Q value = 0.0075
Table S4. Clustering Approach #1: 'APOBEC MUTLOAD MINESTIMATE' versus Clinical Feature #9: 'RADIATIONS_RADIATION_REGIMENINDICATION'
| nPatients | NO | YES |
|---|---|---|
| ALL | 282 | 685 |
| 0 | 236 | 509 |
| HIGH | 21 | 108 |
| LOW | 25 | 68 |
Figure S3. Get High-res Image Clustering Approach #1: 'APOBEC MUTLOAD MINESTIMATE' versus Clinical Feature #9: 'RADIATIONS_RADIATION_REGIMENINDICATION'
P value = 0.00407 (Fisher's exact test), Q value = 0.016
Table S5. Clustering Approach #1: 'APOBEC MUTLOAD MINESTIMATE' versus Clinical Feature #11: 'RACE'
| nPatients | AMERICAN INDIAN OR ALASKA NATIVE | ASIAN | BLACK OR AFRICAN AMERICAN | WHITE |
|---|---|---|---|---|
| ALL | 1 | 57 | 116 | 698 |
| 0 | 1 | 34 | 82 | 556 |
| HIGH | 0 | 16 | 18 | 82 |
| LOW | 0 | 7 | 16 | 60 |
Figure S4. Get High-res Image Clustering Approach #1: 'APOBEC MUTLOAD MINESTIMATE' versus Clinical Feature #11: 'RACE'
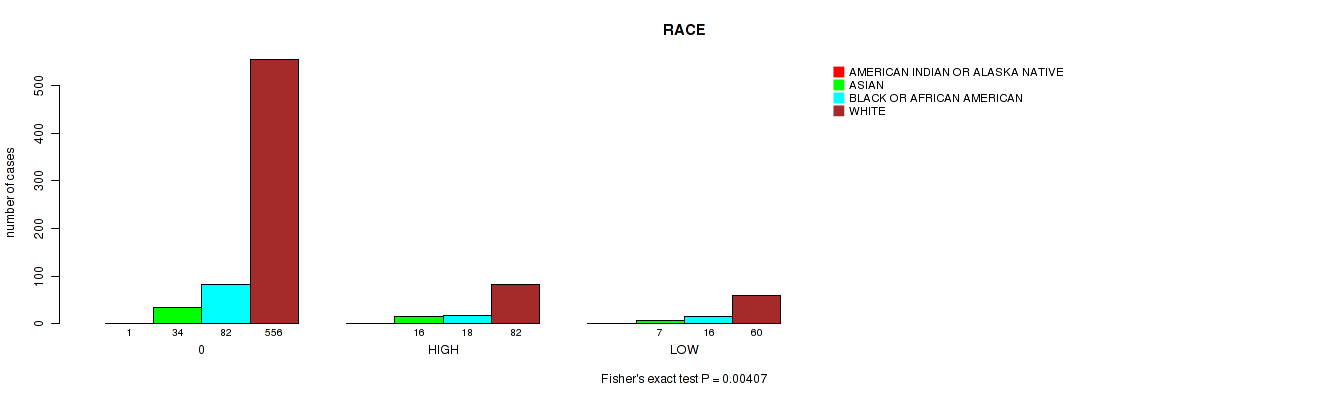
Table S6. Description of APOBEC group #2: 'APOBEC ENRICH'
| Cluster Labels | FC.HIGH.SIG | FC.LOW.NONSIG | FC.NEUTRAL |
|---|---|---|---|
| Number of samples | 213 | 645 | 109 |
P value = 0.00019 (Fisher's exact test), Q value = 0.0023
Table S7. Clustering Approach #2: 'APOBEC ENRICH' versus Clinical Feature #8: 'HISTOLOGICAL_TYPE'
| nPatients | INFILTRATING CARCINOMA NOS | INFILTRATING DUCTAL CARCINOMA | INFILTRATING LOBULAR CARCINOMA | MEDULLARY CARCINOMA | METAPLASTIC CARCINOMA | MIXED HISTOLOGY (PLEASE SPECIFY) | MUCINOUS CARCINOMA | OTHER SPECIFY |
|---|---|---|---|---|---|---|---|---|
| ALL | 1 | 710 | 164 | 5 | 1 | 27 | 14 | 44 |
| FC.HIGH.SIG | 0 | 148 | 52 | 4 | 1 | 4 | 0 | 3 |
| FC.LOW.NONSIG | 1 | 487 | 90 | 1 | 0 | 20 | 13 | 33 |
| FC.NEUTRAL | 0 | 75 | 22 | 0 | 0 | 3 | 1 | 8 |
Figure S5. Get High-res Image Clustering Approach #2: 'APOBEC ENRICH' versus Clinical Feature #8: 'HISTOLOGICAL_TYPE'
P value = 0.00156 (Fisher's exact test), Q value = 0.0075
Table S8. Clustering Approach #2: 'APOBEC ENRICH' versus Clinical Feature #9: 'RADIATIONS_RADIATION_REGIMENINDICATION'
| nPatients | NO | YES |
|---|---|---|
| ALL | 282 | 685 |
| FC.HIGH.SIG | 42 | 171 |
| FC.LOW.NONSIG | 208 | 437 |
| FC.NEUTRAL | 32 | 77 |
Figure S6. Get High-res Image Clustering Approach #2: 'APOBEC ENRICH' versus Clinical Feature #9: 'RADIATIONS_RADIATION_REGIMENINDICATION'

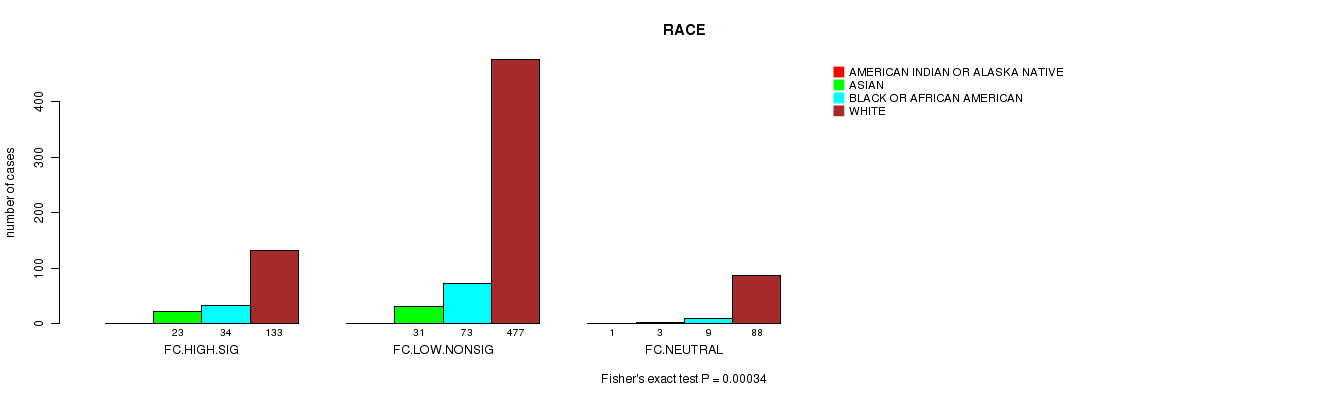
P value = 0.00034 (Fisher's exact test), Q value = 0.0027
Table S9. Clustering Approach #2: 'APOBEC ENRICH' versus Clinical Feature #11: 'RACE'
| nPatients | AMERICAN INDIAN OR ALASKA NATIVE | ASIAN | BLACK OR AFRICAN AMERICAN | WHITE |
|---|---|---|---|---|
| ALL | 1 | 57 | 116 | 698 |
| FC.HIGH.SIG | 0 | 23 | 34 | 133 |
| FC.LOW.NONSIG | 0 | 31 | 73 | 477 |
| FC.NEUTRAL | 1 | 3 | 9 | 88 |
Figure S7. Get High-res Image Clustering Approach #2: 'APOBEC ENRICH' versus Clinical Feature #11: 'RACE'
-
APOBEC groups file = /xchip/cga/gdac-prod/tcga-gdac/jobResults/APOBEC_Pipelines/BRCA-TP/15165570/APOBEC_clinical_corr_input_15169895/APOBEC_for_clinical.correlaion.input.categorical.txt
-
Clinical data file = /xchip/cga/gdac-prod/tcga-gdac/jobResults/Append_Data/BRCA-TP/15076769/BRCA-TP.merged_data.txt
-
Number of patients = 967
-
Number of selected clinical features = 12
APOBEC classification based on APOBEC_MutLoad_MinEstimate : a. APOBEC non group -- samples with zero value, b. APOBEC hig group -- samples above median value in non zero samples, c. APOBEC hig group -- samples below median value in non zero samples.
APOBEC classification based on APOBEC_enrich : a. No Enrichmment group -- all samples with BH_Fisher_p-value_tCw >=0.05, b. Small enrichment group -- samples with BH_Fisher_p-value_tCw = < 0.05 and APOBEC_enrich=<2, c. High enrichment gruop -- samples with BH_Fisher_p-value_tCw =< 0.05 and APOBEC_enrich>2.
For survival clinical features, the Kaplan-Meier survival curves of tumors with and without gene mutations were plotted and the statistical significance P values were estimated by logrank test (Bland and Altman 2004) using the 'survdiff' function in R
For binary clinical features, two-tailed Fisher's exact tests (Fisher 1922) were used to estimate the P values using the 'fisher.test' function in R
For multiple hypothesis correction, Q value is the False Discovery Rate (FDR) analogue of the P value (Benjamini and Hochberg 1995), defined as the minimum FDR at which the test may be called significant. We used the 'Benjamini and Hochberg' method of 'p.adjust' function in R to convert P values into Q values.
In addition to the links below, the full results of the analysis summarized in this report can also be downloaded programmatically using firehose_get, or interactively from either the Broad GDAC website or TCGA Data Coordination Center Portal.