This pipeline computes the correlation between significant arm-level copy number variations (cnvs) and selected clinical features.
Testing the association between copy number variation 82 arm-level events and 8 clinical features across 570 patients, 14 significant findings detected with Q value < 0.25.
-
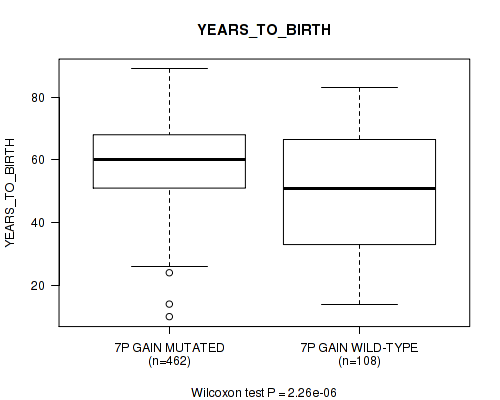
7p gain cnv correlated to 'Time to Death' and 'YEARS_TO_BIRTH'.
-
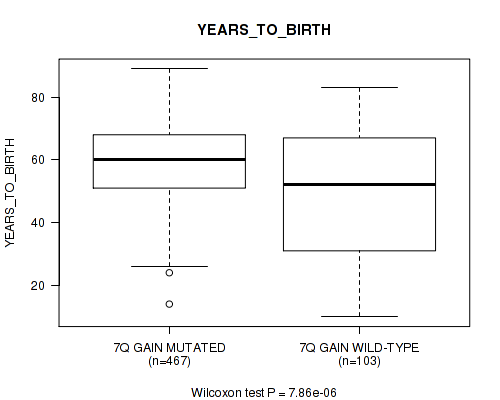
7q gain cnv correlated to 'Time to Death' and 'YEARS_TO_BIRTH'.
-
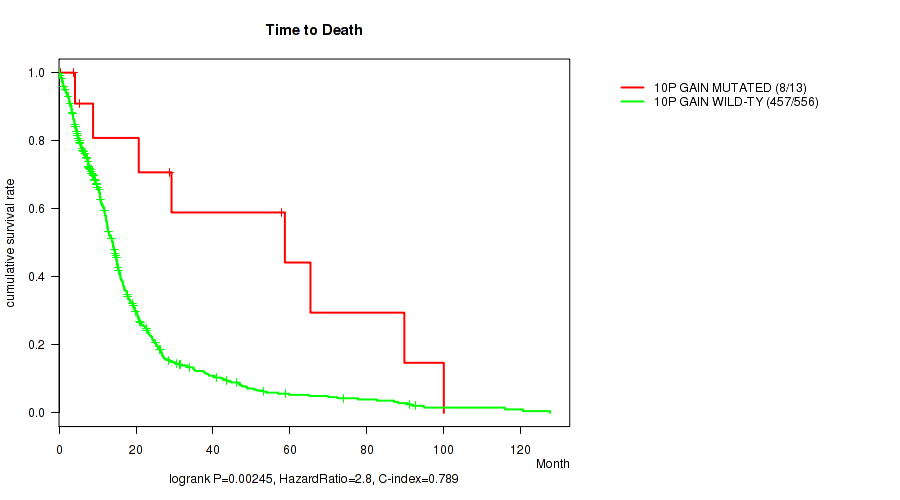
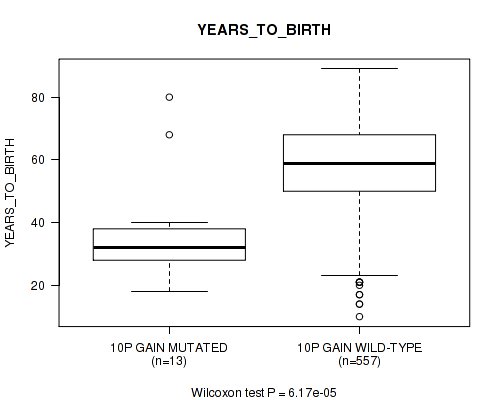
10p gain cnv correlated to 'Time to Death' and 'YEARS_TO_BIRTH'.
-
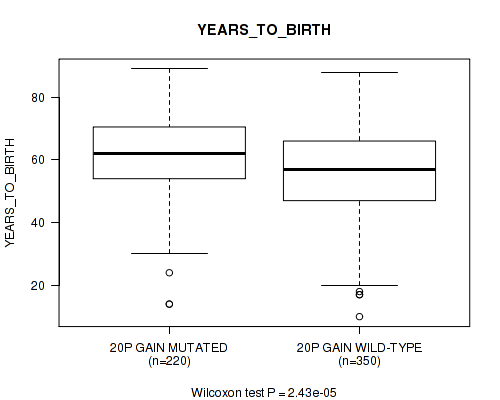
20p gain cnv correlated to 'YEARS_TO_BIRTH'.
-
20q gain cnv correlated to 'YEARS_TO_BIRTH'.
-
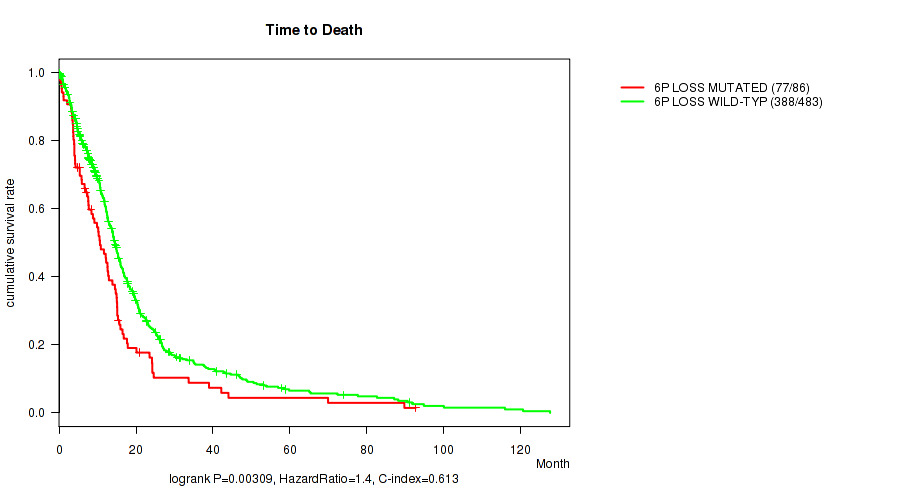
6p loss cnv correlated to 'Time to Death'.
-
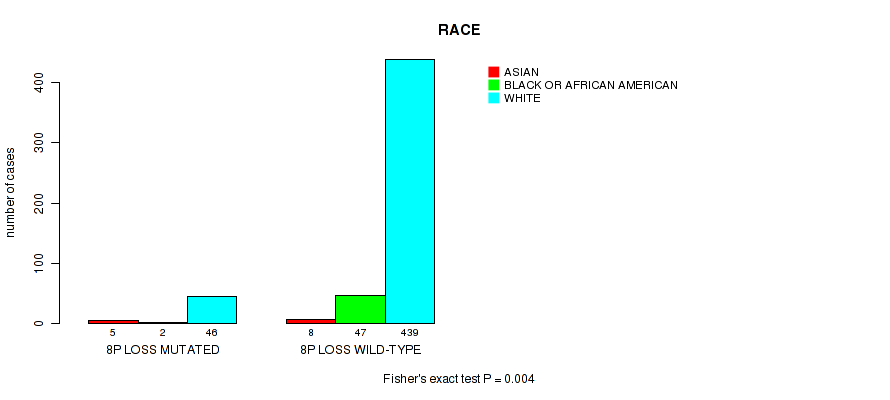
8p loss cnv correlated to 'RACE'.
-
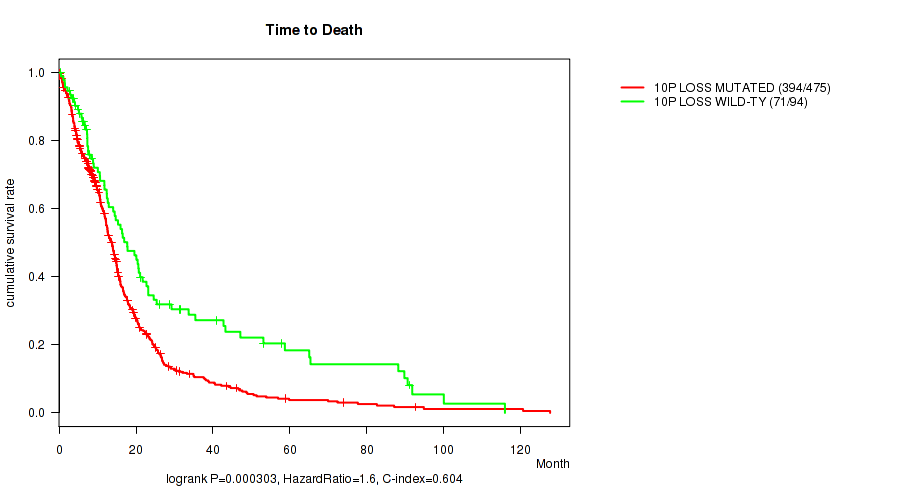
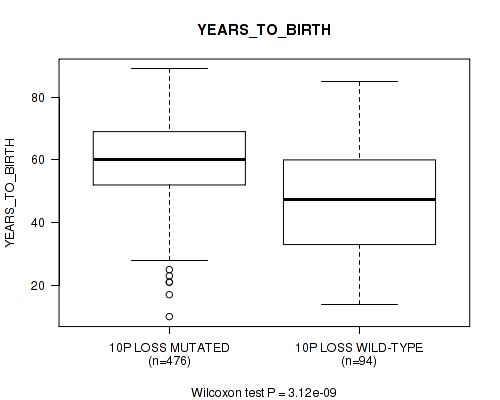
10p loss cnv correlated to 'Time to Death' and 'YEARS_TO_BIRTH'.
-
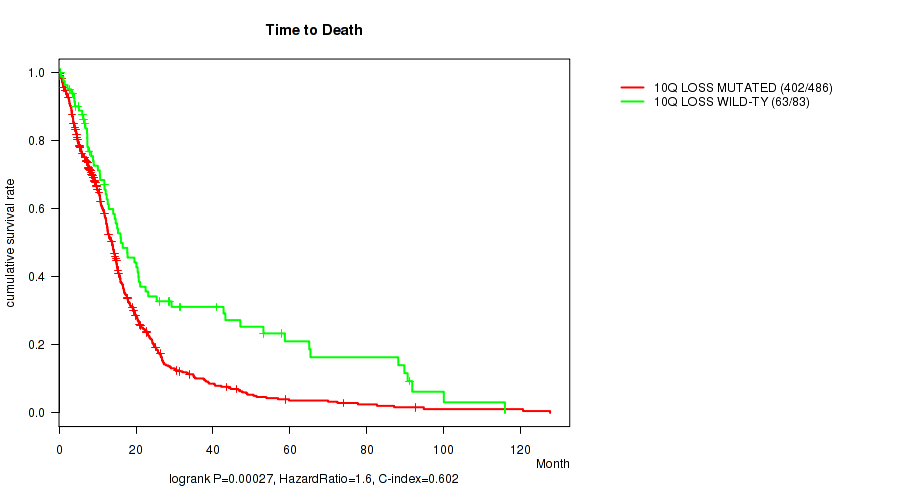
10q loss cnv correlated to 'Time to Death' and 'YEARS_TO_BIRTH'.
Table 1. Get Full Table Overview of the association between significant copy number variation of 82 arm-level events and 8 clinical features. Shown in the table are P values (Q values). Thresholded by Q value < 0.25, 14 significant findings detected.
|
Clinical Features |
Time to Death |
YEARS TO BIRTH |
GENDER |
KARNOFSKY PERFORMANCE SCORE |
HISTOLOGICAL TYPE |
RADIATIONS RADIATION REGIMENINDICATION |
RACE | ETHNICITY | ||
| nCNV (%) | nWild-Type | logrank test | Wilcoxon-test | Fisher's exact test | Wilcoxon-test | Fisher's exact test | Fisher's exact test | Fisher's exact test | Fisher's exact test | |
| 7p gain | 462 (81%) | 108 |
4.94e-05 (0.00541) |
2.26e-06 (0.000494) |
0.744 (1.00) |
0.984 (1.00) |
0.0255 (0.689) |
0.141 (1.00) |
0.0625 (0.876) |
0.27 (1.00) |
| 7q gain | 467 (82%) | 103 |
9.81e-05 (0.00805) |
7.86e-06 (0.00129) |
0.222 (1.00) |
0.83 (1.00) |
0.0343 (0.804) |
0.132 (1.00) |
0.0381 (0.811) |
0.249 (1.00) |
| 10p gain | 13 (2%) | 557 |
0.00245 (0.134) |
6.17e-05 (0.00578) |
0.0405 (0.811) |
0.359 (1.00) |
0.276 (1.00) |
0.767 (1.00) |
0.0118 (0.455) |
0.281 (1.00) |
| 10p loss | 476 (84%) | 94 |
0.000303 (0.0181) |
3.12e-09 (2.04e-06) |
0.167 (1.00) |
0.119 (0.969) |
0.00606 (0.265) |
0.719 (1.00) |
0.111 (0.948) |
0.133 (1.00) |
| 10q loss | 487 (85%) | 83 |
0.00027 (0.0177) |
1.35e-07 (4.42e-05) |
0.466 (1.00) |
0.0158 (0.545) |
0.0524 (0.876) |
0.706 (1.00) |
0.0762 (0.876) |
0.0911 (0.89) |
| 20p gain | 220 (39%) | 350 |
0.344 (1.00) |
2.43e-05 (0.00318) |
0.334 (1.00) |
0.583 (1.00) |
0.486 (1.00) |
0.523 (1.00) |
0.0406 (0.811) |
1 (1.00) |
| 20q gain | 218 (38%) | 352 |
0.582 (1.00) |
0.000127 (0.00922) |
0.29 (1.00) |
0.771 (1.00) |
0.486 (1.00) |
0.521 (1.00) |
0.062 (0.876) |
1 (1.00) |
| 6p loss | 86 (15%) | 484 |
0.00309 (0.156) |
0.382 (1.00) |
0.811 (1.00) |
0.518 (1.00) |
0.631 (1.00) |
0.71 (1.00) |
0.256 (1.00) |
0.702 (1.00) |
| 8p loss | 58 (10%) | 512 |
0.78 (1.00) |
0.172 (1.00) |
0.157 (1.00) |
0.405 (1.00) |
0.614 (1.00) |
0.381 (1.00) |
0.004 (0.187) |
0.619 (1.00) |
| 1p gain | 81 (14%) | 489 |
0.366 (1.00) |
0.462 (1.00) |
0.624 (1.00) |
0.229 (1.00) |
0.0308 (0.749) |
0.253 (1.00) |
0.9 (1.00) |
0.665 (1.00) |
| 1q gain | 88 (15%) | 482 |
0.772 (1.00) |
0.61 (1.00) |
0.342 (1.00) |
0.32 (1.00) |
0.219 (1.00) |
0.388 (1.00) |
0.778 (1.00) |
0.688 (1.00) |
| 2p gain | 37 (6%) | 533 |
0.583 (1.00) |
0.78 (1.00) |
0.163 (1.00) |
0.531 (1.00) |
1 (1.00) |
0.857 (1.00) |
0.336 (1.00) |
1 (1.00) |
| 2q gain | 36 (6%) | 534 |
0.403 (1.00) |
0.309 (1.00) |
0.378 (1.00) |
0.372 (1.00) |
1 (1.00) |
1 (1.00) |
0.321 (1.00) |
1 (1.00) |
| 3p gain | 57 (10%) | 513 |
0.814 (1.00) |
0.0443 (0.854) |
0.319 (1.00) |
0.705 (1.00) |
0.708 (1.00) |
1 (1.00) |
1 (1.00) |
1 (1.00) |
| 3q gain | 63 (11%) | 507 |
0.668 (1.00) |
0.11 (0.948) |
0.413 (1.00) |
0.645 (1.00) |
0.497 (1.00) |
0.672 (1.00) |
0.931 (1.00) |
1 (1.00) |
| 4p gain | 36 (6%) | 534 |
0.795 (1.00) |
0.494 (1.00) |
0.86 (1.00) |
0.0787 (0.885) |
1 (1.00) |
0.585 (1.00) |
0.567 (1.00) |
0.576 (1.00) |
| 4q gain | 33 (6%) | 537 |
0.905 (1.00) |
0.566 (1.00) |
0.468 (1.00) |
0.075 (0.876) |
1 (1.00) |
0.342 (1.00) |
0.529 (1.00) |
1 (1.00) |
| 5p gain | 49 (9%) | 521 |
0.74 (1.00) |
0.69 (1.00) |
0.169 (1.00) |
0.216 (1.00) |
0.0621 (0.876) |
0.874 (1.00) |
1 (1.00) |
0.299 (1.00) |
| 5q gain | 41 (7%) | 529 |
0.386 (1.00) |
0.522 (1.00) |
0.134 (1.00) |
0.752 (1.00) |
0.106 (0.943) |
0.608 (1.00) |
0.83 (1.00) |
0.612 (1.00) |
| 6p gain | 24 (4%) | 546 |
0.358 (1.00) |
0.5 (1.00) |
0.671 (1.00) |
0.752 (1.00) |
1 (1.00) |
0.268 (1.00) |
0.479 (1.00) |
1 (1.00) |
| 6q gain | 23 (4%) | 547 |
0.283 (1.00) |
0.251 (1.00) |
1 (1.00) |
0.718 (1.00) |
1 (1.00) |
0.651 (1.00) |
0.56 (1.00) |
1 (1.00) |
| 8p gain | 52 (9%) | 518 |
0.936 (1.00) |
0.815 (1.00) |
0.657 (1.00) |
0.579 (1.00) |
0.632 (1.00) |
0.877 (1.00) |
0.316 (1.00) |
1 (1.00) |
| 8q gain | 59 (10%) | 511 |
0.429 (1.00) |
0.373 (1.00) |
0.482 (1.00) |
0.681 (1.00) |
0.57 (1.00) |
1 (1.00) |
0.71 (1.00) |
1 (1.00) |
| 9p gain | 47 (8%) | 523 |
0.375 (1.00) |
0.642 (1.00) |
0.164 (1.00) |
0.896 (1.00) |
0.155 (1.00) |
0.872 (1.00) |
0.294 (1.00) |
0.241 (1.00) |
| 9q gain | 70 (12%) | 500 |
0.928 (1.00) |
0.925 (1.00) |
0.153 (1.00) |
0.838 (1.00) |
0.376 (1.00) |
0.892 (1.00) |
0.293 (1.00) |
0.644 (1.00) |
| 10q gain | 3 (1%) | 567 |
0.353 (1.00) |
0.662 (1.00) |
0.565 (1.00) |
1 (1.00) |
0.254 (1.00) |
1 (1.00) |
0.0727 (0.876) |
|
| 11p gain | 17 (3%) | 553 |
0.589 (1.00) |
0.961 (1.00) |
0.806 (1.00) |
0.382 (1.00) |
1 (1.00) |
0.601 (1.00) |
0.595 (1.00) |
0.335 (1.00) |
| 11q gain | 14 (2%) | 556 |
0.261 (1.00) |
0.117 (0.969) |
0.267 (1.00) |
0.169 (1.00) |
0.458 (1.00) |
0.16 (1.00) |
1 (1.00) |
0.3 (1.00) |
| 12p gain | 59 (10%) | 511 |
0.631 (1.00) |
0.31 (1.00) |
0.482 (1.00) |
0.621 (1.00) |
0.929 (1.00) |
0.559 (1.00) |
0.928 (1.00) |
1 (1.00) |
| 12q gain | 48 (8%) | 522 |
0.949 (1.00) |
0.617 (1.00) |
0.218 (1.00) |
0.743 (1.00) |
0.555 (1.00) |
0.632 (1.00) |
0.138 (1.00) |
0.612 (1.00) |
| 13q gain | 10 (2%) | 560 |
0.466 (1.00) |
0.011 (0.449) |
0.202 (1.00) |
0.071 (0.876) |
0.566 (1.00) |
0.0888 (0.889) |
1 (1.00) |
1 (1.00) |
| 14q gain | 22 (4%) | 548 |
0.291 (1.00) |
0.0581 (0.876) |
0.513 (1.00) |
0.461 (1.00) |
0.0948 (0.901) |
0.818 (1.00) |
0.83 (1.00) |
1 (1.00) |
| 15q gain | 24 (4%) | 546 |
0.296 (1.00) |
0.879 (1.00) |
0.527 (1.00) |
0.0894 (0.889) |
0.828 (1.00) |
0.187 (1.00) |
0.842 (1.00) |
1 (1.00) |
| 16p gain | 38 (7%) | 532 |
0.0408 (0.811) |
0.859 (1.00) |
0.306 (1.00) |
0.94 (1.00) |
1 (1.00) |
0.0505 (0.876) |
0.461 (1.00) |
1 (1.00) |
| 16q gain | 37 (6%) | 533 |
0.16 (1.00) |
0.88 (1.00) |
0.606 (1.00) |
0.832 (1.00) |
1 (1.00) |
0.0704 (0.876) |
0.452 (1.00) |
1 (1.00) |
| 17p gain | 48 (8%) | 522 |
0.116 (0.969) |
0.0255 (0.689) |
0.28 (1.00) |
0.377 (1.00) |
0.412 (1.00) |
0.337 (1.00) |
0.409 (1.00) |
1 (1.00) |
| 17q gain | 59 (10%) | 511 |
0.0262 (0.689) |
0.0136 (0.494) |
0.576 (1.00) |
0.459 (1.00) |
0.666 (1.00) |
0.309 (1.00) |
0.488 (1.00) |
0.376 (1.00) |
| 18p gain | 57 (10%) | 513 |
0.606 (1.00) |
0.39 (1.00) |
0.67 (1.00) |
0.228 (1.00) |
0.0661 (0.876) |
0.658 (1.00) |
0.224 (1.00) |
0.347 (1.00) |
| 18q gain | 57 (10%) | 513 |
0.733 (1.00) |
0.227 (1.00) |
0.2 (1.00) |
0.231 (1.00) |
0.0656 (0.876) |
0.46 (1.00) |
0.397 (1.00) |
1 (1.00) |
| 19p gain | 222 (39%) | 348 |
0.485 (1.00) |
0.939 (1.00) |
0.792 (1.00) |
0.974 (1.00) |
0.591 (1.00) |
0.855 (1.00) |
0.547 (1.00) |
0.551 (1.00) |
| 19q gain | 196 (34%) | 374 |
0.634 (1.00) |
0.48 (1.00) |
0.59 (1.00) |
0.841 (1.00) |
0.848 (1.00) |
0.574 (1.00) |
0.304 (1.00) |
0.357 (1.00) |
| 21q gain | 63 (11%) | 507 |
0.633 (1.00) |
0.0812 (0.885) |
0.892 (1.00) |
0.134 (1.00) |
0.137 (1.00) |
1 (1.00) |
0.105 (0.943) |
0.376 (1.00) |
| 22q gain | 34 (6%) | 536 |
0.248 (1.00) |
0.571 (1.00) |
1 (1.00) |
0.313 (1.00) |
0.379 (1.00) |
1 (1.00) |
0.793 (1.00) |
0.149 (1.00) |
| xp gain | 15 (3%) | 555 |
0.829 (1.00) |
0.439 (1.00) |
0.598 (1.00) |
0.511 (1.00) |
0.713 (1.00) |
0.583 (1.00) |
0.724 (1.00) |
0.204 (1.00) |
| xq gain | 16 (3%) | 554 |
0.589 (1.00) |
0.558 (1.00) |
1 (1.00) |
0.626 (1.00) |
0.366 (1.00) |
0.177 (1.00) |
0.737 (1.00) |
0.244 (1.00) |
| 1p loss | 15 (3%) | 555 |
0.414 (1.00) |
0.0514 (0.876) |
0.425 (1.00) |
0.81 (1.00) |
0.486 (1.00) |
0.583 (1.00) |
0.735 (1.00) |
1 (1.00) |
| 1q loss | 14 (2%) | 556 |
0.337 (1.00) |
0.0262 (0.689) |
1 (1.00) |
0.168 (1.00) |
1 (1.00) |
0.406 (1.00) |
0.711 (1.00) |
1 (1.00) |
| 2p loss | 31 (5%) | 539 |
0.696 (1.00) |
0.0823 (0.885) |
0.0878 (0.889) |
0.83 (1.00) |
1 (1.00) |
0.326 (1.00) |
0.515 (1.00) |
1 (1.00) |
| 2q loss | 31 (5%) | 539 |
0.887 (1.00) |
0.11 (0.948) |
0.185 (1.00) |
0.56 (1.00) |
0.744 (1.00) |
0.168 (1.00) |
0.512 (1.00) |
1 (1.00) |
| 3p loss | 40 (7%) | 530 |
0.458 (1.00) |
0.0696 (0.876) |
1 (1.00) |
0.978 (1.00) |
0.569 (1.00) |
0.0814 (0.885) |
0.744 (1.00) |
0.203 (1.00) |
| 3q loss | 34 (6%) | 536 |
0.913 (1.00) |
0.655 (1.00) |
0.589 (1.00) |
0.652 (1.00) |
0.873 (1.00) |
0.457 (1.00) |
0.803 (1.00) |
0.515 (1.00) |
| 4p loss | 53 (9%) | 517 |
0.205 (1.00) |
0.741 (1.00) |
0.184 (1.00) |
0.248 (1.00) |
0.303 (1.00) |
0.54 (1.00) |
0.457 (1.00) |
0.299 (1.00) |
| 4q loss | 54 (9%) | 516 |
0.0283 (0.715) |
0.124 (0.992) |
0.771 (1.00) |
0.293 (1.00) |
1 (1.00) |
0.65 (1.00) |
0.599 (1.00) |
0.28 (1.00) |
| 5p loss | 42 (7%) | 528 |
0.0991 (0.929) |
0.524 (1.00) |
1 (1.00) |
0.552 (1.00) |
0.355 (1.00) |
0.0254 (0.689) |
0.103 (0.943) |
0.203 (1.00) |
| 5q loss | 43 (8%) | 527 |
0.106 (0.943) |
0.574 (1.00) |
1 (1.00) |
0.739 (1.00) |
0.194 (1.00) |
0.0922 (0.89) |
0.42 (1.00) |
0.0486 (0.876) |
| 6q loss | 124 (22%) | 446 |
0.235 (1.00) |
0.753 (1.00) |
0.299 (1.00) |
0.724 (1.00) |
0.738 (1.00) |
0.914 (1.00) |
0.247 (1.00) |
0.477 (1.00) |
| 7p loss | 8 (1%) | 562 |
0.454 (1.00) |
0.0527 (0.876) |
1 (1.00) |
0.749 (1.00) |
1 (1.00) |
0.282 (1.00) |
0.619 (1.00) |
1 (1.00) |
| 7q loss | 6 (1%) | 564 |
0.612 (1.00) |
0.0239 (0.689) |
1 (1.00) |
0.307 (1.00) |
1 (1.00) |
0.669 (1.00) |
0.517 (1.00) |
1 (1.00) |
| 8q loss | 42 (7%) | 528 |
0.071 (0.876) |
0.209 (1.00) |
0.417 (1.00) |
0.255 (1.00) |
0.895 (1.00) |
0.865 (1.00) |
0.28 (1.00) |
1 (1.00) |
| 9p loss | 198 (35%) | 372 |
0.48 (1.00) |
0.584 (1.00) |
0.719 (1.00) |
0.562 (1.00) |
0.968 (1.00) |
0.575 (1.00) |
0.51 (1.00) |
0.0642 (0.876) |
| 9q loss | 93 (16%) | 477 |
0.795 (1.00) |
0.687 (1.00) |
0.42 (1.00) |
0.745 (1.00) |
0.231 (1.00) |
0.719 (1.00) |
0.233 (1.00) |
0.235 (1.00) |
| 11p loss | 99 (17%) | 471 |
0.236 (1.00) |
0.82 (1.00) |
0.0709 (0.876) |
0.638 (1.00) |
0.482 (1.00) |
0.638 (1.00) |
0.638 (1.00) |
0.7 (1.00) |
| 11q loss | 93 (16%) | 477 |
0.986 (1.00) |
0.357 (1.00) |
0.42 (1.00) |
0.801 (1.00) |
0.806 (1.00) |
0.335 (1.00) |
0.953 (1.00) |
0.229 (1.00) |
| 12p loss | 58 (10%) | 512 |
0.853 (1.00) |
0.61 (1.00) |
0.48 (1.00) |
0.76 (1.00) |
0.664 (1.00) |
0.381 (1.00) |
0.206 (1.00) |
1 (1.00) |
| 12q loss | 57 (10%) | 513 |
0.976 (1.00) |
0.656 (1.00) |
0.568 (1.00) |
0.594 (1.00) |
0.36 (1.00) |
0.883 (1.00) |
0.22 (1.00) |
0.328 (1.00) |
| 13q loss | 184 (32%) | 386 |
0.941 (1.00) |
0.794 (1.00) |
1 (1.00) |
0.718 (1.00) |
0.56 (1.00) |
0.703 (1.00) |
0.395 (1.00) |
0.759 (1.00) |
| 14q loss | 145 (25%) | 425 |
0.847 (1.00) |
0.794 (1.00) |
0.327 (1.00) |
0.781 (1.00) |
0.513 (1.00) |
0.759 (1.00) |
0.278 (1.00) |
0.31 (1.00) |
| 15q loss | 105 (18%) | 465 |
0.896 (1.00) |
0.0748 (0.876) |
0.581 (1.00) |
0.838 (1.00) |
0.671 (1.00) |
0.0383 (0.811) |
0.957 (1.00) |
0.254 (1.00) |
| 16p loss | 63 (11%) | 507 |
0.12 (0.969) |
0.308 (1.00) |
0.683 (1.00) |
0.882 (1.00) |
0.186 (1.00) |
0.0883 (0.889) |
1 (1.00) |
1 (1.00) |
| 16q loss | 82 (14%) | 488 |
0.202 (1.00) |
0.838 (1.00) |
1 (1.00) |
0.58 (1.00) |
0.423 (1.00) |
0.0563 (0.876) |
0.648 (1.00) |
0.696 (1.00) |
| 17p loss | 63 (11%) | 507 |
0.725 (1.00) |
0.492 (1.00) |
0.413 (1.00) |
0.923 (1.00) |
0.861 (1.00) |
0.156 (1.00) |
1 (1.00) |
1 (1.00) |
| 17q loss | 40 (7%) | 530 |
0.755 (1.00) |
0.468 (1.00) |
0.503 (1.00) |
0.708 (1.00) |
0.894 (1.00) |
0.0543 (0.876) |
0.607 (1.00) |
0.587 (1.00) |
| 18p loss | 70 (12%) | 500 |
0.262 (1.00) |
0.838 (1.00) |
0.602 (1.00) |
0.58 (1.00) |
0.572 (1.00) |
1 (1.00) |
0.305 (1.00) |
0.647 (1.00) |
| 18q loss | 62 (11%) | 508 |
0.612 (1.00) |
0.791 (1.00) |
0.784 (1.00) |
0.267 (1.00) |
0.68 (1.00) |
0.2 (1.00) |
0.173 (1.00) |
0.146 (1.00) |
| 19p loss | 27 (5%) | 543 |
0.615 (1.00) |
0.95 (1.00) |
1 (1.00) |
0.764 (1.00) |
0.851 (1.00) |
0.835 (1.00) |
1 (1.00) |
1 (1.00) |
| 19q loss | 35 (6%) | 535 |
0.688 (1.00) |
0.88 (1.00) |
1 (1.00) |
0.751 (1.00) |
0.445 (1.00) |
1 (1.00) |
0.708 (1.00) |
1 (1.00) |
| 20p loss | 18 (3%) | 552 |
0.889 (1.00) |
0.383 (1.00) |
0.219 (1.00) |
0.932 (1.00) |
1 (1.00) |
1 (1.00) |
0.307 (1.00) |
0.335 (1.00) |
| 20q loss | 16 (3%) | 554 |
0.765 (1.00) |
0.717 (1.00) |
0.196 (1.00) |
0.978 (1.00) |
1 (1.00) |
0.788 (1.00) |
0.764 (1.00) |
1 (1.00) |
| 21q loss | 42 (7%) | 528 |
0.558 (1.00) |
0.669 (1.00) |
0.417 (1.00) |
0.198 (1.00) |
1 (1.00) |
0.308 (1.00) |
1 (1.00) |
0.241 (1.00) |
| 22q loss | 181 (32%) | 389 |
0.759 (1.00) |
0.0895 (0.889) |
0.854 (1.00) |
0.471 (1.00) |
0.789 (1.00) |
0.848 (1.00) |
0.675 (1.00) |
1 (1.00) |
| xp loss | 113 (20%) | 457 |
0.231 (1.00) |
0.58 (1.00) |
0.335 (1.00) |
0.572 (1.00) |
0.953 (1.00) |
0.656 (1.00) |
0.135 (1.00) |
0.714 (1.00) |
| xq loss | 105 (18%) | 465 |
0.214 (1.00) |
0.613 (1.00) |
0.32 (1.00) |
0.497 (1.00) |
0.822 (1.00) |
0.732 (1.00) |
0.211 (1.00) |
0.469 (1.00) |
P value = 4.94e-05 (logrank test), Q value = 0.0054
Table S1. Gene #13: '7p gain' versus Clinical Feature #1: 'Time to Death'
| nPatients | nDeath | Duration Range (Median), Month | |
|---|---|---|---|
| ALL | 569 | 465 | 0.1 - 127.6 (11.8) |
| 7P GAIN MUTATED | 461 | 385 | 0.1 - 127.6 (11.7) |
| 7P GAIN WILD-TYPE | 108 | 80 | 0.2 - 120.6 (14.8) |
Figure S1. Get High-res Image Gene #13: '7p gain' versus Clinical Feature #1: 'Time to Death'

P value = 2.26e-06 (Wilcoxon-test), Q value = 0.00049
Table S2. Gene #13: '7p gain' versus Clinical Feature #2: 'YEARS_TO_BIRTH'
| nPatients | Mean (Std.Dev) | |
|---|---|---|
| ALL | 570 | 57.7 (14.5) |
| 7P GAIN MUTATED | 462 | 59.6 (12.4) |
| 7P GAIN WILD-TYPE | 108 | 49.6 (19.4) |
Figure S2. Get High-res Image Gene #13: '7p gain' versus Clinical Feature #2: 'YEARS_TO_BIRTH'
P value = 9.81e-05 (logrank test), Q value = 0.008
Table S3. Gene #14: '7q gain' versus Clinical Feature #1: 'Time to Death'
| nPatients | nDeath | Duration Range (Median), Month | |
|---|---|---|---|
| ALL | 569 | 465 | 0.1 - 127.6 (11.8) |
| 7Q GAIN MUTATED | 466 | 386 | 0.1 - 127.6 (11.4) |
| 7Q GAIN WILD-TYPE | 103 | 79 | 0.2 - 120.6 (15.3) |
Figure S3. Get High-res Image Gene #14: '7q gain' versus Clinical Feature #1: 'Time to Death'

P value = 7.86e-06 (Wilcoxon-test), Q value = 0.0013
Table S4. Gene #14: '7q gain' versus Clinical Feature #2: 'YEARS_TO_BIRTH'
| nPatients | Mean (Std.Dev) | |
|---|---|---|
| ALL | 570 | 57.7 (14.5) |
| 7Q GAIN MUTATED | 467 | 59.6 (12.2) |
| 7Q GAIN WILD-TYPE | 103 | 49.4 (20.1) |
Figure S4. Get High-res Image Gene #14: '7q gain' versus Clinical Feature #2: 'YEARS_TO_BIRTH'
P value = 0.00245 (logrank test), Q value = 0.13
Table S5. Gene #19: '10p gain' versus Clinical Feature #1: 'Time to Death'
| nPatients | nDeath | Duration Range (Median), Month | |
|---|---|---|---|
| ALL | 569 | 465 | 0.1 - 127.6 (11.8) |
| 10P GAIN MUTATED | 13 | 8 | 0.4 - 100.0 (28.7) |
| 10P GAIN WILD-TYPE | 556 | 457 | 0.1 - 127.6 (11.8) |
Figure S5. Get High-res Image Gene #19: '10p gain' versus Clinical Feature #1: 'Time to Death'
P value = 6.17e-05 (Wilcoxon-test), Q value = 0.0058
Table S6. Gene #19: '10p gain' versus Clinical Feature #2: 'YEARS_TO_BIRTH'
| nPatients | Mean (Std.Dev) | |
|---|---|---|
| ALL | 570 | 57.7 (14.5) |
| 10P GAIN MUTATED | 13 | 37.5 (17.4) |
| 10P GAIN WILD-TYPE | 557 | 58.2 (14.1) |
Figure S6. Get High-res Image Gene #19: '10p gain' versus Clinical Feature #2: 'YEARS_TO_BIRTH'
P value = 2.43e-05 (Wilcoxon-test), Q value = 0.0032
Table S7. Gene #36: '20p gain' versus Clinical Feature #2: 'YEARS_TO_BIRTH'
| nPatients | Mean (Std.Dev) | |
|---|---|---|
| ALL | 570 | 57.7 (14.5) |
| 20P GAIN MUTATED | 220 | 61.0 (13.0) |
| 20P GAIN WILD-TYPE | 350 | 55.7 (15.0) |
Figure S7. Get High-res Image Gene #36: '20p gain' versus Clinical Feature #2: 'YEARS_TO_BIRTH'
P value = 0.000127 (Wilcoxon-test), Q value = 0.0092
Table S8. Gene #37: '20q gain' versus Clinical Feature #2: 'YEARS_TO_BIRTH'
| nPatients | Mean (Std.Dev) | |
|---|---|---|
| ALL | 570 | 57.7 (14.5) |
| 20Q GAIN MUTATED | 218 | 60.8 (13.3) |
| 20Q GAIN WILD-TYPE | 352 | 55.9 (15.0) |
Figure S8. Get High-res Image Gene #37: '20q gain' versus Clinical Feature #2: 'YEARS_TO_BIRTH'

P value = 0.00309 (logrank test), Q value = 0.16
Table S9. Gene #52: '6p loss' versus Clinical Feature #1: 'Time to Death'
| nPatients | nDeath | Duration Range (Median), Month | |
|---|---|---|---|
| ALL | 569 | 465 | 0.1 - 127.6 (11.8) |
| 6P LOSS MUTATED | 86 | 77 | 0.2 - 92.7 (9.5) |
| 6P LOSS WILD-TYPE | 483 | 388 | 0.1 - 127.6 (12.2) |
Figure S9. Get High-res Image Gene #52: '6p loss' versus Clinical Feature #1: 'Time to Death'
P value = 0.004 (Fisher's exact test), Q value = 0.19
Table S10. Gene #56: '8p loss' versus Clinical Feature #7: 'RACE'
| nPatients | ASIAN | BLACK OR AFRICAN AMERICAN | WHITE |
|---|---|---|---|
| ALL | 13 | 49 | 485 |
| 8P LOSS MUTATED | 5 | 2 | 46 |
| 8P LOSS WILD-TYPE | 8 | 47 | 439 |
Figure S10. Get High-res Image Gene #56: '8p loss' versus Clinical Feature #7: 'RACE'
P value = 0.000303 (logrank test), Q value = 0.018
Table S11. Gene #60: '10p loss' versus Clinical Feature #1: 'Time to Death'
| nPatients | nDeath | Duration Range (Median), Month | |
|---|---|---|---|
| ALL | 569 | 465 | 0.1 - 127.6 (11.8) |
| 10P LOSS MUTATED | 475 | 394 | 0.1 - 127.6 (11.8) |
| 10P LOSS WILD-TYPE | 94 | 71 | 0.4 - 115.9 (13.5) |
Figure S11. Get High-res Image Gene #60: '10p loss' versus Clinical Feature #1: 'Time to Death'
P value = 3.12e-09 (Wilcoxon-test), Q value = 2e-06
Table S12. Gene #60: '10p loss' versus Clinical Feature #2: 'YEARS_TO_BIRTH'
| nPatients | Mean (Std.Dev) | |
|---|---|---|
| ALL | 570 | 57.7 (14.5) |
| 10P LOSS MUTATED | 476 | 59.7 (12.7) |
| 10P LOSS WILD-TYPE | 94 | 47.9 (18.8) |
Figure S12. Get High-res Image Gene #60: '10p loss' versus Clinical Feature #2: 'YEARS_TO_BIRTH'
P value = 0.00027 (logrank test), Q value = 0.018
Table S13. Gene #61: '10q loss' versus Clinical Feature #1: 'Time to Death'
| nPatients | nDeath | Duration Range (Median), Month | |
|---|---|---|---|
| ALL | 569 | 465 | 0.1 - 127.6 (11.8) |
| 10Q LOSS MUTATED | 486 | 402 | 0.1 - 127.6 (11.7) |
| 10Q LOSS WILD-TYPE | 83 | 63 | 0.4 - 115.9 (14.1) |
Figure S13. Get High-res Image Gene #61: '10q loss' versus Clinical Feature #1: 'Time to Death'
P value = 1.35e-07 (Wilcoxon-test), Q value = 4.4e-05
Table S14. Gene #61: '10q loss' versus Clinical Feature #2: 'YEARS_TO_BIRTH'
| nPatients | Mean (Std.Dev) | |
|---|---|---|
| ALL | 570 | 57.7 (14.5) |
| 10Q LOSS MUTATED | 487 | 59.3 (13.1) |
| 10Q LOSS WILD-TYPE | 83 | 48.4 (18.6) |
Figure S14. Get High-res Image Gene #61: '10q loss' versus Clinical Feature #2: 'YEARS_TO_BIRTH'

-
Copy number data file = broad_values_by_arm.txt from GISTIC pipeline
-
Processed Copy number data file = /xchip/cga/gdac-prod/tcga-gdac/jobResults/GDAC_Correlate_Genomic_Events_Preprocess/GBM-TP/15096483/transformed.cor.cli.txt
-
Clinical data file = /xchip/cga/gdac-prod/tcga-gdac/jobResults/Append_Data/GBM-TP/15078636/GBM-TP.merged_data.txt
-
Number of patients = 570
-
Number of significantly arm-level cnvs = 82
-
Number of selected clinical features = 8
-
Exclude regions that fewer than K tumors have mutations, K = 3
For survival clinical features, the Kaplan-Meier survival curves of tumors with and without gene mutations were plotted and the statistical significance P values were estimated by logrank test (Bland and Altman 2004) using the 'survdiff' function in R
For binary or multi-class clinical features (nominal or ordinal), two-tailed Fisher's exact tests (Fisher 1922) were used to estimate the P values using the 'fisher.test' function in R
For multiple hypothesis correction, Q value is the False Discovery Rate (FDR) analogue of the P value (Benjamini and Hochberg 1995), defined as the minimum FDR at which the test may be called significant. We used the 'Benjamini and Hochberg' method of 'p.adjust' function in R to convert P values into Q values.
In addition to the links below, the full results of the analysis summarized in this report can also be downloaded programmatically using firehose_get, or interactively from either the Broad GDAC website or TCGA Data Coordination Center Portal.