This pipeline computes the correlation between significant copy number variation (cnv focal) genes and selected clinical features.
Testing the association between copy number variation 71 focal events and 8 clinical features across 570 patients, 27 significant findings detected with Q value < 0.25.
-
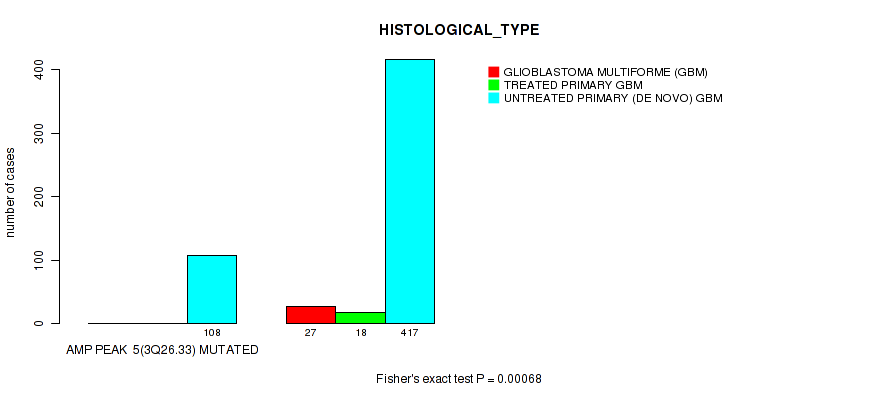
amp_3q26.33 cnv correlated to 'HISTOLOGICAL_TYPE'.
-
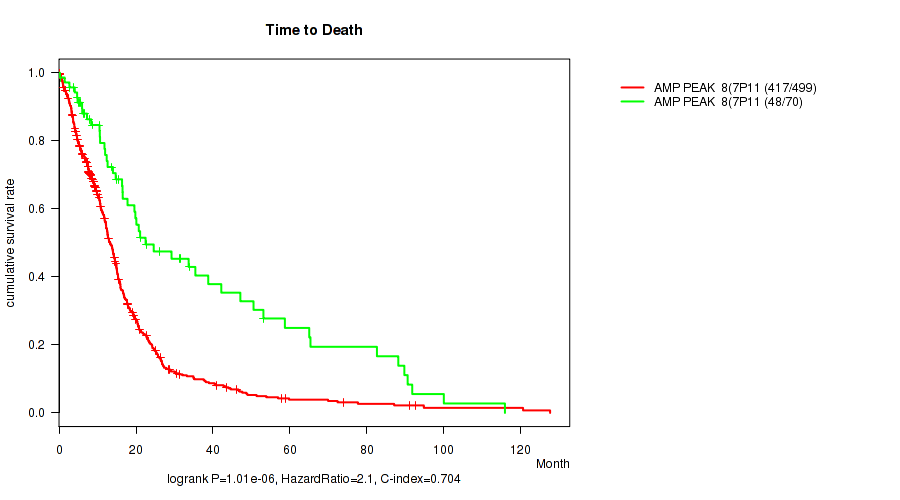
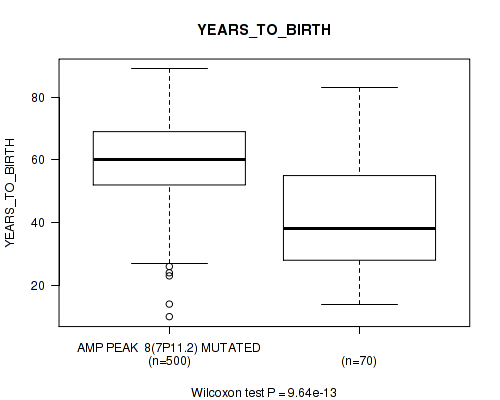
amp_7p11.2 cnv correlated to 'Time to Death' and 'YEARS_TO_BIRTH'.
-
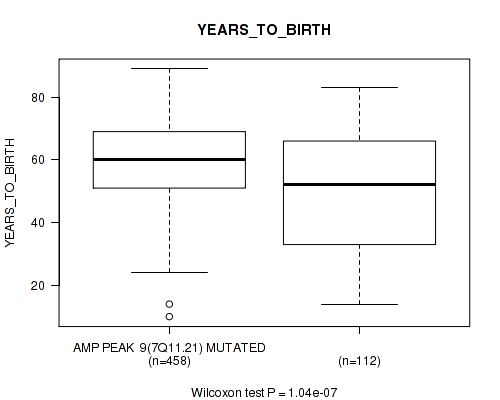
amp_7q11.21 cnv correlated to 'Time to Death' and 'YEARS_TO_BIRTH'.
-
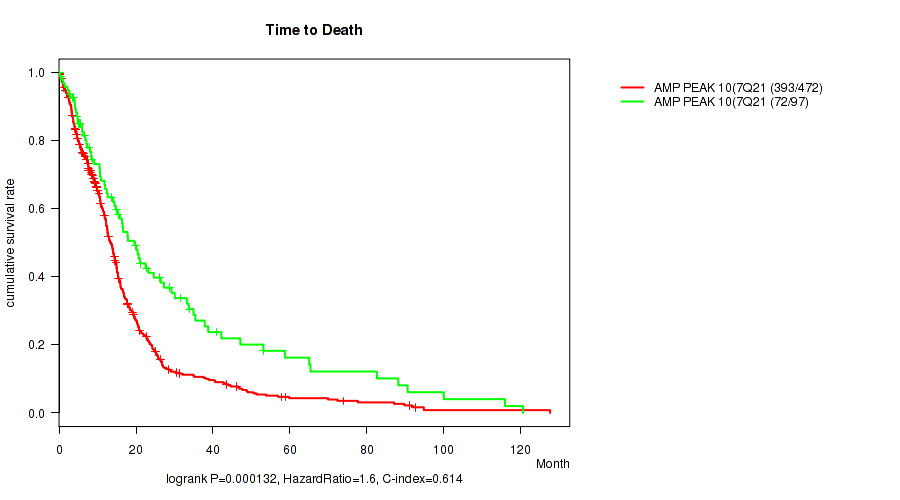
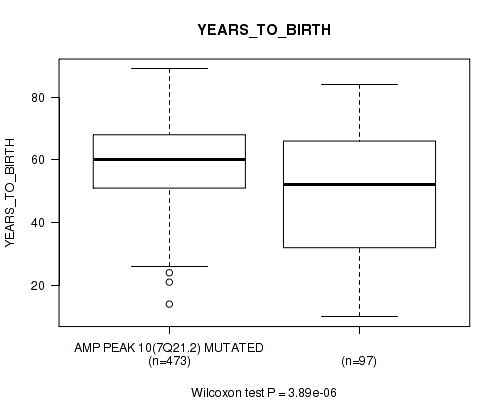
amp_7q21.2 cnv correlated to 'Time to Death' and 'YEARS_TO_BIRTH'.
-
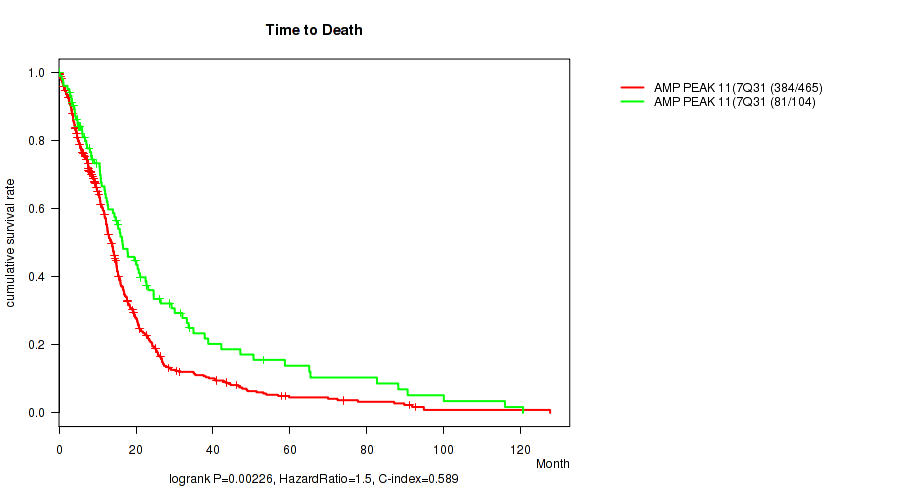
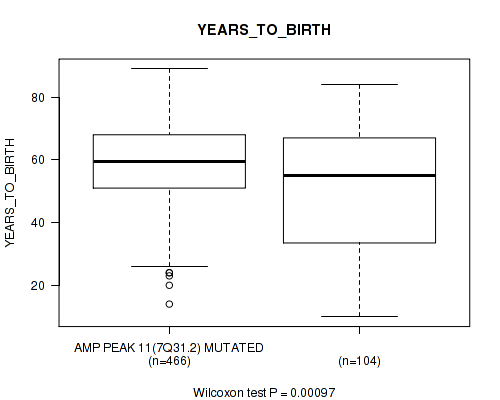
amp_7q31.2 cnv correlated to 'Time to Death' and 'YEARS_TO_BIRTH'.
-
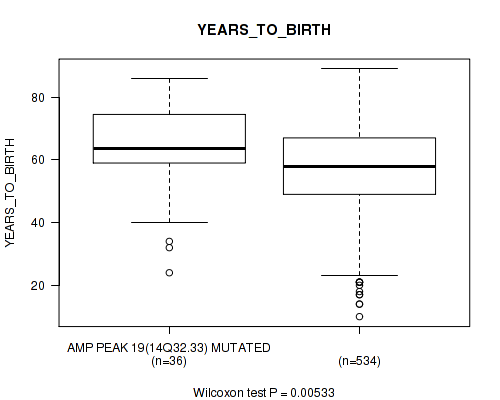
amp_14q32.33 cnv correlated to 'YEARS_TO_BIRTH'.
-
amp_17q25.1 cnv correlated to 'YEARS_TO_BIRTH'.
-
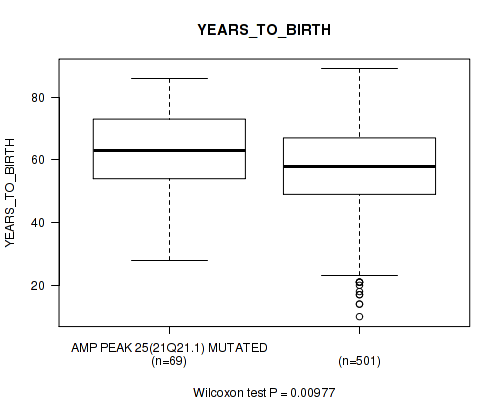
amp_21q21.1 cnv correlated to 'YEARS_TO_BIRTH'.
-
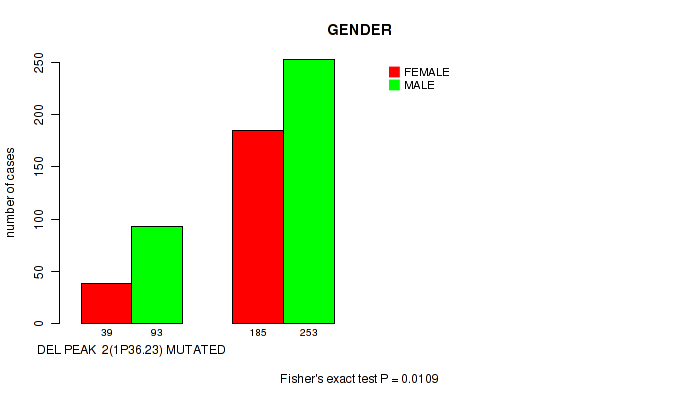
del_1p36.23 cnv correlated to 'GENDER'.
-
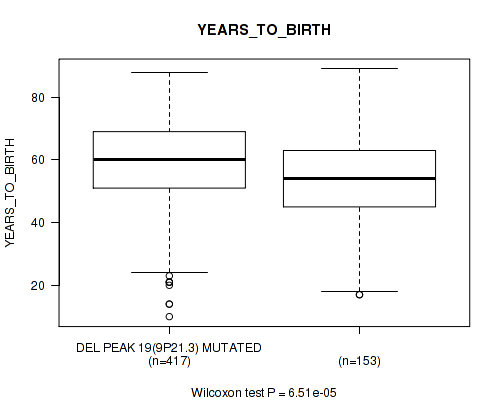
del_9p21.3 cnv correlated to 'YEARS_TO_BIRTH'.
-
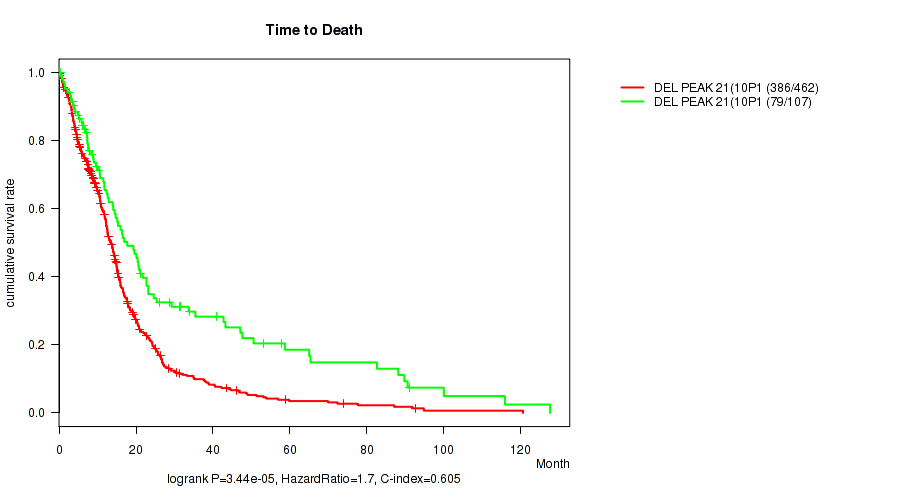
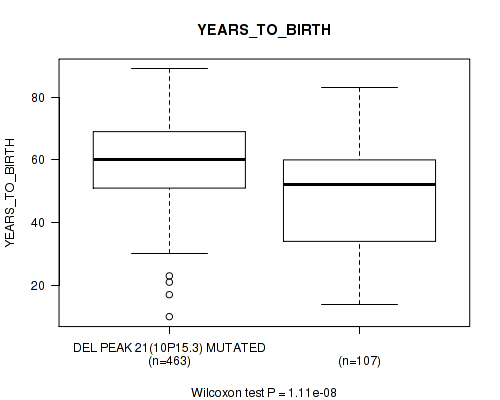
del_10p15.3 cnv correlated to 'Time to Death' and 'YEARS_TO_BIRTH'.
-
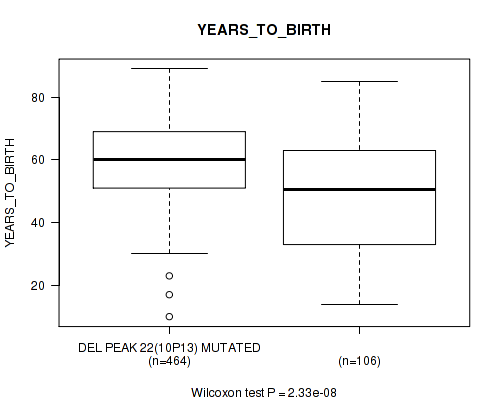
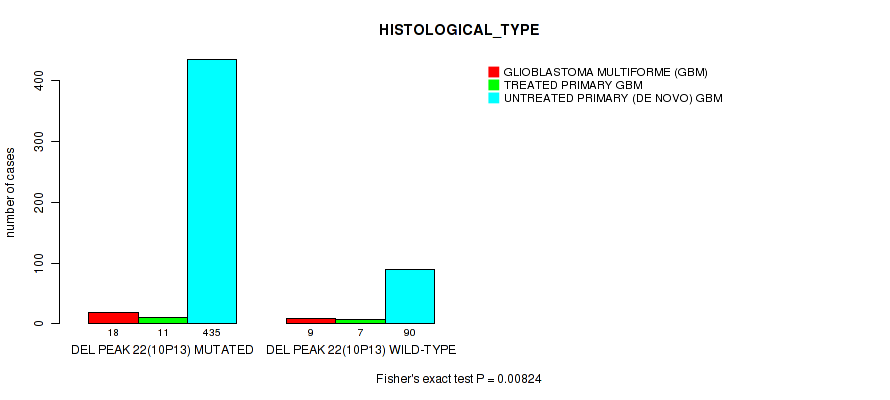
del_10p13 cnv correlated to 'Time to Death', 'YEARS_TO_BIRTH', and 'HISTOLOGICAL_TYPE'.
-
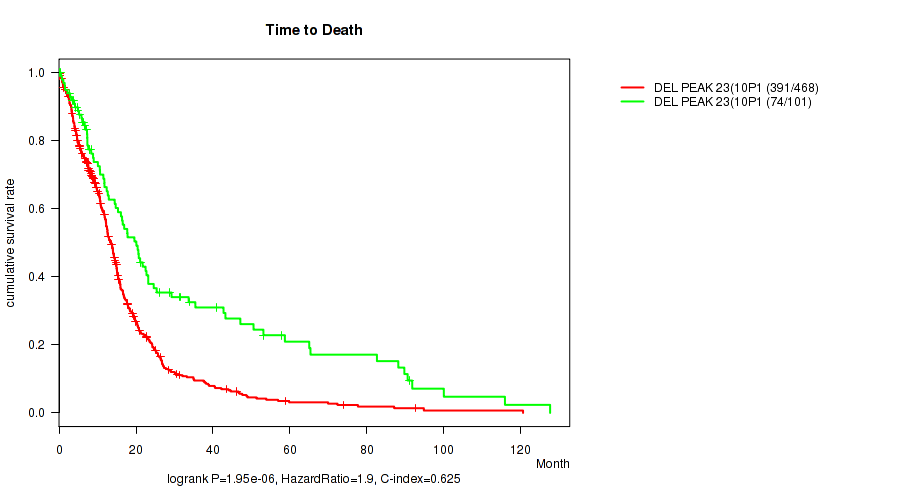
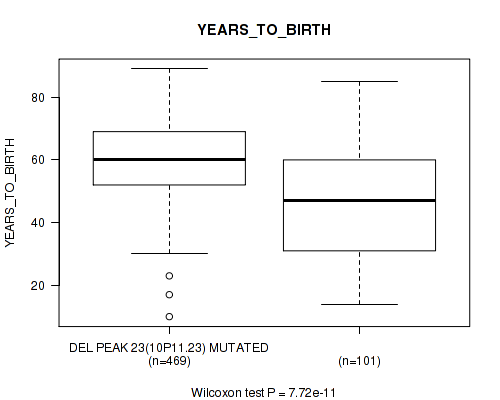
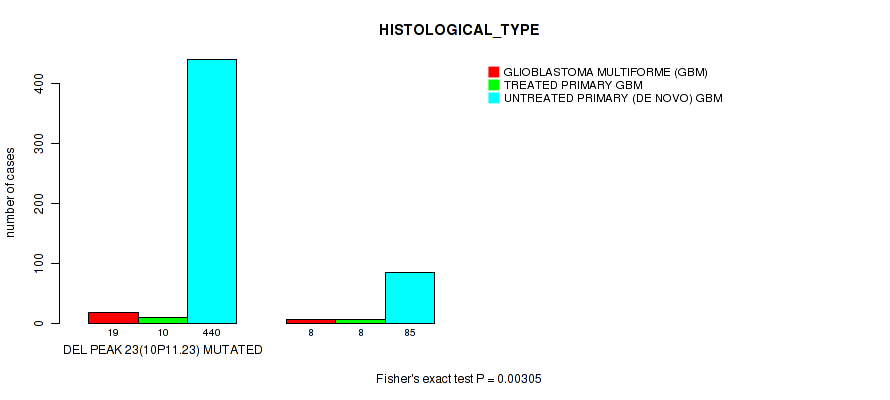
del_10p11.23 cnv correlated to 'Time to Death', 'YEARS_TO_BIRTH', and 'HISTOLOGICAL_TYPE'.
-
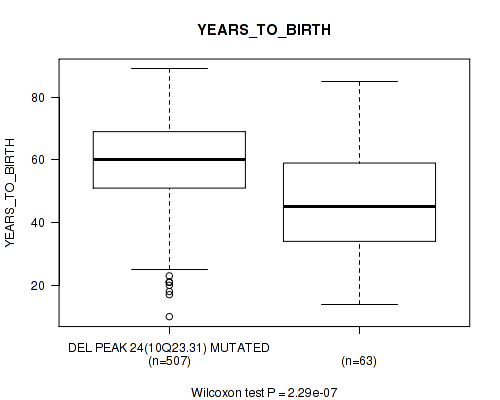
del_10q23.31 cnv correlated to 'Time to Death' and 'YEARS_TO_BIRTH'.
-
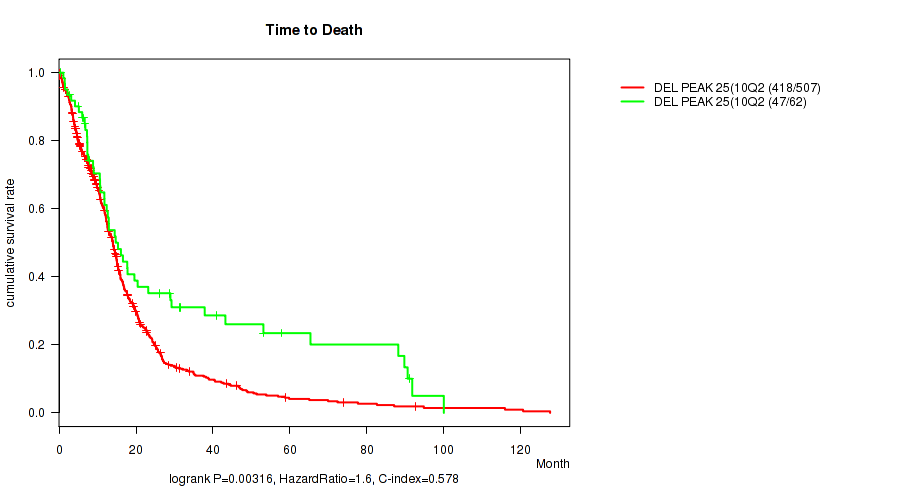
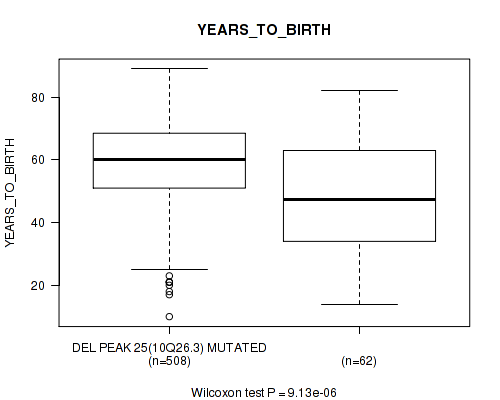
del_10q26.3 cnv correlated to 'Time to Death' and 'YEARS_TO_BIRTH'.
-
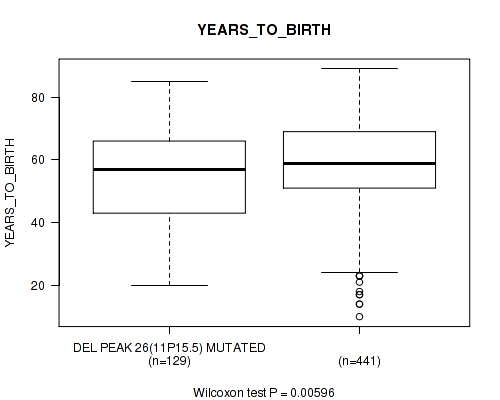
del_11p15.5 cnv correlated to 'YEARS_TO_BIRTH'.
Table 1. Get Full Table Overview of the association between significant copy number variation of 71 focal events and 8 clinical features. Shown in the table are P values (Q values). Thresholded by Q value < 0.25, 27 significant findings detected.
|
Clinical Features |
Time to Death |
YEARS TO BIRTH |
GENDER |
KARNOFSKY PERFORMANCE SCORE |
HISTOLOGICAL TYPE |
RADIATIONS RADIATION REGIMENINDICATION |
RACE | ETHNICITY | ||
| nCNV (%) | nWild-Type | logrank test | Wilcoxon-test | Fisher's exact test | Wilcoxon-test | Fisher's exact test | Fisher's exact test | Fisher's exact test | Fisher's exact test | |
| del 10p13 | 464 (81%) | 106 |
2.25e-05 (0.00107) |
2.33e-08 (3.31e-06) |
0.0471 (0.51) |
0.718 (0.996) |
0.00824 (0.191) |
0.82 (1.00) |
0.119 (0.745) |
0.27 (0.892) |
| del 10p11 23 | 469 (82%) | 101 |
1.95e-06 (0.000138) |
7.72e-11 (2.19e-08) |
0.116 (0.745) |
0.0919 (0.646) |
0.00305 (0.0855) |
0.816 (1.00) |
0.169 (0.823) |
0.252 (0.879) |
| amp 7p11 2 | 500 (88%) | 70 |
1.01e-06 (8.17e-05) |
9.64e-13 (5.48e-10) |
0.243 (0.877) |
0.0444 (0.51) |
0.0465 (0.51) |
0.105 (0.701) |
0.463 (0.946) |
0.0606 (0.583) |
| amp 7q11 21 | 458 (80%) | 112 |
2.08e-05 (0.00107) |
1.04e-07 (1.18e-05) |
0.198 (0.828) |
0.409 (0.937) |
0.0131 (0.265) |
0.145 (0.802) |
0.262 (0.892) |
0.14 (0.802) |
| amp 7q21 2 | 473 (83%) | 97 |
0.000132 (0.00467) |
3.89e-06 (0.000245) |
0.425 (0.937) |
0.313 (0.912) |
0.108 (0.714) |
0.192 (0.826) |
0.0375 (0.495) |
0.0444 (0.51) |
| amp 7q31 2 | 466 (82%) | 104 |
0.00226 (0.0675) |
0.00097 (0.0306) |
0.268 (0.892) |
0.869 (1.00) |
0.256 (0.883) |
0.0647 (0.608) |
0.0485 (0.51) |
0.0554 (0.552) |
| del 10p15 3 | 463 (81%) | 107 |
3.44e-05 (0.0015) |
1.11e-08 (2.11e-06) |
0.153 (0.813) |
0.414 (0.937) |
0.024 (0.378) |
0.649 (0.987) |
0.182 (0.823) |
0.274 (0.894) |
| del 10q23 31 | 507 (89%) | 63 |
5.62e-05 (0.00228) |
2.29e-07 (2.16e-05) |
0.785 (1.00) |
0.0867 (0.646) |
0.023 (0.373) |
0.888 (1.00) |
0.358 (0.92) |
0.635 (0.978) |
| del 10q26 3 | 508 (89%) | 62 |
0.00316 (0.0855) |
9.13e-06 (0.000519) |
0.681 (0.994) |
0.0879 (0.646) |
0.089 (0.646) |
1 (1.00) |
0.0839 (0.646) |
0.632 (0.976) |
| amp 3q26 33 | 108 (19%) | 462 |
0.19 (0.823) |
0.0316 (0.473) |
0.662 (0.992) |
0.698 (0.994) |
0.00068 (0.0227) |
0.91 (1.00) |
0.188 (0.823) |
0.701 (0.994) |
| amp 14q32 33 | 36 (6%) | 534 |
0.404 (0.937) |
0.00533 (0.138) |
0.486 (0.948) |
0.307 (0.912) |
0.463 (0.946) |
0.856 (1.00) |
0.812 (1.00) |
1 (1.00) |
| amp 17q25 1 | 83 (15%) | 487 |
0.0373 (0.495) |
0.00839 (0.191) |
0.183 (0.823) |
0.442 (0.937) |
0.783 (1.00) |
0.529 (0.948) |
0.159 (0.823) |
0.692 (0.994) |
| amp 21q21 1 | 69 (12%) | 501 |
0.847 (1.00) |
0.00977 (0.213) |
1 (1.00) |
0.386 (0.925) |
0.201 (0.828) |
0.413 (0.937) |
0.0903 (0.646) |
0.378 (0.925) |
| del 1p36 23 | 132 (23%) | 438 |
0.786 (1.00) |
0.126 (0.764) |
0.0109 (0.229) |
0.0667 (0.608) |
0.536 (0.948) |
0.526 (0.948) |
0.175 (0.823) |
0.311 (0.912) |
| del 9p21 3 | 417 (73%) | 153 |
0.0183 (0.315) |
6.51e-05 (0.00247) |
0.44 (0.937) |
0.166 (0.823) |
0.664 (0.992) |
0.315 (0.912) |
0.546 (0.954) |
0.745 (1.00) |
| del 11p15 5 | 129 (23%) | 441 |
0.0404 (0.51) |
0.00596 (0.147) |
0.219 (0.846) |
0.16 (0.823) |
0.528 (0.948) |
0.831 (1.00) |
1 (1.00) |
1 (1.00) |
| amp 1p36 21 | 91 (16%) | 479 |
0.0752 (0.637) |
0.27 (0.892) |
0.483 (0.948) |
0.184 (0.823) |
0.0161 (0.295) |
0.715 (0.996) |
0.0893 (0.646) |
0.4 (0.937) |
| amp 1q32 1 | 158 (28%) | 412 |
0.269 (0.892) |
0.178 (0.823) |
1 (1.00) |
0.359 (0.92) |
1 (1.00) |
0.843 (1.00) |
0.879 (1.00) |
0.526 (0.948) |
| amp 1q44 | 98 (17%) | 472 |
0.559 (0.954) |
0.947 (1.00) |
0.214 (0.846) |
0.514 (0.948) |
0.144 (0.802) |
0.48 (0.948) |
0.908 (1.00) |
0.424 (0.937) |
| amp 2p24 3 | 49 (9%) | 521 |
0.212 (0.846) |
0.277 (0.896) |
0.445 (0.937) |
0.916 (1.00) |
1 (1.00) |
0.754 (1.00) |
0.6 (0.967) |
0.612 (0.97) |
| amp 4p16 3 | 48 (8%) | 522 |
0.609 (0.97) |
0.849 (1.00) |
0.356 (0.92) |
0.382 (0.925) |
0.904 (1.00) |
0.632 (0.976) |
0.776 (1.00) |
1 (1.00) |
| amp 4q12 | 107 (19%) | 463 |
0.22 (0.846) |
0.147 (0.802) |
0.442 (0.937) |
0.842 (1.00) |
0.505 (0.948) |
0.305 (0.912) |
0.682 (0.994) |
1 (1.00) |
| amp 8q24 21 | 70 (12%) | 500 |
0.0709 (0.622) |
0.441 (0.937) |
0.517 (0.948) |
0.926 (1.00) |
0.875 (1.00) |
0.788 (1.00) |
0.227 (0.846) |
1 (1.00) |
| amp 11p13 | 30 (5%) | 540 |
0.785 (1.00) |
0.28 (0.896) |
1 (1.00) |
0.597 (0.966) |
0.737 (1.00) |
1 (1.00) |
0.769 (1.00) |
0.515 (0.948) |
| amp 12p13 32 | 84 (15%) | 486 |
0.993 (1.00) |
0.173 (0.823) |
1 (1.00) |
0.845 (1.00) |
0.943 (1.00) |
0.532 (0.948) |
0.558 (0.954) |
0.688 (0.994) |
| amp 12q14 1 | 134 (24%) | 436 |
0.286 (0.896) |
0.703 (0.994) |
0.419 (0.937) |
0.961 (1.00) |
0.719 (0.996) |
0.834 (1.00) |
0.722 (0.996) |
0.31 (0.912) |
| amp 12q15 | 92 (16%) | 478 |
0.56 (0.954) |
0.579 (0.954) |
0.353 (0.92) |
0.98 (1.00) |
0.758 (1.00) |
0.546 (0.954) |
0.552 (0.954) |
0.229 (0.846) |
| amp 13q34 | 32 (6%) | 538 |
0.827 (1.00) |
0.691 (0.994) |
0.36 (0.92) |
0.534 (0.948) |
0.477 (0.948) |
0.699 (0.994) |
1 (1.00) |
1 (1.00) |
| amp 13q34 | 30 (5%) | 540 |
0.692 (0.994) |
0.415 (0.937) |
0.568 (0.954) |
0.39 (0.93) |
0.733 (1.00) |
0.843 (1.00) |
0.486 (0.948) |
1 (1.00) |
| amp 17p13 2 | 51 (9%) | 519 |
0.704 (0.994) |
0.496 (0.948) |
0.293 (0.899) |
0.957 (1.00) |
0.521 (0.948) |
0.533 (0.948) |
0.711 (0.996) |
1 (1.00) |
| amp 19p13 3 | 240 (42%) | 330 |
0.142 (0.802) |
0.673 (0.994) |
0.931 (1.00) |
0.17 (0.823) |
0.527 (0.948) |
0.857 (1.00) |
0.411 (0.937) |
0.571 (0.954) |
| amp 19p13 2 | 245 (43%) | 325 |
0.244 (0.877) |
0.983 (1.00) |
1 (1.00) |
0.56 (0.954) |
0.47 (0.948) |
1 (1.00) |
0.724 (0.996) |
0.77 (1.00) |
| amp 19q12 | 213 (37%) | 357 |
0.566 (0.954) |
0.503 (0.948) |
0.595 (0.966) |
0.893 (1.00) |
0.581 (0.954) |
0.854 (1.00) |
0.753 (1.00) |
0.385 (0.925) |
| del 1p36 32 | 96 (17%) | 474 |
0.489 (0.948) |
0.618 (0.971) |
0.0293 (0.45) |
0.667 (0.994) |
0.119 (0.745) |
0.723 (0.996) |
0.0919 (0.646) |
0.7 (0.994) |
| del 1p32 3 | 60 (11%) | 510 |
0.583 (0.955) |
0.0554 (0.552) |
0.126 (0.764) |
0.642 (0.985) |
0.577 (0.954) |
0.147 (0.802) |
0.266 (0.892) |
1 (1.00) |
| del 1p22 1 | 47 (8%) | 523 |
0.497 (0.948) |
0.359 (0.92) |
1 (1.00) |
0.366 (0.921) |
0.073 (0.628) |
0.518 (0.948) |
1 (1.00) |
1 (1.00) |
| del 1q42 11 | 49 (9%) | 521 |
0.142 (0.802) |
0.288 (0.896) |
1 (1.00) |
0.0434 (0.51) |
0.83 (1.00) |
0.152 (0.813) |
0.358 (0.92) |
0.251 (0.879) |
| del 1q44 | 34 (6%) | 536 |
0.428 (0.937) |
0.32 (0.92) |
1 (1.00) |
0.299 (0.906) |
0.873 (1.00) |
0.851 (1.00) |
0.88 (1.00) |
0.475 (0.948) |
| del 2q22 1 | 46 (8%) | 524 |
0.289 (0.896) |
0.094 (0.647) |
0.431 (0.937) |
0.578 (0.954) |
0.252 (0.879) |
0.0712 (0.622) |
0.41 (0.937) |
0.612 (0.97) |
| del 2q37 1 | 54 (9%) | 516 |
0.878 (1.00) |
0.75 (1.00) |
0.188 (0.823) |
0.652 (0.987) |
1 (1.00) |
0.362 (0.921) |
0.466 (0.946) |
1 (1.00) |
| del 3p21 1 | 53 (9%) | 517 |
0.0478 (0.51) |
0.0148 (0.28) |
0.769 (1.00) |
0.608 (0.97) |
0.334 (0.92) |
0.0474 (0.51) |
0.491 (0.948) |
0.338 (0.92) |
| del 3q13 31 | 56 (10%) | 514 |
0.908 (1.00) |
0.397 (0.937) |
0.568 (0.954) |
0.252 (0.879) |
0.775 (1.00) |
0.231 (0.846) |
0.523 (0.948) |
0.347 (0.92) |
| del 3q22 1 | 58 (10%) | 512 |
0.98 (1.00) |
0.385 (0.925) |
1 (1.00) |
0.458 (0.946) |
0.778 (1.00) |
0.56 (0.954) |
0.29 (0.896) |
0.366 (0.921) |
| del 3q29 | 65 (11%) | 505 |
0.179 (0.823) |
0.571 (0.954) |
1 (1.00) |
0.342 (0.92) |
1 (1.00) |
0.262 (0.892) |
1 (1.00) |
1 (1.00) |
| del 4p16 3 | 76 (13%) | 494 |
0.0788 (0.646) |
0.0921 (0.646) |
0.257 (0.883) |
0.376 (0.925) |
0.251 (0.879) |
0.0675 (0.608) |
0.444 (0.937) |
0.658 (0.988) |
| del 4q34 3 | 91 (16%) | 479 |
0.0601 (0.583) |
0.115 (0.745) |
0.0464 (0.51) |
0.688 (0.994) |
0.948 (1.00) |
0.181 (0.823) |
0.225 (0.846) |
1 (1.00) |
| del 5q34 | 68 (12%) | 502 |
0.0355 (0.492) |
0.273 (0.894) |
0.186 (0.823) |
0.574 (0.954) |
0.451 (0.945) |
0.784 (1.00) |
0.0665 (0.608) |
0.164 (0.823) |
| del 6q22 31 | 157 (28%) | 413 |
0.0223 (0.372) |
0.219 (0.846) |
0.0841 (0.646) |
0.58 (0.954) |
0.421 (0.937) |
0.921 (1.00) |
0.513 (0.948) |
0.193 (0.826) |
| del 6q26 | 178 (31%) | 392 |
0.0877 (0.646) |
0.886 (1.00) |
0.197 (0.828) |
0.975 (1.00) |
0.201 (0.828) |
0.632 (0.976) |
0.97 (1.00) |
0.355 (0.92) |
| del 8p23 2 | 66 (12%) | 504 |
0.344 (0.92) |
0.0409 (0.51) |
0.286 (0.896) |
0.327 (0.92) |
0.866 (1.00) |
0.678 (0.994) |
0.0179 (0.315) |
0.376 (0.925) |
| del 9q34 2 | 79 (14%) | 491 |
0.941 (1.00) |
0.961 (1.00) |
0.901 (1.00) |
0.724 (0.996) |
0.0508 (0.525) |
0.442 (0.937) |
0.225 (0.846) |
0.229 (0.846) |
| del 11p11 2 | 105 (18%) | 465 |
0.141 (0.802) |
0.676 (0.994) |
0.224 (0.846) |
0.518 (0.948) |
0.234 (0.851) |
0.818 (1.00) |
0.709 (0.996) |
1 (1.00) |
| del 11q14 1 | 96 (17%) | 474 |
0.947 (1.00) |
0.533 (0.948) |
0.36 (0.92) |
0.757 (1.00) |
0.287 (0.896) |
0.153 (0.813) |
0.953 (1.00) |
0.7 (0.994) |
| del 12p13 1 | 71 (12%) | 499 |
0.168 (0.823) |
0.982 (1.00) |
0.438 (0.937) |
0.423 (0.937) |
0.308 (0.912) |
0.281 (0.896) |
0.123 (0.759) |
1 (1.00) |
| del 12q12 | 76 (13%) | 494 |
0.653 (0.987) |
0.653 (0.987) |
0.615 (0.97) |
0.835 (1.00) |
1 (1.00) |
0.435 (0.937) |
0.453 (0.945) |
0.658 (0.988) |
| del 12q15 | 78 (14%) | 492 |
0.678 (0.994) |
0.644 (0.987) |
0.454 (0.945) |
0.402 (0.937) |
0.827 (1.00) |
0.3 (0.906) |
0.379 (0.925) |
0.21 (0.846) |
| del 13q14 2 | 238 (42%) | 332 |
0.851 (1.00) |
0.744 (1.00) |
0.544 (0.954) |
0.731 (1.00) |
0.33 (0.92) |
0.653 (0.987) |
0.324 (0.92) |
1 (1.00) |
| del 13q22 1 | 226 (40%) | 344 |
0.797 (1.00) |
0.954 (1.00) |
0.93 (1.00) |
0.227 (0.846) |
0.338 (0.92) |
0.466 (0.946) |
0.719 (0.996) |
0.379 (0.925) |
| del 14q13 1 | 175 (31%) | 395 |
0.488 (0.948) |
0.565 (0.954) |
0.0945 (0.647) |
0.459 (0.946) |
0.351 (0.92) |
0.5 (0.948) |
0.333 (0.92) |
0.119 (0.745) |
| del 14q24 2 | 171 (30%) | 399 |
0.884 (1.00) |
0.514 (0.948) |
0.224 (0.846) |
0.745 (1.00) |
0.296 (0.905) |
0.437 (0.937) |
0.688 (0.994) |
1 (1.00) |
| del 15q14 | 151 (26%) | 419 |
0.325 (0.92) |
0.0334 (0.483) |
0.698 (0.994) |
0.919 (1.00) |
0.963 (1.00) |
0.313 (0.912) |
0.382 (0.925) |
0.327 (0.92) |
| del 16p12 2 | 92 (16%) | 478 |
0.137 (0.802) |
0.206 (0.843) |
0.353 (0.92) |
0.549 (0.954) |
0.435 (0.937) |
0.546 (0.954) |
0.904 (1.00) |
1 (1.00) |
| del 16q23 1 | 99 (17%) | 471 |
0.17 (0.823) |
0.754 (1.00) |
0.822 (1.00) |
0.142 (0.802) |
0.626 (0.976) |
0.034 (0.483) |
0.608 (0.97) |
0.703 (0.994) |
| del 17p13 2 | 85 (15%) | 485 |
0.854 (1.00) |
0.573 (0.954) |
0.28 (0.896) |
0.328 (0.92) |
1 (1.00) |
0.619 (0.971) |
0.775 (1.00) |
1 (1.00) |
| del 17p13 1 | 95 (17%) | 475 |
0.627 (0.976) |
0.102 (0.691) |
0.0849 (0.646) |
0.977 (1.00) |
0.808 (1.00) |
0.189 (0.823) |
0.953 (1.00) |
1 (1.00) |
| del 17q11 2 | 70 (12%) | 500 |
0.59 (0.962) |
0.532 (0.948) |
0.794 (1.00) |
0.373 (0.925) |
1 (1.00) |
0.077 (0.643) |
0.733 (1.00) |
1 (1.00) |
| del 18q22 3 | 82 (14%) | 488 |
0.992 (1.00) |
0.507 (0.948) |
0.808 (1.00) |
0.161 (0.823) |
0.782 (1.00) |
0.614 (0.97) |
0.357 (0.92) |
0.4 (0.937) |
| del 19q13 41 | 99 (17%) | 471 |
0.0144 (0.28) |
0.477 (0.948) |
0.822 (1.00) |
0.601 (0.967) |
0.592 (0.963) |
1 (1.00) |
0.548 (0.954) |
1 (1.00) |
| del 21q21 1 | 56 (10%) | 514 |
0.514 (0.948) |
0.41 (0.937) |
0.775 (1.00) |
0.417 (0.937) |
0.847 (1.00) |
0.181 (0.823) |
0.927 (1.00) |
0.366 (0.921) |
| del 22q13 32 | 212 (37%) | 358 |
0.407 (0.937) |
0.155 (0.813) |
0.929 (1.00) |
0.505 (0.948) |
0.969 (1.00) |
0.713 (0.996) |
0.225 (0.846) |
1 (1.00) |
| del xp22 2 | 117 (21%) | 453 |
0.2 (0.828) |
0.492 (0.948) |
1 (1.00) |
0.463 (0.946) |
0.956 (1.00) |
1 (1.00) |
0.621 (0.972) |
0.474 (0.948) |
P value = 0.00068 (Fisher's exact test), Q value = 0.023
Table S1. Gene #5: 'amp_3q26.33' versus Clinical Feature #5: 'HISTOLOGICAL_TYPE'
| nPatients | GLIOBLASTOMA MULTIFORME (GBM) | TREATED PRIMARY GBM | UNTREATED PRIMARY (DE NOVO) GBM |
|---|---|---|---|
| ALL | 27 | 18 | 525 |
| AMP PEAK 5(3Q26.33) MUTATED | 0 | 0 | 108 |
| AMP PEAK 5(3Q26.33) WILD-TYPE | 27 | 18 | 417 |
Figure S1. Get High-res Image Gene #5: 'amp_3q26.33' versus Clinical Feature #5: 'HISTOLOGICAL_TYPE'
P value = 1.01e-06 (logrank test), Q value = 8.2e-05
Table S2. Gene #8: 'amp_7p11.2' versus Clinical Feature #1: 'Time to Death'
| nPatients | nDeath | Duration Range (Median), Month | |
|---|---|---|---|
| ALL | 569 | 465 | 0.1 - 127.6 (11.8) |
| AMP PEAK 8(7P11.2) MUTATED | 499 | 417 | 0.1 - 127.6 (11.5) |
| AMP PEAK 8(7P11.2) WILD-TYPE | 70 | 48 | 0.2 - 115.9 (16.4) |
Figure S2. Get High-res Image Gene #8: 'amp_7p11.2' versus Clinical Feature #1: 'Time to Death'
P value = 9.64e-13 (Wilcoxon-test), Q value = 5.5e-10
Table S3. Gene #8: 'amp_7p11.2' versus Clinical Feature #2: 'YEARS_TO_BIRTH'
| nPatients | Mean (Std.Dev) | |
|---|---|---|
| ALL | 570 | 57.7 (14.5) |
| AMP PEAK 8(7P11.2) MUTATED | 500 | 59.8 (12.5) |
| AMP PEAK 8(7P11.2) WILD-TYPE | 70 | 43.1 (18.8) |
Figure S3. Get High-res Image Gene #8: 'amp_7p11.2' versus Clinical Feature #2: 'YEARS_TO_BIRTH'
P value = 2.08e-05 (logrank test), Q value = 0.0011
Table S4. Gene #9: 'amp_7q11.21' versus Clinical Feature #1: 'Time to Death'
| nPatients | nDeath | Duration Range (Median), Month | |
|---|---|---|---|
| ALL | 569 | 465 | 0.1 - 127.6 (11.8) |
| AMP PEAK 9(7Q11.21) MUTATED | 457 | 379 | 0.1 - 127.6 (11.3) |
| AMP PEAK 9(7Q11.21) WILD-TYPE | 112 | 86 | 0.2 - 120.6 (14.8) |
Figure S4. Get High-res Image Gene #9: 'amp_7q11.21' versus Clinical Feature #1: 'Time to Death'

P value = 1.04e-07 (Wilcoxon-test), Q value = 1.2e-05
Table S5. Gene #9: 'amp_7q11.21' versus Clinical Feature #2: 'YEARS_TO_BIRTH'
| nPatients | Mean (Std.Dev) | |
|---|---|---|
| ALL | 570 | 57.7 (14.5) |
| AMP PEAK 9(7Q11.21) MUTATED | 458 | 59.8 (12.4) |
| AMP PEAK 9(7Q11.21) WILD-TYPE | 112 | 49.1 (18.7) |
Figure S5. Get High-res Image Gene #9: 'amp_7q11.21' versus Clinical Feature #2: 'YEARS_TO_BIRTH'
P value = 0.000132 (logrank test), Q value = 0.0047
Table S6. Gene #10: 'amp_7q21.2' versus Clinical Feature #1: 'Time to Death'
| nPatients | nDeath | Duration Range (Median), Month | |
|---|---|---|---|
| ALL | 569 | 465 | 0.1 - 127.6 (11.8) |
| AMP PEAK 10(7Q21.2) MUTATED | 472 | 393 | 0.1 - 127.6 (11.7) |
| AMP PEAK 10(7Q21.2) WILD-TYPE | 97 | 72 | 0.1 - 120.6 (14.7) |
Figure S6. Get High-res Image Gene #10: 'amp_7q21.2' versus Clinical Feature #1: 'Time to Death'
P value = 3.89e-06 (Wilcoxon-test), Q value = 0.00025
Table S7. Gene #10: 'amp_7q21.2' versus Clinical Feature #2: 'YEARS_TO_BIRTH'
| nPatients | Mean (Std.Dev) | |
|---|---|---|
| ALL | 570 | 57.7 (14.5) |
| AMP PEAK 10(7Q21.2) MUTATED | 473 | 59.5 (12.5) |
| AMP PEAK 10(7Q21.2) WILD-TYPE | 97 | 49.2 (19.9) |
Figure S7. Get High-res Image Gene #10: 'amp_7q21.2' versus Clinical Feature #2: 'YEARS_TO_BIRTH'
P value = 0.00226 (logrank test), Q value = 0.068
Table S8. Gene #11: 'amp_7q31.2' versus Clinical Feature #1: 'Time to Death'
| nPatients | nDeath | Duration Range (Median), Month | |
|---|---|---|---|
| ALL | 569 | 465 | 0.1 - 127.6 (11.8) |
| AMP PEAK 11(7Q31.2) MUTATED | 465 | 384 | 0.1 - 127.6 (11.7) |
| AMP PEAK 11(7Q31.2) WILD-TYPE | 104 | 81 | 0.1 - 120.6 (14.2) |
Figure S8. Get High-res Image Gene #11: 'amp_7q31.2' versus Clinical Feature #1: 'Time to Death'
P value = 0.00097 (Wilcoxon-test), Q value = 0.031
Table S9. Gene #11: 'amp_7q31.2' versus Clinical Feature #2: 'YEARS_TO_BIRTH'
| nPatients | Mean (Std.Dev) | |
|---|---|---|
| ALL | 570 | 57.7 (14.5) |
| AMP PEAK 11(7Q31.2) MUTATED | 466 | 59.2 (12.7) |
| AMP PEAK 11(7Q31.2) WILD-TYPE | 104 | 51.4 (19.7) |
Figure S9. Get High-res Image Gene #11: 'amp_7q31.2' versus Clinical Feature #2: 'YEARS_TO_BIRTH'
P value = 0.00533 (Wilcoxon-test), Q value = 0.14
Table S10. Gene #19: 'amp_14q32.33' versus Clinical Feature #2: 'YEARS_TO_BIRTH'
| nPatients | Mean (Std.Dev) | |
|---|---|---|
| ALL | 570 | 57.7 (14.5) |
| AMP PEAK 19(14Q32.33) MUTATED | 36 | 63.4 (14.4) |
| AMP PEAK 19(14Q32.33) WILD-TYPE | 534 | 57.4 (14.4) |
Figure S10. Get High-res Image Gene #19: 'amp_14q32.33' versus Clinical Feature #2: 'YEARS_TO_BIRTH'
P value = 0.00839 (Wilcoxon-test), Q value = 0.19
Table S11. Gene #21: 'amp_17q25.1' versus Clinical Feature #2: 'YEARS_TO_BIRTH'
| nPatients | Mean (Std.Dev) | |
|---|---|---|
| ALL | 570 | 57.7 (14.5) |
| AMP PEAK 21(17Q25.1) MUTATED | 83 | 61.2 (13.6) |
| AMP PEAK 21(17Q25.1) WILD-TYPE | 487 | 57.1 (14.6) |
Figure S11. Get High-res Image Gene #21: 'amp_17q25.1' versus Clinical Feature #2: 'YEARS_TO_BIRTH'

P value = 0.00977 (Wilcoxon-test), Q value = 0.21
Table S12. Gene #25: 'amp_21q21.1' versus Clinical Feature #2: 'YEARS_TO_BIRTH'
| nPatients | Mean (Std.Dev) | |
|---|---|---|
| ALL | 570 | 57.7 (14.5) |
| AMP PEAK 25(21Q21.1) MUTATED | 69 | 62.0 (13.3) |
| AMP PEAK 25(21Q21.1) WILD-TYPE | 501 | 57.1 (14.6) |
Figure S12. Get High-res Image Gene #25: 'amp_21q21.1' versus Clinical Feature #2: 'YEARS_TO_BIRTH'
P value = 0.0109 (Fisher's exact test), Q value = 0.23
Table S13. Gene #27: 'del_1p36.23' versus Clinical Feature #3: 'GENDER'
| nPatients | FEMALE | MALE |
|---|---|---|
| ALL | 224 | 346 |
| DEL PEAK 2(1P36.23) MUTATED | 39 | 93 |
| DEL PEAK 2(1P36.23) WILD-TYPE | 185 | 253 |
Figure S13. Get High-res Image Gene #27: 'del_1p36.23' versus Clinical Feature #3: 'GENDER'
P value = 6.51e-05 (Wilcoxon-test), Q value = 0.0025
Table S14. Gene #44: 'del_9p21.3' versus Clinical Feature #2: 'YEARS_TO_BIRTH'
| nPatients | Mean (Std.Dev) | |
|---|---|---|
| ALL | 570 | 57.7 (14.5) |
| DEL PEAK 19(9P21.3) MUTATED | 417 | 59.1 (13.8) |
| DEL PEAK 19(9P21.3) WILD-TYPE | 153 | 53.9 (15.7) |
Figure S14. Get High-res Image Gene #44: 'del_9p21.3' versus Clinical Feature #2: 'YEARS_TO_BIRTH'
P value = 3.44e-05 (logrank test), Q value = 0.0015
Table S15. Gene #46: 'del_10p15.3' versus Clinical Feature #1: 'Time to Death'
| nPatients | nDeath | Duration Range (Median), Month | |
|---|---|---|---|
| ALL | 569 | 465 | 0.1 - 127.6 (11.8) |
| DEL PEAK 21(10P15.3) MUTATED | 462 | 386 | 0.1 - 120.6 (11.8) |
| DEL PEAK 21(10P15.3) WILD-TYPE | 107 | 79 | 0.1 - 127.6 (12.9) |
Figure S15. Get High-res Image Gene #46: 'del_10p15.3' versus Clinical Feature #1: 'Time to Death'
P value = 1.11e-08 (Wilcoxon-test), Q value = 2.1e-06
Table S16. Gene #46: 'del_10p15.3' versus Clinical Feature #2: 'YEARS_TO_BIRTH'
| nPatients | Mean (Std.Dev) | |
|---|---|---|
| ALL | 570 | 57.7 (14.5) |
| DEL PEAK 21(10P15.3) MUTATED | 463 | 59.8 (12.6) |
| DEL PEAK 21(10P15.3) WILD-TYPE | 107 | 48.8 (18.5) |
Figure S16. Get High-res Image Gene #46: 'del_10p15.3' versus Clinical Feature #2: 'YEARS_TO_BIRTH'
P value = 2.25e-05 (logrank test), Q value = 0.0011
Table S17. Gene #47: 'del_10p13' versus Clinical Feature #1: 'Time to Death'
| nPatients | nDeath | Duration Range (Median), Month | |
|---|---|---|---|
| ALL | 569 | 465 | 0.1 - 127.6 (11.8) |
| DEL PEAK 22(10P13) MUTATED | 463 | 387 | 0.1 - 120.6 (11.8) |
| DEL PEAK 22(10P13) WILD-TYPE | 106 | 78 | 0.1 - 127.6 (12.5) |
Figure S17. Get High-res Image Gene #47: 'del_10p13' versus Clinical Feature #1: 'Time to Death'

P value = 2.33e-08 (Wilcoxon-test), Q value = 3.3e-06
Table S18. Gene #47: 'del_10p13' versus Clinical Feature #2: 'YEARS_TO_BIRTH'
| nPatients | Mean (Std.Dev) | |
|---|---|---|
| ALL | 570 | 57.7 (14.5) |
| DEL PEAK 22(10P13) MUTATED | 464 | 59.8 (12.4) |
| DEL PEAK 22(10P13) WILD-TYPE | 106 | 48.8 (19.1) |
Figure S18. Get High-res Image Gene #47: 'del_10p13' versus Clinical Feature #2: 'YEARS_TO_BIRTH'
P value = 0.00824 (Fisher's exact test), Q value = 0.19
Table S19. Gene #47: 'del_10p13' versus Clinical Feature #5: 'HISTOLOGICAL_TYPE'
| nPatients | GLIOBLASTOMA MULTIFORME (GBM) | TREATED PRIMARY GBM | UNTREATED PRIMARY (DE NOVO) GBM |
|---|---|---|---|
| ALL | 27 | 18 | 525 |
| DEL PEAK 22(10P13) MUTATED | 18 | 11 | 435 |
| DEL PEAK 22(10P13) WILD-TYPE | 9 | 7 | 90 |
Figure S19. Get High-res Image Gene #47: 'del_10p13' versus Clinical Feature #5: 'HISTOLOGICAL_TYPE'
P value = 1.95e-06 (logrank test), Q value = 0.00014
Table S20. Gene #48: 'del_10p11.23' versus Clinical Feature #1: 'Time to Death'
| nPatients | nDeath | Duration Range (Median), Month | |
|---|---|---|---|
| ALL | 569 | 465 | 0.1 - 127.6 (11.8) |
| DEL PEAK 23(10P11.23) MUTATED | 468 | 391 | 0.1 - 120.6 (11.8) |
| DEL PEAK 23(10P11.23) WILD-TYPE | 101 | 74 | 0.1 - 127.6 (14.5) |
Figure S20. Get High-res Image Gene #48: 'del_10p11.23' versus Clinical Feature #1: 'Time to Death'
P value = 7.72e-11 (Wilcoxon-test), Q value = 2.2e-08
Table S21. Gene #48: 'del_10p11.23' versus Clinical Feature #2: 'YEARS_TO_BIRTH'
| nPatients | Mean (Std.Dev) | |
|---|---|---|
| ALL | 570 | 57.7 (14.5) |
| DEL PEAK 23(10P11.23) MUTATED | 469 | 60.0 (12.3) |
| DEL PEAK 23(10P11.23) WILD-TYPE | 101 | 47.3 (18.8) |
Figure S21. Get High-res Image Gene #48: 'del_10p11.23' versus Clinical Feature #2: 'YEARS_TO_BIRTH'
P value = 0.00305 (Fisher's exact test), Q value = 0.086
Table S22. Gene #48: 'del_10p11.23' versus Clinical Feature #5: 'HISTOLOGICAL_TYPE'
| nPatients | GLIOBLASTOMA MULTIFORME (GBM) | TREATED PRIMARY GBM | UNTREATED PRIMARY (DE NOVO) GBM |
|---|---|---|---|
| ALL | 27 | 18 | 525 |
| DEL PEAK 23(10P11.23) MUTATED | 19 | 10 | 440 |
| DEL PEAK 23(10P11.23) WILD-TYPE | 8 | 8 | 85 |
Figure S22. Get High-res Image Gene #48: 'del_10p11.23' versus Clinical Feature #5: 'HISTOLOGICAL_TYPE'
P value = 5.62e-05 (logrank test), Q value = 0.0023
Table S23. Gene #49: 'del_10q23.31' versus Clinical Feature #1: 'Time to Death'
| nPatients | nDeath | Duration Range (Median), Month | |
|---|---|---|---|
| ALL | 569 | 465 | 0.1 - 127.6 (11.8) |
| DEL PEAK 24(10Q23.31) MUTATED | 506 | 419 | 0.1 - 127.6 (11.8) |
| DEL PEAK 24(10Q23.31) WILD-TYPE | 63 | 46 | 0.4 - 115.9 (14.1) |
Figure S23. Get High-res Image Gene #49: 'del_10q23.31' versus Clinical Feature #1: 'Time to Death'

P value = 2.29e-07 (Wilcoxon-test), Q value = 2.2e-05
Table S24. Gene #49: 'del_10q23.31' versus Clinical Feature #2: 'YEARS_TO_BIRTH'
| nPatients | Mean (Std.Dev) | |
|---|---|---|
| ALL | 570 | 57.7 (14.5) |
| DEL PEAK 24(10Q23.31) MUTATED | 507 | 59.0 (13.4) |
| DEL PEAK 24(10Q23.31) WILD-TYPE | 63 | 47.2 (18.6) |
Figure S24. Get High-res Image Gene #49: 'del_10q23.31' versus Clinical Feature #2: 'YEARS_TO_BIRTH'
P value = 0.00316 (logrank test), Q value = 0.086
Table S25. Gene #50: 'del_10q26.3' versus Clinical Feature #1: 'Time to Death'
| nPatients | nDeath | Duration Range (Median), Month | |
|---|---|---|---|
| ALL | 569 | 465 | 0.1 - 127.6 (11.8) |
| DEL PEAK 25(10Q26.3) MUTATED | 507 | 418 | 0.1 - 127.6 (11.8) |
| DEL PEAK 25(10Q26.3) WILD-TYPE | 62 | 47 | 0.4 - 100.0 (12.8) |
Figure S25. Get High-res Image Gene #50: 'del_10q26.3' versus Clinical Feature #1: 'Time to Death'
P value = 9.13e-06 (Wilcoxon-test), Q value = 0.00052
Table S26. Gene #50: 'del_10q26.3' versus Clinical Feature #2: 'YEARS_TO_BIRTH'
| nPatients | Mean (Std.Dev) | |
|---|---|---|
| ALL | 570 | 57.7 (14.5) |
| DEL PEAK 25(10Q26.3) MUTATED | 508 | 58.9 (13.5) |
| DEL PEAK 25(10Q26.3) WILD-TYPE | 62 | 48.3 (18.7) |
Figure S26. Get High-res Image Gene #50: 'del_10q26.3' versus Clinical Feature #2: 'YEARS_TO_BIRTH'
P value = 0.00596 (Wilcoxon-test), Q value = 0.15
Table S27. Gene #51: 'del_11p15.5' versus Clinical Feature #2: 'YEARS_TO_BIRTH'
| nPatients | Mean (Std.Dev) | |
|---|---|---|
| ALL | 570 | 57.7 (14.5) |
| DEL PEAK 26(11P15.5) MUTATED | 129 | 53.9 (16.4) |
| DEL PEAK 26(11P15.5) WILD-TYPE | 441 | 58.8 (13.7) |
Figure S27. Get High-res Image Gene #51: 'del_11p15.5' versus Clinical Feature #2: 'YEARS_TO_BIRTH'
-
Copy number data file = all_lesions.txt from GISTIC pipeline
-
Processed Copy number data file = /xchip/cga/gdac-prod/tcga-gdac/jobResults/GDAC_Correlate_Genomic_Events_Preprocess/GBM-TP/15096471/transformed.cor.cli.txt
-
Clinical data file = /xchip/cga/gdac-prod/tcga-gdac/jobResults/Append_Data/GBM-TP/15078636/GBM-TP.merged_data.txt
-
Number of patients = 570
-
Number of significantly focal cnvs = 71
-
Number of selected clinical features = 8
-
Exclude genes that fewer than K tumors have mutations, K = 3
For survival clinical features, the Kaplan-Meier survival curves of tumors with and without gene mutations were plotted and the statistical significance P values were estimated by logrank test (Bland and Altman 2004) using the 'survdiff' function in R
For binary or multi-class clinical features (nominal or ordinal), two-tailed Fisher's exact tests (Fisher 1922) were used to estimate the P values using the 'fisher.test' function in R
For multiple hypothesis correction, Q value is the False Discovery Rate (FDR) analogue of the P value (Benjamini and Hochberg 1995), defined as the minimum FDR at which the test may be called significant. We used the 'Benjamini and Hochberg' method of 'p.adjust' function in R to convert P values into Q values.
In addition to the links below, the full results of the analysis summarized in this report can also be downloaded programmatically using firehose_get, or interactively from either the Broad GDAC website or TCGA Data Coordination Center Portal.