This pipeline computes the correlation between cancer subtypes identified by different molecular patterns and selected clinical features.
Testing the association between subtypes identified by 10 different clustering approaches and 8 clinical features across 592 patients, 10 significant findings detected with P value < 0.05 and Q value < 0.25.
-
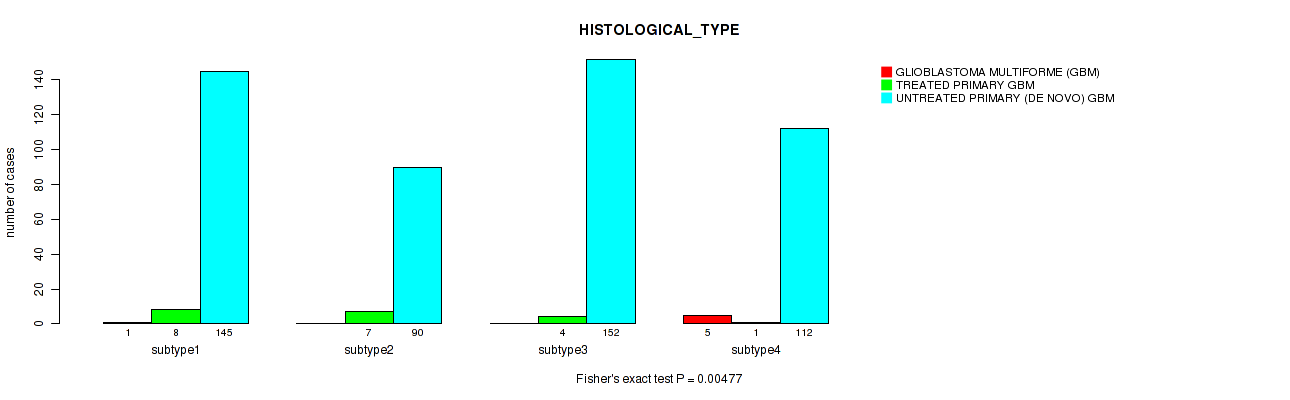
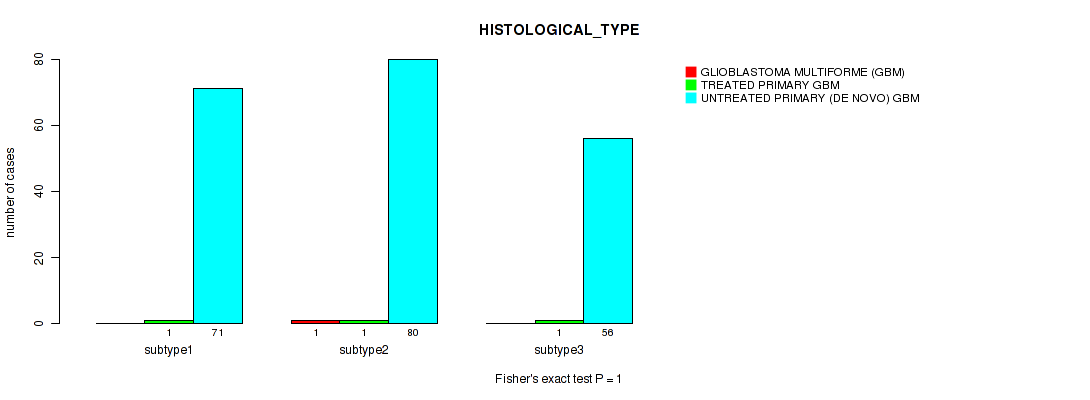
CNMF clustering analysis on array-based mRNA expression data identified 4 subtypes that correlate to 'HISTOLOGICAL_TYPE'.
-
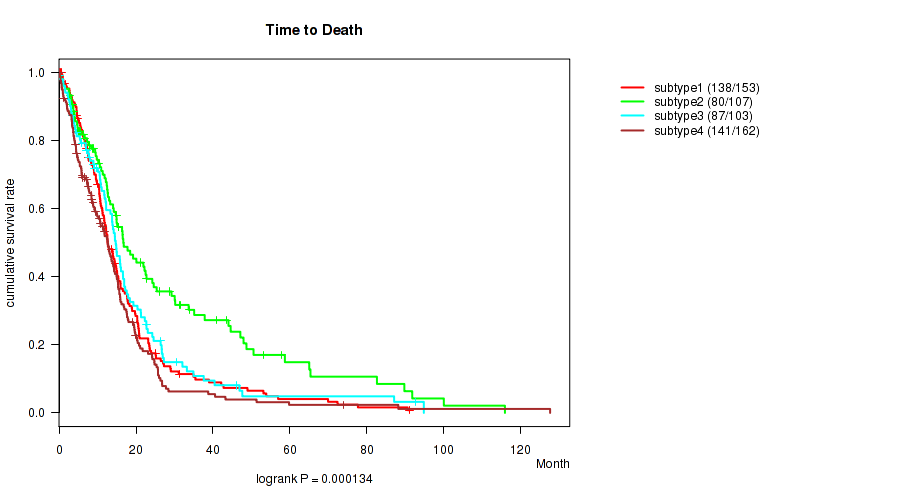
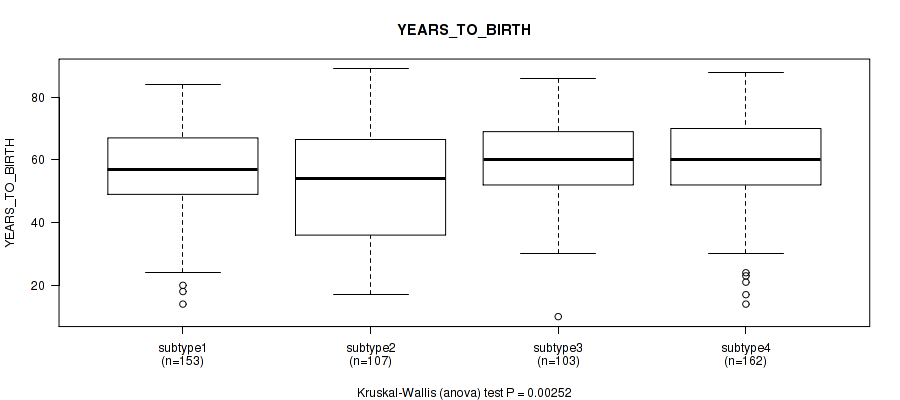
Consensus hierarchical clustering analysis on array-based mRNA expression data identified 4 subtypes that correlate to 'Time to Death', 'YEARS_TO_BIRTH', 'HISTOLOGICAL_TYPE', and 'RADIATIONS_RADIATION_REGIMENINDICATION'.
-
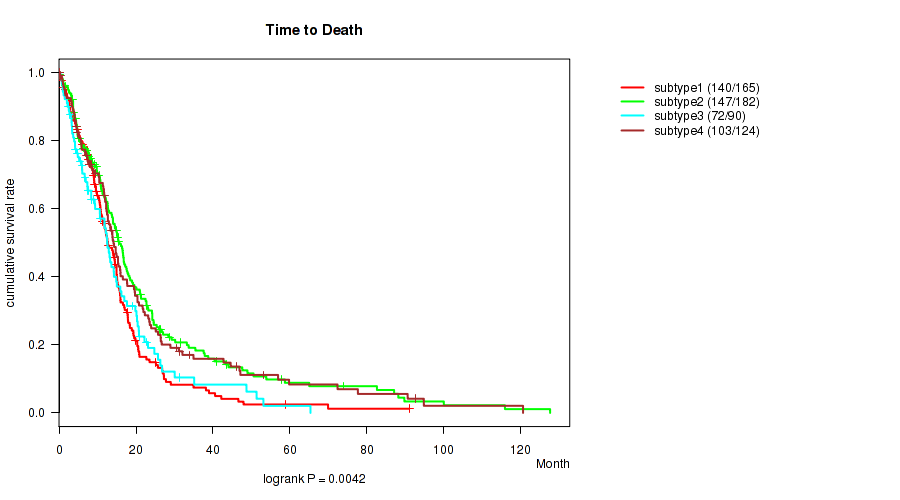
CNMF clustering analysis on array-based miR expression data identified 4 subtypes that correlate to 'Time to Death'.
-
Consensus hierarchical clustering analysis on array-based miR expression data identified 3 subtypes that do not correlate to any clinical features.
-
3 subtypes identified in current cancer cohort by 'Copy Number Ratio CNMF subtypes'. These subtypes correlate to 'YEARS_TO_BIRTH'.
-
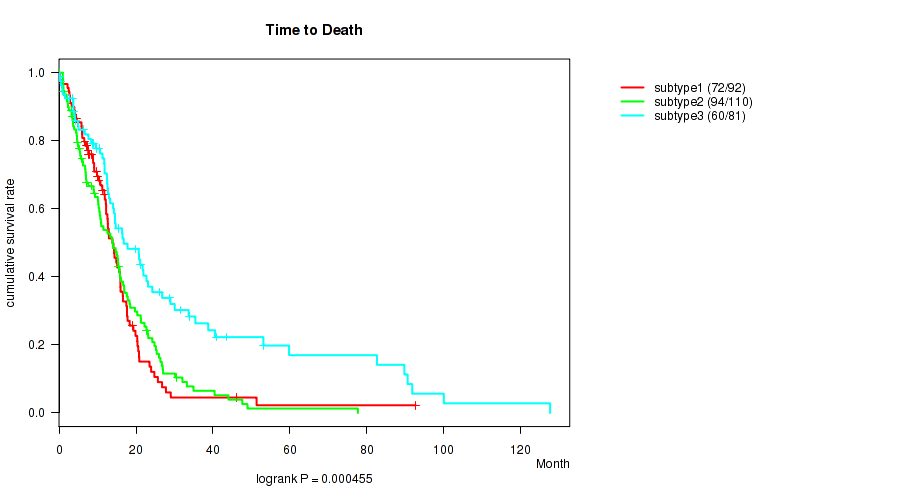
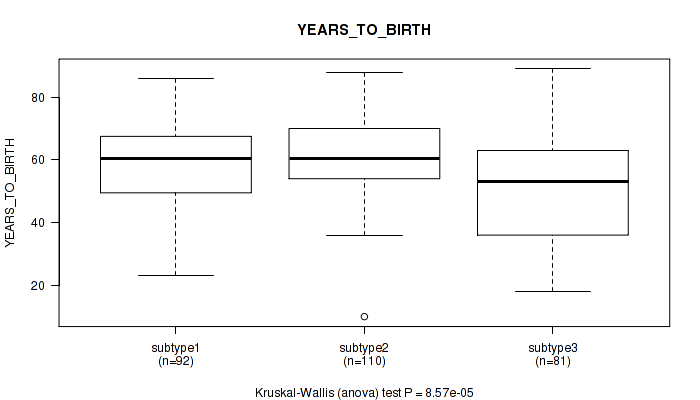
3 subtypes identified in current cancer cohort by 'METHLYATION CNMF'. These subtypes correlate to 'Time to Death' and 'YEARS_TO_BIRTH'.
-
CNMF clustering analysis on RPPA data identified 4 subtypes that do not correlate to any clinical features.
-
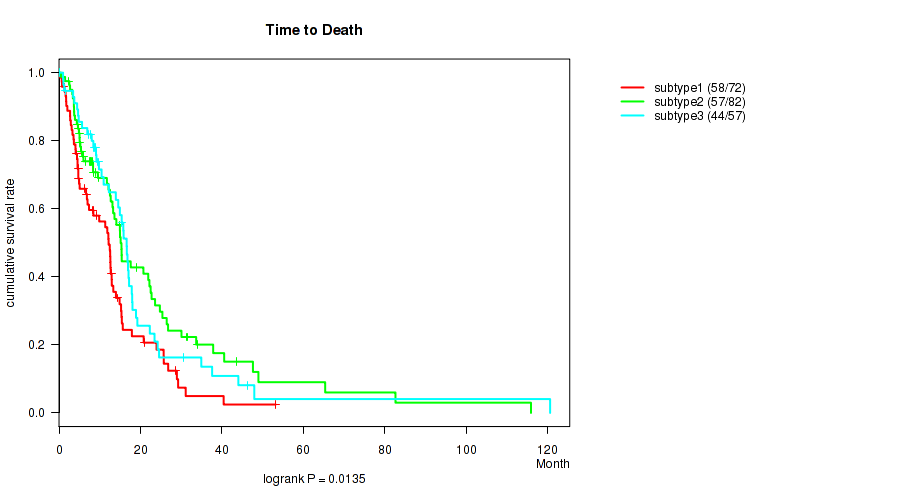
Consensus hierarchical clustering analysis on RPPA data identified 3 subtypes that correlate to 'Time to Death'.
-
CNMF clustering analysis on sequencing-based mRNA expression data identified 3 subtypes that do not correlate to any clinical features.
-
Consensus hierarchical clustering analysis on sequencing-based mRNA expression data identified 3 subtypes that do not correlate to any clinical features.
Table 1. Get Full Table Overview of the association between subtypes identified by 10 different clustering approaches and 8 clinical features. Shown in the table are P values (Q values). Thresholded by P value < 0.05 and Q value < 0.25, 10 significant findings detected.
|
Clinical Features |
Time to Death |
YEARS TO BIRTH |
GENDER |
KARNOFSKY PERFORMANCE SCORE |
HISTOLOGICAL TYPE |
RADIATIONS RADIATION REGIMENINDICATION |
RACE | ETHNICITY |
| Statistical Tests | logrank test | Kruskal-Wallis (anova) | Fisher's exact test | Kruskal-Wallis (anova) | Fisher's exact test | Fisher's exact test | Fisher's exact test | Fisher's exact test |
| mRNA CNMF subtypes |
0.0641 (0.332) |
0.0788 (0.332) |
0.4 (0.744) |
0.6 (0.818) |
0.00477 (0.0545) |
0.0679 (0.332) |
0.833 (0.93) |
0.124 (0.406) |
| mRNA cHierClus subtypes |
0.000134 (0.00357) |
0.00252 (0.0403) |
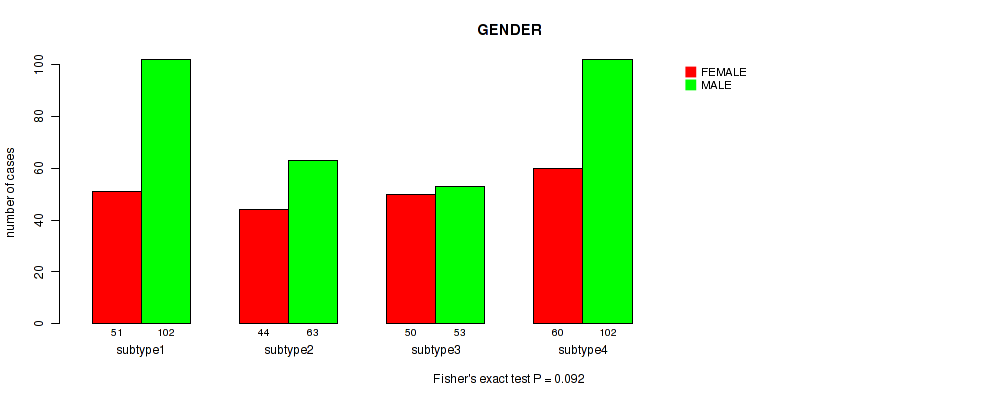
0.092 (0.367) |
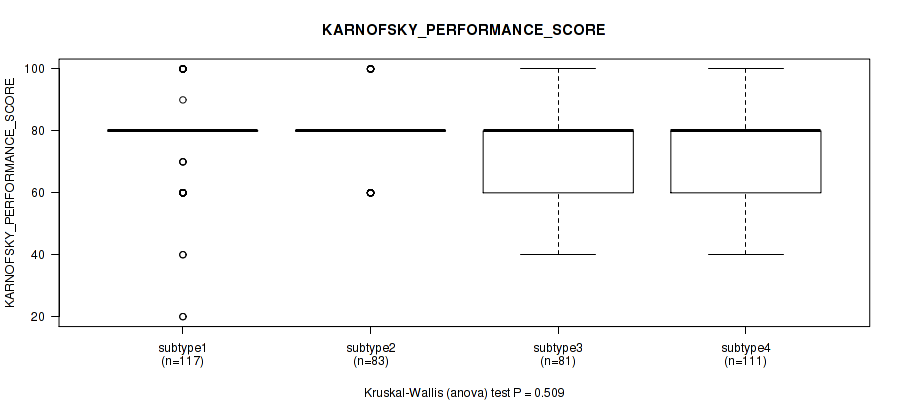
0.509 (0.814) |
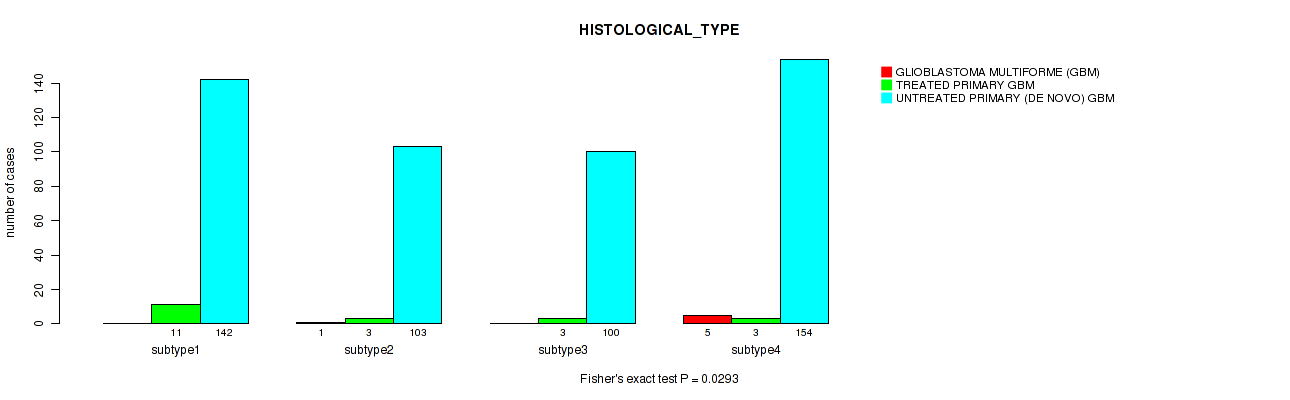
0.0293 (0.235) |
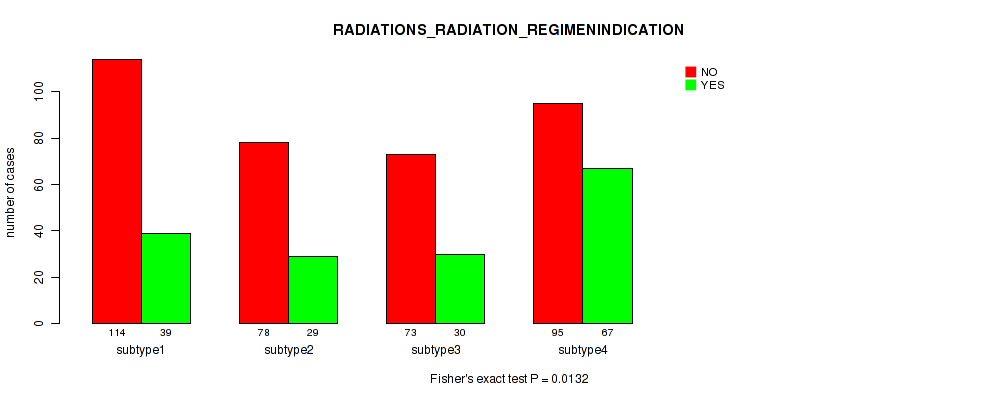
0.0132 (0.12) |
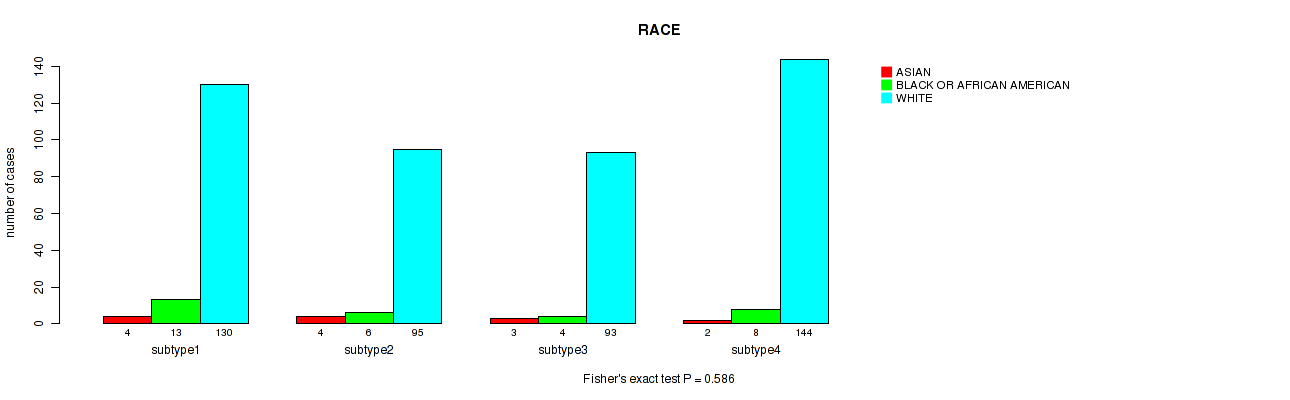
0.586 (0.818) |
0.686 (0.871) |
| miR CNMF subtypes |
0.0042 (0.0545) |
0.38 (0.724) |
0.649 (0.865) |
0.882 (0.953) |
0.365 (0.712) |
0.417 (0.758) |
0.205 (0.482) |
0.855 (0.938) |
| miR cHierClus subtypes |
0.165 (0.431) |
0.127 (0.406) |
0.153 (0.422) |
0.571 (0.818) |
0.282 (0.594) |
0.977 (1.00) |
0.191 (0.463) |
0.677 (0.871) |
| Copy Number Ratio CNMF subtypes |
0.068 (0.332) |
1.24e-05 (0.000996) |
0.463 (0.788) |
0.132 (0.406) |
0.15 (0.422) |
0.189 (0.463) |
0.124 (0.406) |
0.762 (0.904) |
| METHLYATION CNMF |
0.000455 (0.00911) |
8.57e-05 (0.00343) |
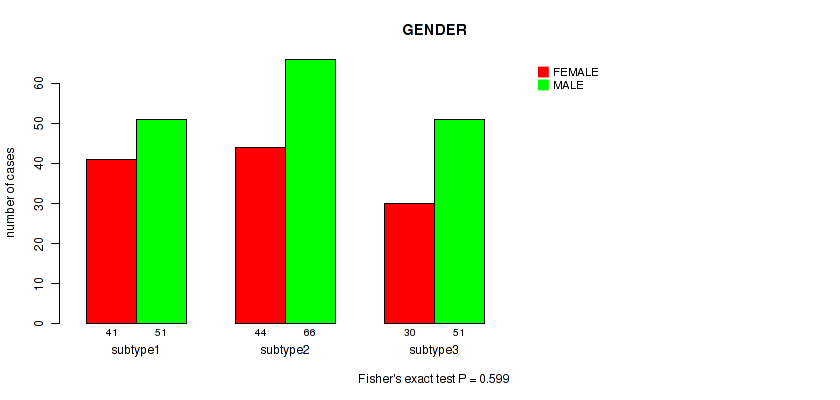
0.599 (0.818) |
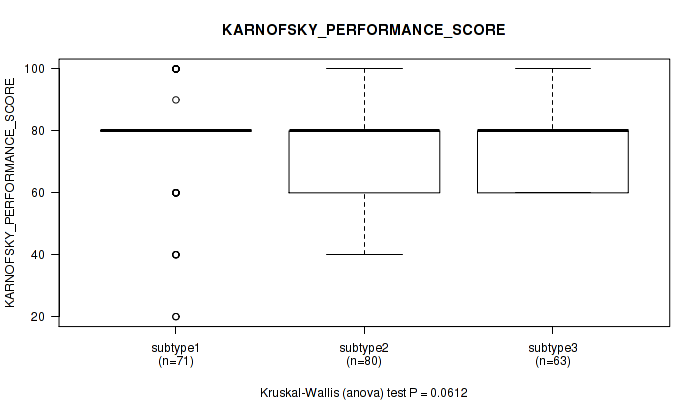
0.0612 (0.332) |
0.301 (0.605) |
0.167 (0.431) |
0.992 (1.00) |
0.894 (0.953) |
| RPPA CNMF subtypes |
0.106 (0.387) |
0.599 (0.818) |
0.232 (0.53) |
0.459 (0.788) |
0.506 (0.814) |
0.303 (0.605) |
0.704 (0.88) |
1 (1.00) |
| RPPA cHierClus subtypes |
0.0135 (0.12) |
0.28 (0.594) |
0.541 (0.818) |
0.0413 (0.301) |
1 (1.00) |
0.242 (0.537) |
0.758 (0.904) |
1 (1.00) |
| RNAseq CNMF subtypes |
0.448 (0.788) |
0.0964 (0.367) |
0.0722 (0.332) |
0.67 (0.871) |
0.786 (0.904) |
0.837 (0.93) |
0.791 (0.904) |
0.791 (0.904) |
| RNAseq cHierClus subtypes |
0.074 (0.332) |
0.0784 (0.332) |
0.143 (0.422) |
0.485 (0.808) |
0.603 (0.818) |
0.581 (0.818) |
0.578 (0.818) |
0.736 (0.904) |
Table S1. Description of clustering approach #1: 'mRNA CNMF subtypes'
| Cluster Labels | 1 | 2 | 3 | 4 |
|---|---|---|---|---|
| Number of samples | 154 | 97 | 156 | 118 |
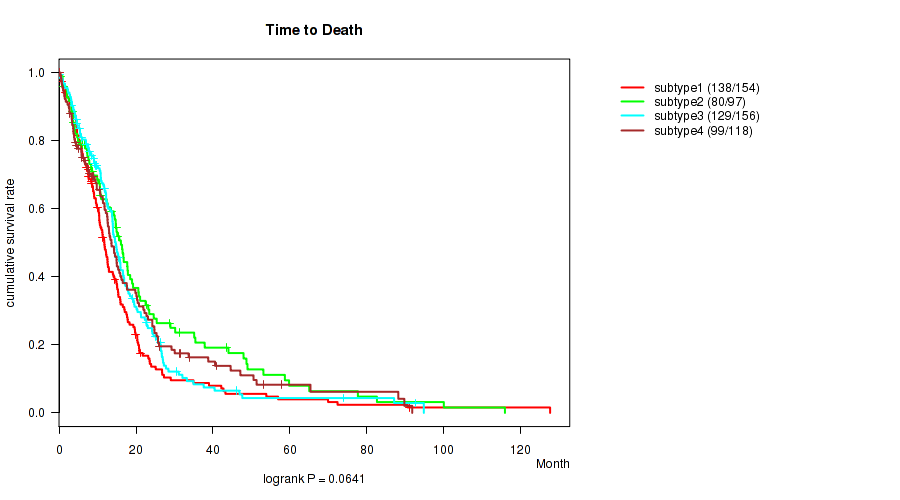
P value = 0.0641 (logrank test), Q value = 0.33
Table S2. Clustering Approach #1: 'mRNA CNMF subtypes' versus Clinical Feature #1: 'Time to Death'
| nPatients | nDeath | Duration Range (Median), Month | |
|---|---|---|---|
| ALL | 525 | 446 | 0.1 - 127.6 (12.2) |
| subtype1 | 154 | 138 | 0.1 - 127.6 (10.7) |
| subtype2 | 97 | 80 | 0.2 - 115.9 (14.2) |
| subtype3 | 156 | 129 | 0.1 - 94.8 (13.8) |
| subtype4 | 118 | 99 | 0.2 - 91.8 (12.5) |
Figure S1. Get High-res Image Clustering Approach #1: 'mRNA CNMF subtypes' versus Clinical Feature #1: 'Time to Death'
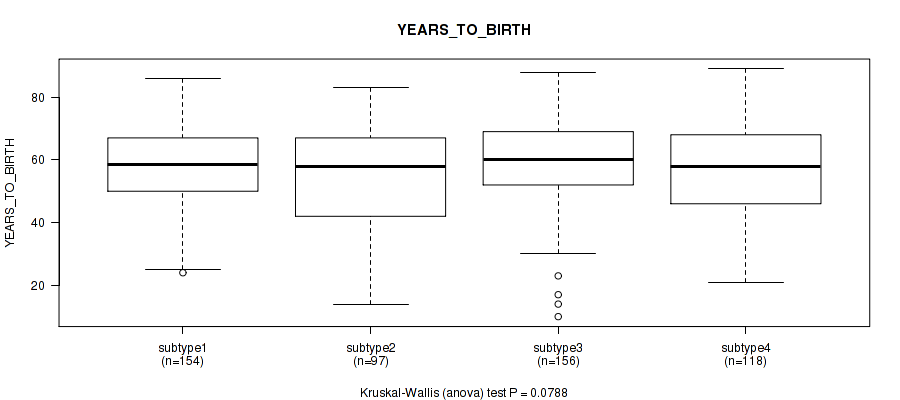
P value = 0.0788 (Kruskal-Wallis (anova)), Q value = 0.33
Table S3. Clustering Approach #1: 'mRNA CNMF subtypes' versus Clinical Feature #2: 'YEARS_TO_BIRTH'
| nPatients | Mean (Std.Dev) | |
|---|---|---|
| ALL | 525 | 57.7 (14.6) |
| subtype1 | 154 | 58.4 (12.4) |
| subtype2 | 97 | 54.2 (17.4) |
| subtype3 | 156 | 60.0 (13.3) |
| subtype4 | 118 | 56.5 (15.7) |
Figure S2. Get High-res Image Clustering Approach #1: 'mRNA CNMF subtypes' versus Clinical Feature #2: 'YEARS_TO_BIRTH'
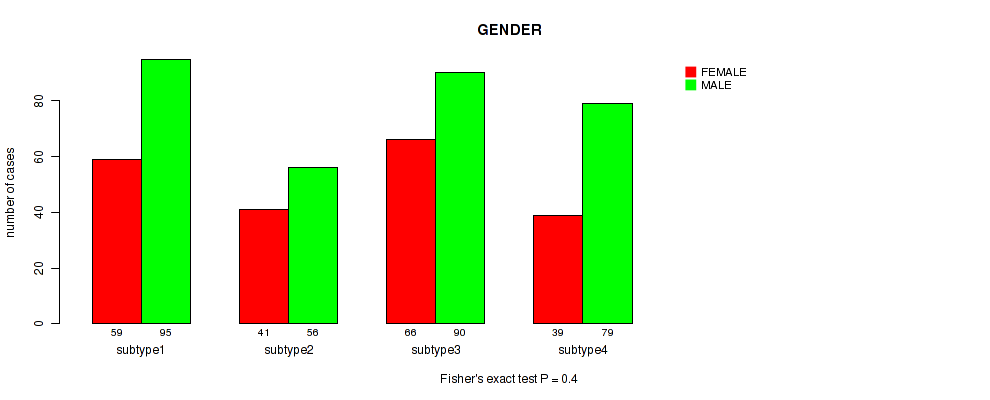
P value = 0.4 (Fisher's exact test), Q value = 0.74
Table S4. Clustering Approach #1: 'mRNA CNMF subtypes' versus Clinical Feature #3: 'GENDER'
| nPatients | FEMALE | MALE |
|---|---|---|
| ALL | 205 | 320 |
| subtype1 | 59 | 95 |
| subtype2 | 41 | 56 |
| subtype3 | 66 | 90 |
| subtype4 | 39 | 79 |
Figure S3. Get High-res Image Clustering Approach #1: 'mRNA CNMF subtypes' versus Clinical Feature #3: 'GENDER'
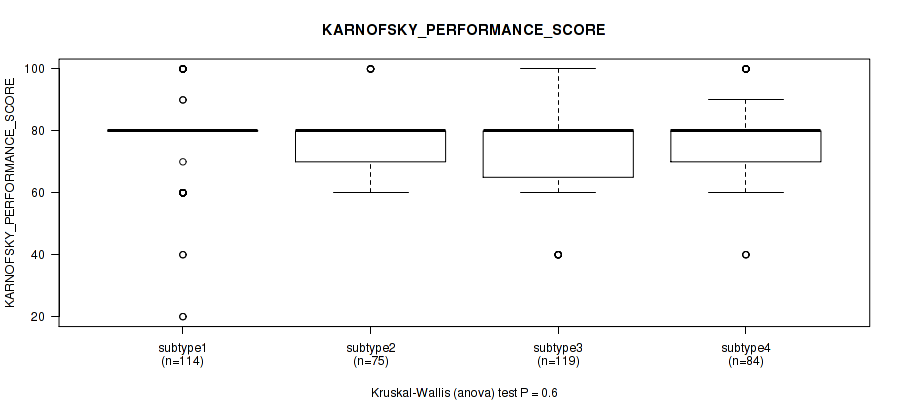
P value = 0.6 (Kruskal-Wallis (anova)), Q value = 0.82
Table S5. Clustering Approach #1: 'mRNA CNMF subtypes' versus Clinical Feature #4: 'KARNOFSKY_PERFORMANCE_SCORE'
| nPatients | Mean (Std.Dev) | |
|---|---|---|
| ALL | 392 | 77.2 (14.4) |
| subtype1 | 114 | 78.0 (15.5) |
| subtype2 | 75 | 76.5 (11.0) |
| subtype3 | 119 | 76.5 (15.2) |
| subtype4 | 84 | 77.9 (14.5) |
Figure S4. Get High-res Image Clustering Approach #1: 'mRNA CNMF subtypes' versus Clinical Feature #4: 'KARNOFSKY_PERFORMANCE_SCORE'
P value = 0.00477 (Fisher's exact test), Q value = 0.055
Table S6. Clustering Approach #1: 'mRNA CNMF subtypes' versus Clinical Feature #5: 'HISTOLOGICAL_TYPE'
| nPatients | GLIOBLASTOMA MULTIFORME (GBM) | TREATED PRIMARY GBM | UNTREATED PRIMARY (DE NOVO) GBM |
|---|---|---|---|
| ALL | 6 | 20 | 499 |
| subtype1 | 1 | 8 | 145 |
| subtype2 | 0 | 7 | 90 |
| subtype3 | 0 | 4 | 152 |
| subtype4 | 5 | 1 | 112 |
Figure S5. Get High-res Image Clustering Approach #1: 'mRNA CNMF subtypes' versus Clinical Feature #5: 'HISTOLOGICAL_TYPE'
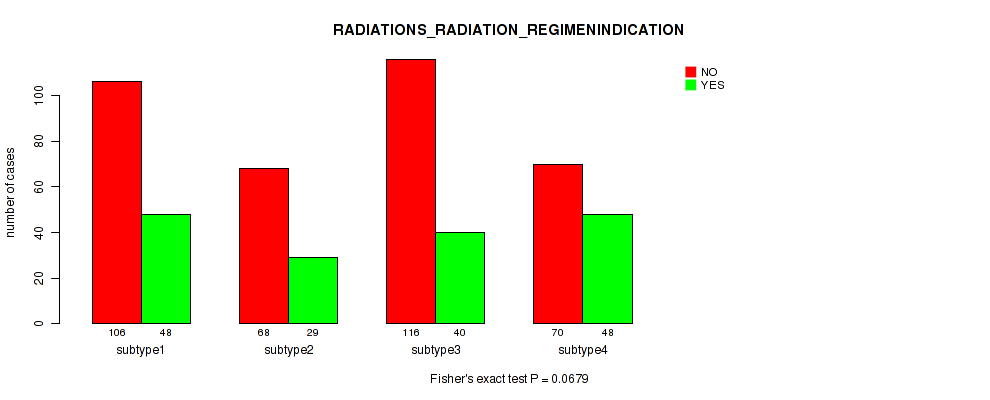
P value = 0.0679 (Fisher's exact test), Q value = 0.33
Table S7. Clustering Approach #1: 'mRNA CNMF subtypes' versus Clinical Feature #6: 'RADIATIONS_RADIATION_REGIMENINDICATION'
| nPatients | NO | YES |
|---|---|---|
| ALL | 360 | 165 |
| subtype1 | 106 | 48 |
| subtype2 | 68 | 29 |
| subtype3 | 116 | 40 |
| subtype4 | 70 | 48 |
Figure S6. Get High-res Image Clustering Approach #1: 'mRNA CNMF subtypes' versus Clinical Feature #6: 'RADIATIONS_RADIATION_REGIMENINDICATION'
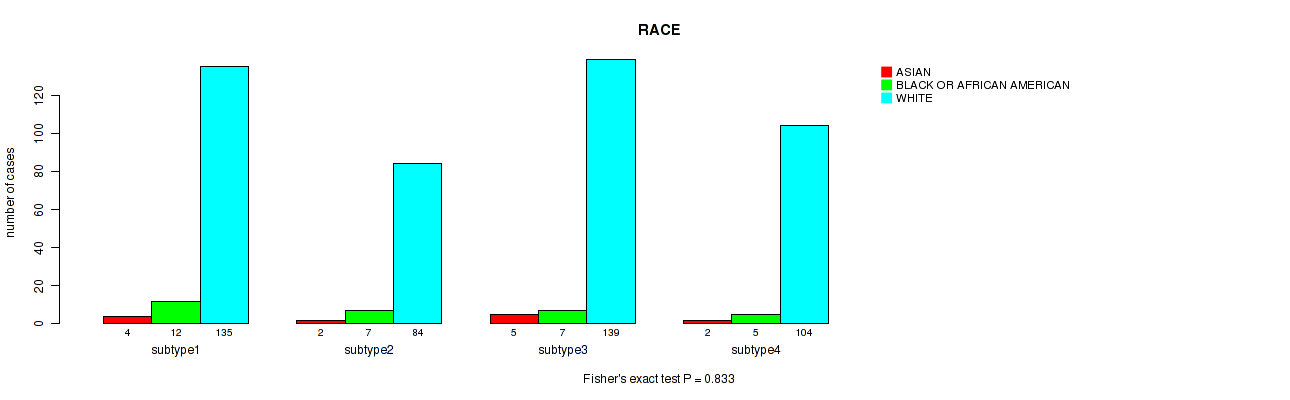
P value = 0.833 (Fisher's exact test), Q value = 0.93
Table S8. Clustering Approach #1: 'mRNA CNMF subtypes' versus Clinical Feature #7: 'RACE'
| nPatients | ASIAN | BLACK OR AFRICAN AMERICAN | WHITE |
|---|---|---|---|
| ALL | 13 | 31 | 462 |
| subtype1 | 4 | 12 | 135 |
| subtype2 | 2 | 7 | 84 |
| subtype3 | 5 | 7 | 139 |
| subtype4 | 2 | 5 | 104 |
Figure S7. Get High-res Image Clustering Approach #1: 'mRNA CNMF subtypes' versus Clinical Feature #7: 'RACE'
P value = 0.124 (Fisher's exact test), Q value = 0.41
Table S9. Clustering Approach #1: 'mRNA CNMF subtypes' versus Clinical Feature #8: 'ETHNICITY'
| nPatients | HISPANIC OR LATINO | NOT HISPANIC OR LATINO |
|---|---|---|
| ALL | 12 | 438 |
| subtype1 | 3 | 131 |
| subtype2 | 5 | 68 |
| subtype3 | 3 | 135 |
| subtype4 | 1 | 104 |
Figure S8. Get High-res Image Clustering Approach #1: 'mRNA CNMF subtypes' versus Clinical Feature #8: 'ETHNICITY'
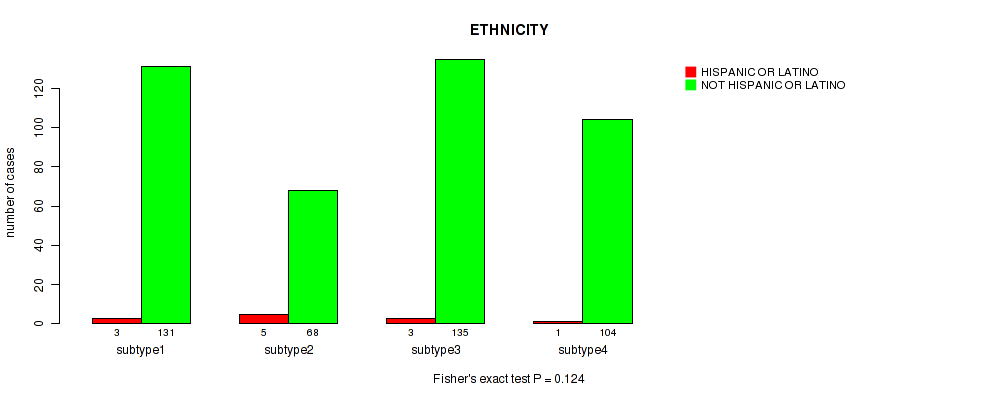
Table S10. Description of clustering approach #2: 'mRNA cHierClus subtypes'
| Cluster Labels | 1 | 2 | 3 | 4 |
|---|---|---|---|---|
| Number of samples | 153 | 107 | 103 | 162 |
P value = 0.000134 (logrank test), Q value = 0.0036
Table S11. Clustering Approach #2: 'mRNA cHierClus subtypes' versus Clinical Feature #1: 'Time to Death'
| nPatients | nDeath | Duration Range (Median), Month | |
|---|---|---|---|
| ALL | 525 | 446 | 0.1 - 127.6 (12.2) |
| subtype1 | 153 | 138 | 0.1 - 91.0 (12.2) |
| subtype2 | 107 | 80 | 0.2 - 115.9 (14.7) |
| subtype3 | 103 | 87 | 0.1 - 94.8 (13.8) |
| subtype4 | 162 | 141 | 0.1 - 127.6 (10.3) |
Figure S9. Get High-res Image Clustering Approach #2: 'mRNA cHierClus subtypes' versus Clinical Feature #1: 'Time to Death'
P value = 0.00252 (Kruskal-Wallis (anova)), Q value = 0.04
Table S12. Clustering Approach #2: 'mRNA cHierClus subtypes' versus Clinical Feature #2: 'YEARS_TO_BIRTH'
| nPatients | Mean (Std.Dev) | |
|---|---|---|
| ALL | 525 | 57.7 (14.6) |
| subtype1 | 153 | 56.9 (13.6) |
| subtype2 | 107 | 52.9 (17.9) |
| subtype3 | 103 | 60.6 (12.1) |
| subtype4 | 162 | 59.8 (13.7) |
Figure S10. Get High-res Image Clustering Approach #2: 'mRNA cHierClus subtypes' versus Clinical Feature #2: 'YEARS_TO_BIRTH'
P value = 0.092 (Fisher's exact test), Q value = 0.37
Table S13. Clustering Approach #2: 'mRNA cHierClus subtypes' versus Clinical Feature #3: 'GENDER'
| nPatients | FEMALE | MALE |
|---|---|---|
| ALL | 205 | 320 |
| subtype1 | 51 | 102 |
| subtype2 | 44 | 63 |
| subtype3 | 50 | 53 |
| subtype4 | 60 | 102 |
Figure S11. Get High-res Image Clustering Approach #2: 'mRNA cHierClus subtypes' versus Clinical Feature #3: 'GENDER'
P value = 0.509 (Kruskal-Wallis (anova)), Q value = 0.81
Table S14. Clustering Approach #2: 'mRNA cHierClus subtypes' versus Clinical Feature #4: 'KARNOFSKY_PERFORMANCE_SCORE'
| nPatients | Mean (Std.Dev) | |
|---|---|---|
| ALL | 392 | 77.2 (14.4) |
| subtype1 | 117 | 78.5 (14.9) |
| subtype2 | 83 | 77.6 (11.4) |
| subtype3 | 81 | 75.4 (15.5) |
| subtype4 | 111 | 76.9 (14.9) |
Figure S12. Get High-res Image Clustering Approach #2: 'mRNA cHierClus subtypes' versus Clinical Feature #4: 'KARNOFSKY_PERFORMANCE_SCORE'
P value = 0.0293 (Fisher's exact test), Q value = 0.23
Table S15. Clustering Approach #2: 'mRNA cHierClus subtypes' versus Clinical Feature #5: 'HISTOLOGICAL_TYPE'
| nPatients | GLIOBLASTOMA MULTIFORME (GBM) | TREATED PRIMARY GBM | UNTREATED PRIMARY (DE NOVO) GBM |
|---|---|---|---|
| ALL | 6 | 20 | 499 |
| subtype1 | 0 | 11 | 142 |
| subtype2 | 1 | 3 | 103 |
| subtype3 | 0 | 3 | 100 |
| subtype4 | 5 | 3 | 154 |
Figure S13. Get High-res Image Clustering Approach #2: 'mRNA cHierClus subtypes' versus Clinical Feature #5: 'HISTOLOGICAL_TYPE'
P value = 0.0132 (Fisher's exact test), Q value = 0.12
Table S16. Clustering Approach #2: 'mRNA cHierClus subtypes' versus Clinical Feature #6: 'RADIATIONS_RADIATION_REGIMENINDICATION'
| nPatients | NO | YES |
|---|---|---|
| ALL | 360 | 165 |
| subtype1 | 114 | 39 |
| subtype2 | 78 | 29 |
| subtype3 | 73 | 30 |
| subtype4 | 95 | 67 |
Figure S14. Get High-res Image Clustering Approach #2: 'mRNA cHierClus subtypes' versus Clinical Feature #6: 'RADIATIONS_RADIATION_REGIMENINDICATION'
P value = 0.586 (Fisher's exact test), Q value = 0.82
Table S17. Clustering Approach #2: 'mRNA cHierClus subtypes' versus Clinical Feature #7: 'RACE'
| nPatients | ASIAN | BLACK OR AFRICAN AMERICAN | WHITE |
|---|---|---|---|
| ALL | 13 | 31 | 462 |
| subtype1 | 4 | 13 | 130 |
| subtype2 | 4 | 6 | 95 |
| subtype3 | 3 | 4 | 93 |
| subtype4 | 2 | 8 | 144 |
Figure S15. Get High-res Image Clustering Approach #2: 'mRNA cHierClus subtypes' versus Clinical Feature #7: 'RACE'
P value = 0.686 (Fisher's exact test), Q value = 0.87
Table S18. Clustering Approach #2: 'mRNA cHierClus subtypes' versus Clinical Feature #8: 'ETHNICITY'
| nPatients | HISPANIC OR LATINO | NOT HISPANIC OR LATINO |
|---|---|---|
| ALL | 12 | 438 |
| subtype1 | 5 | 124 |
| subtype2 | 1 | 91 |
| subtype3 | 2 | 90 |
| subtype4 | 4 | 133 |
Figure S16. Get High-res Image Clustering Approach #2: 'mRNA cHierClus subtypes' versus Clinical Feature #8: 'ETHNICITY'
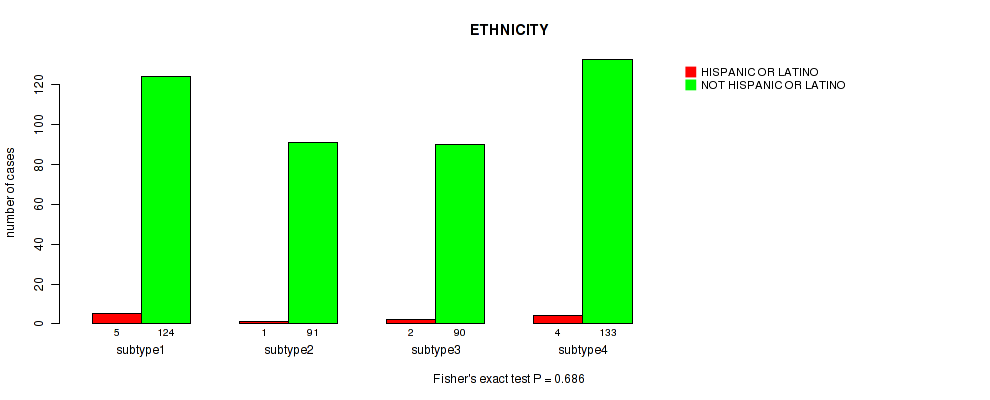
Table S19. Description of clustering approach #3: 'miR CNMF subtypes'
| Cluster Labels | 1 | 2 | 3 | 4 |
|---|---|---|---|---|
| Number of samples | 165 | 182 | 90 | 124 |
P value = 0.0042 (logrank test), Q value = 0.055
Table S20. Clustering Approach #3: 'miR CNMF subtypes' versus Clinical Feature #1: 'Time to Death'
| nPatients | nDeath | Duration Range (Median), Month | |
|---|---|---|---|
| ALL | 561 | 462 | 0.1 - 127.6 (11.9) |
| subtype1 | 165 | 140 | 0.1 - 91.0 (11.3) |
| subtype2 | 182 | 147 | 0.1 - 127.6 (13.3) |
| subtype3 | 90 | 72 | 0.4 - 65.3 (9.1) |
| subtype4 | 124 | 103 | 0.1 - 120.6 (12.6) |
Figure S17. Get High-res Image Clustering Approach #3: 'miR CNMF subtypes' versus Clinical Feature #1: 'Time to Death'
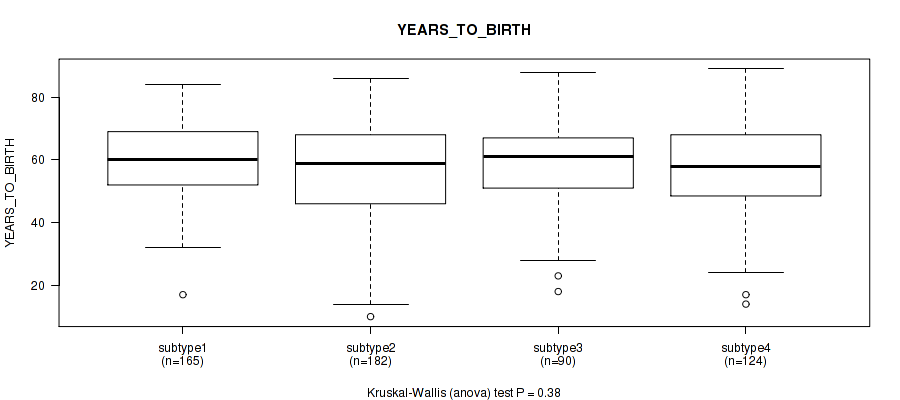
P value = 0.38 (Kruskal-Wallis (anova)), Q value = 0.72
Table S21. Clustering Approach #3: 'miR CNMF subtypes' versus Clinical Feature #2: 'YEARS_TO_BIRTH'
| nPatients | Mean (Std.Dev) | |
|---|---|---|
| ALL | 561 | 57.9 (14.3) |
| subtype1 | 165 | 59.8 (11.6) |
| subtype2 | 182 | 55.7 (16.6) |
| subtype3 | 90 | 58.5 (14.6) |
| subtype4 | 124 | 58.1 (13.6) |
Figure S18. Get High-res Image Clustering Approach #3: 'miR CNMF subtypes' versus Clinical Feature #2: 'YEARS_TO_BIRTH'
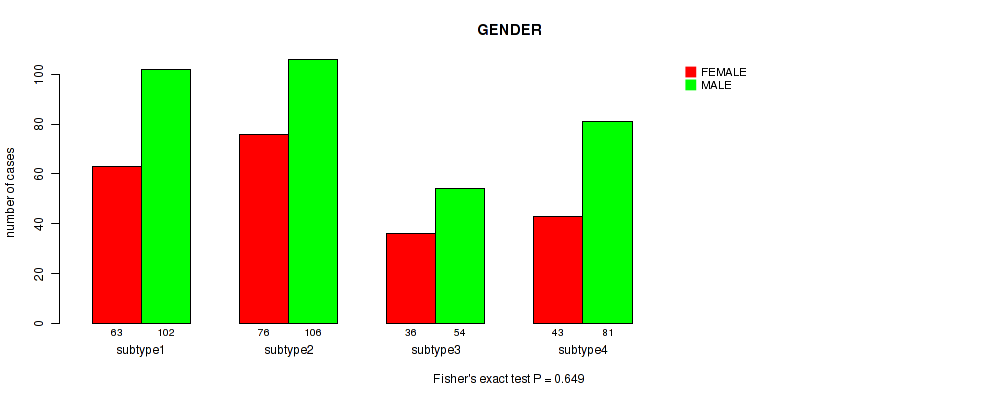
P value = 0.649 (Fisher's exact test), Q value = 0.87
Table S22. Clustering Approach #3: 'miR CNMF subtypes' versus Clinical Feature #3: 'GENDER'
| nPatients | FEMALE | MALE |
|---|---|---|
| ALL | 218 | 343 |
| subtype1 | 63 | 102 |
| subtype2 | 76 | 106 |
| subtype3 | 36 | 54 |
| subtype4 | 43 | 81 |
Figure S19. Get High-res Image Clustering Approach #3: 'miR CNMF subtypes' versus Clinical Feature #3: 'GENDER'
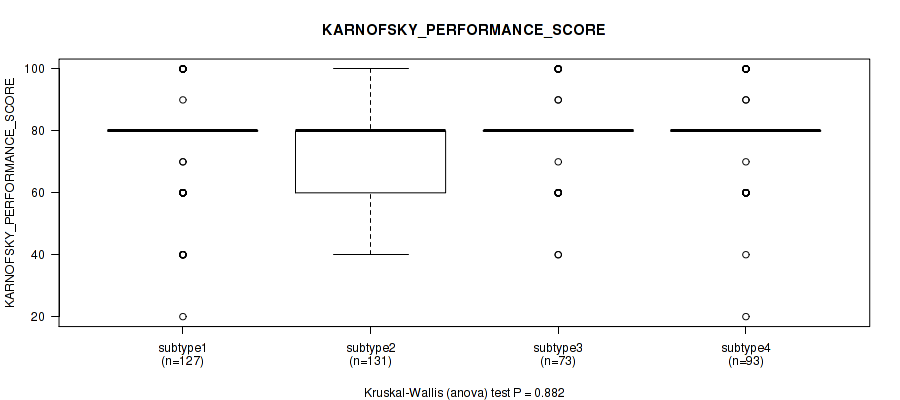
P value = 0.882 (Kruskal-Wallis (anova)), Q value = 0.95
Table S23. Clustering Approach #3: 'miR CNMF subtypes' versus Clinical Feature #4: 'KARNOFSKY_PERFORMANCE_SCORE'
| nPatients | Mean (Std.Dev) | |
|---|---|---|
| ALL | 424 | 77.5 (14.5) |
| subtype1 | 127 | 76.6 (15.3) |
| subtype2 | 131 | 77.3 (14.6) |
| subtype3 | 73 | 78.2 (13.6) |
| subtype4 | 93 | 78.4 (14.2) |
Figure S20. Get High-res Image Clustering Approach #3: 'miR CNMF subtypes' versus Clinical Feature #4: 'KARNOFSKY_PERFORMANCE_SCORE'
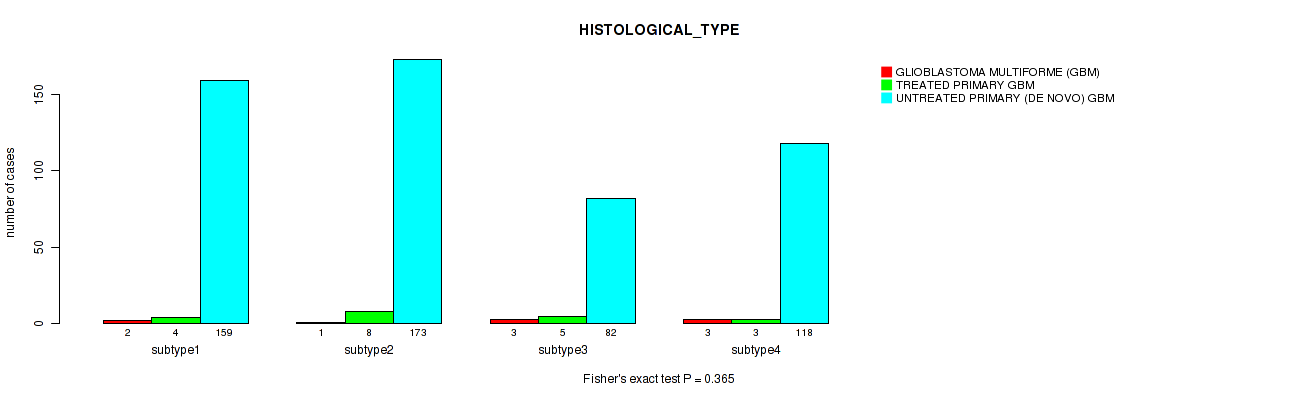
P value = 0.365 (Fisher's exact test), Q value = 0.71
Table S24. Clustering Approach #3: 'miR CNMF subtypes' versus Clinical Feature #5: 'HISTOLOGICAL_TYPE'
| nPatients | GLIOBLASTOMA MULTIFORME (GBM) | TREATED PRIMARY GBM | UNTREATED PRIMARY (DE NOVO) GBM |
|---|---|---|---|
| ALL | 9 | 20 | 532 |
| subtype1 | 2 | 4 | 159 |
| subtype2 | 1 | 8 | 173 |
| subtype3 | 3 | 5 | 82 |
| subtype4 | 3 | 3 | 118 |
Figure S21. Get High-res Image Clustering Approach #3: 'miR CNMF subtypes' versus Clinical Feature #5: 'HISTOLOGICAL_TYPE'
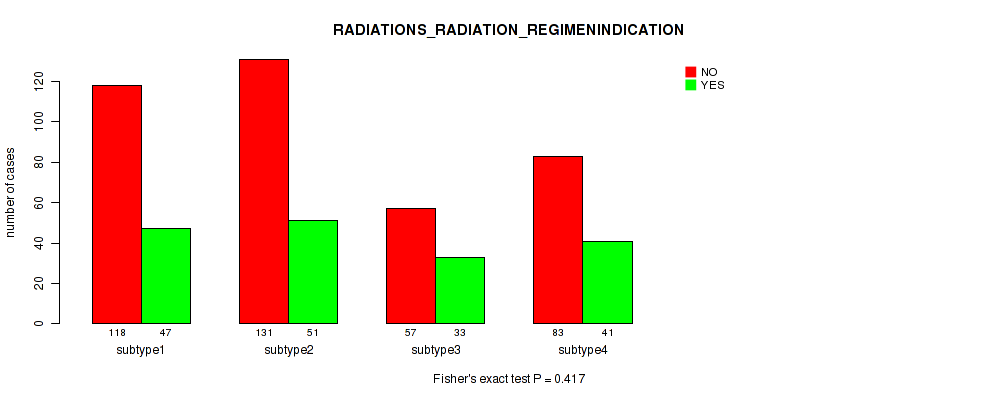
P value = 0.417 (Fisher's exact test), Q value = 0.76
Table S25. Clustering Approach #3: 'miR CNMF subtypes' versus Clinical Feature #6: 'RADIATIONS_RADIATION_REGIMENINDICATION'
| nPatients | NO | YES |
|---|---|---|
| ALL | 389 | 172 |
| subtype1 | 118 | 47 |
| subtype2 | 131 | 51 |
| subtype3 | 57 | 33 |
| subtype4 | 83 | 41 |
Figure S22. Get High-res Image Clustering Approach #3: 'miR CNMF subtypes' versus Clinical Feature #6: 'RADIATIONS_RADIATION_REGIMENINDICATION'
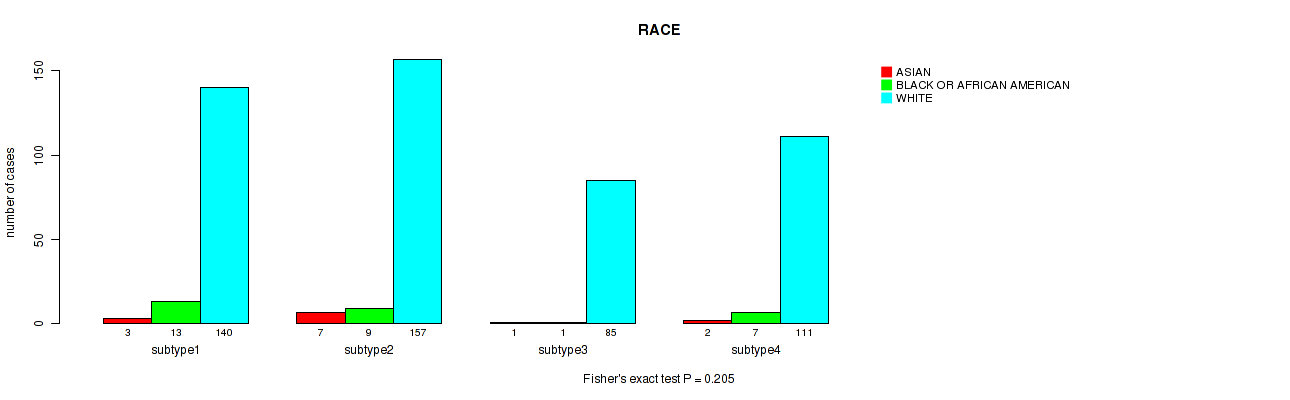
P value = 0.205 (Fisher's exact test), Q value = 0.48
Table S26. Clustering Approach #3: 'miR CNMF subtypes' versus Clinical Feature #7: 'RACE'
| nPatients | ASIAN | BLACK OR AFRICAN AMERICAN | WHITE |
|---|---|---|---|
| ALL | 13 | 30 | 493 |
| subtype1 | 3 | 13 | 140 |
| subtype2 | 7 | 9 | 157 |
| subtype3 | 1 | 1 | 85 |
| subtype4 | 2 | 7 | 111 |
Figure S23. Get High-res Image Clustering Approach #3: 'miR CNMF subtypes' versus Clinical Feature #7: 'RACE'
P value = 0.855 (Fisher's exact test), Q value = 0.94
Table S27. Clustering Approach #3: 'miR CNMF subtypes' versus Clinical Feature #8: 'ETHNICITY'
| nPatients | HISPANIC OR LATINO | NOT HISPANIC OR LATINO |
|---|---|---|
| ALL | 12 | 459 |
| subtype1 | 5 | 134 |
| subtype2 | 4 | 153 |
| subtype3 | 1 | 71 |
| subtype4 | 2 | 101 |
Figure S24. Get High-res Image Clustering Approach #3: 'miR CNMF subtypes' versus Clinical Feature #8: 'ETHNICITY'
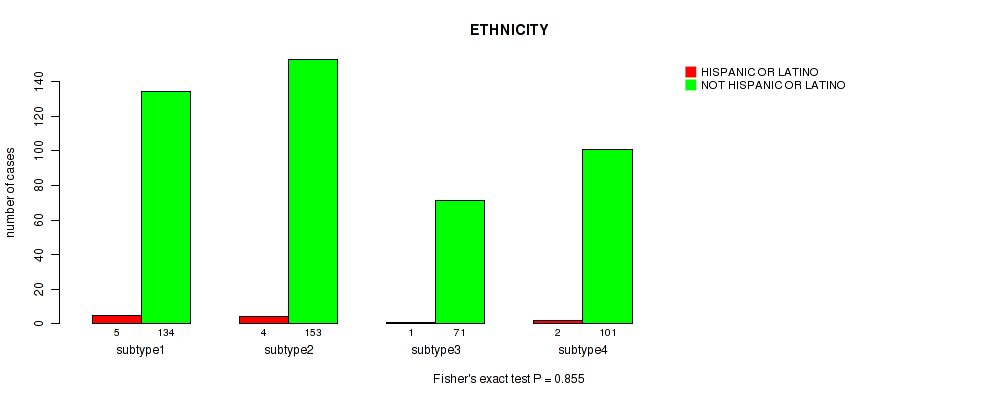
Table S28. Description of clustering approach #4: 'miR cHierClus subtypes'
| Cluster Labels | 1 | 2 | 3 |
|---|---|---|---|
| Number of samples | 302 | 129 | 130 |
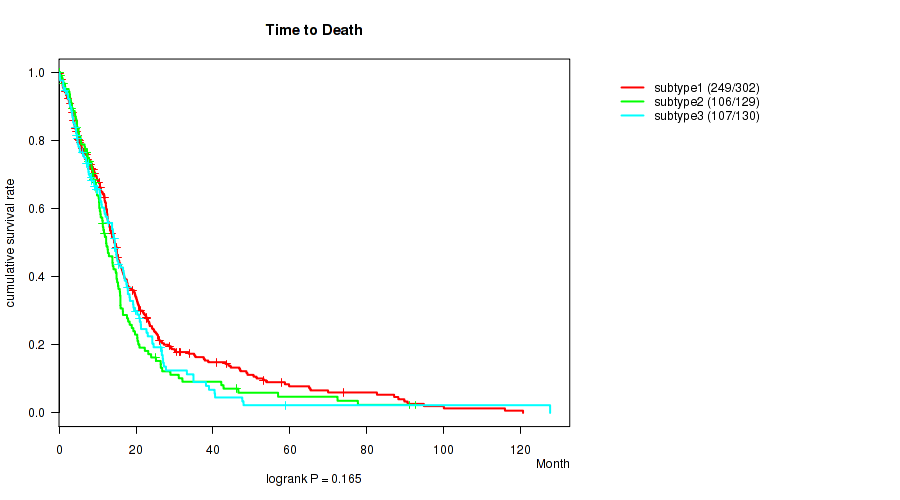
P value = 0.165 (logrank test), Q value = 0.43
Table S29. Clustering Approach #4: 'miR cHierClus subtypes' versus Clinical Feature #1: 'Time to Death'
| nPatients | nDeath | Duration Range (Median), Month | |
|---|---|---|---|
| ALL | 561 | 462 | 0.1 - 127.6 (11.9) |
| subtype1 | 302 | 249 | 0.1 - 120.6 (12.5) |
| subtype2 | 129 | 106 | 0.1 - 92.7 (10.6) |
| subtype3 | 130 | 107 | 0.1 - 127.6 (12.0) |
Figure S25. Get High-res Image Clustering Approach #4: 'miR cHierClus subtypes' versus Clinical Feature #1: 'Time to Death'
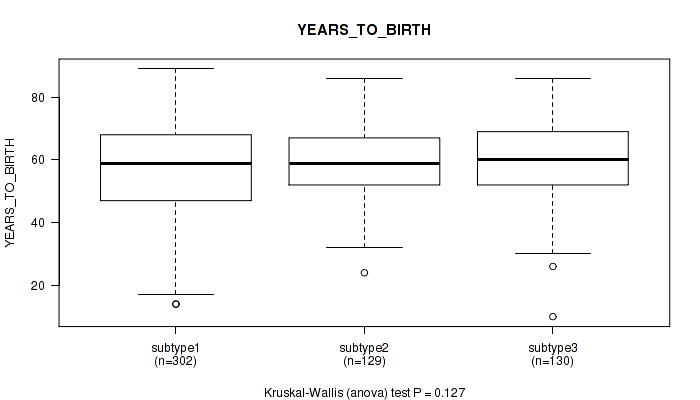
P value = 0.127 (Kruskal-Wallis (anova)), Q value = 0.41
Table S30. Clustering Approach #4: 'miR cHierClus subtypes' versus Clinical Feature #2: 'YEARS_TO_BIRTH'
| nPatients | Mean (Std.Dev) | |
|---|---|---|
| ALL | 561 | 57.9 (14.3) |
| subtype1 | 302 | 56.5 (15.9) |
| subtype2 | 129 | 59.0 (11.5) |
| subtype3 | 130 | 60.0 (12.5) |
Figure S26. Get High-res Image Clustering Approach #4: 'miR cHierClus subtypes' versus Clinical Feature #2: 'YEARS_TO_BIRTH'
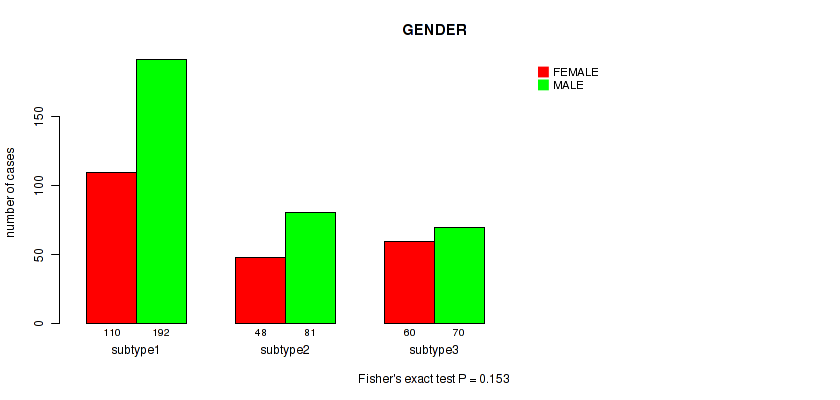
P value = 0.153 (Fisher's exact test), Q value = 0.42
Table S31. Clustering Approach #4: 'miR cHierClus subtypes' versus Clinical Feature #3: 'GENDER'
| nPatients | FEMALE | MALE |
|---|---|---|
| ALL | 218 | 343 |
| subtype1 | 110 | 192 |
| subtype2 | 48 | 81 |
| subtype3 | 60 | 70 |
Figure S27. Get High-res Image Clustering Approach #4: 'miR cHierClus subtypes' versus Clinical Feature #3: 'GENDER'
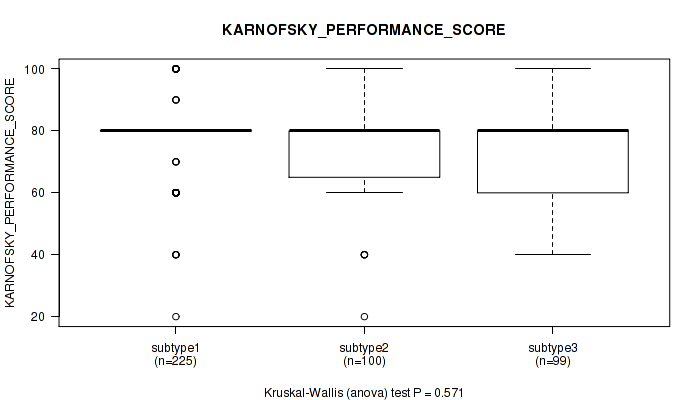
P value = 0.571 (Kruskal-Wallis (anova)), Q value = 0.82
Table S32. Clustering Approach #4: 'miR cHierClus subtypes' versus Clinical Feature #4: 'KARNOFSKY_PERFORMANCE_SCORE'
| nPatients | Mean (Std.Dev) | |
|---|---|---|
| ALL | 424 | 77.5 (14.5) |
| subtype1 | 225 | 78.4 (13.6) |
| subtype2 | 100 | 76.9 (15.4) |
| subtype3 | 99 | 76.0 (15.6) |
Figure S28. Get High-res Image Clustering Approach #4: 'miR cHierClus subtypes' versus Clinical Feature #4: 'KARNOFSKY_PERFORMANCE_SCORE'
P value = 0.282 (Fisher's exact test), Q value = 0.59
Table S33. Clustering Approach #4: 'miR cHierClus subtypes' versus Clinical Feature #5: 'HISTOLOGICAL_TYPE'
| nPatients | GLIOBLASTOMA MULTIFORME (GBM) | TREATED PRIMARY GBM | UNTREATED PRIMARY (DE NOVO) GBM |
|---|---|---|---|
| ALL | 9 | 20 | 532 |
| subtype1 | 6 | 13 | 283 |
| subtype2 | 3 | 2 | 124 |
| subtype3 | 0 | 5 | 125 |
Figure S29. Get High-res Image Clustering Approach #4: 'miR cHierClus subtypes' versus Clinical Feature #5: 'HISTOLOGICAL_TYPE'
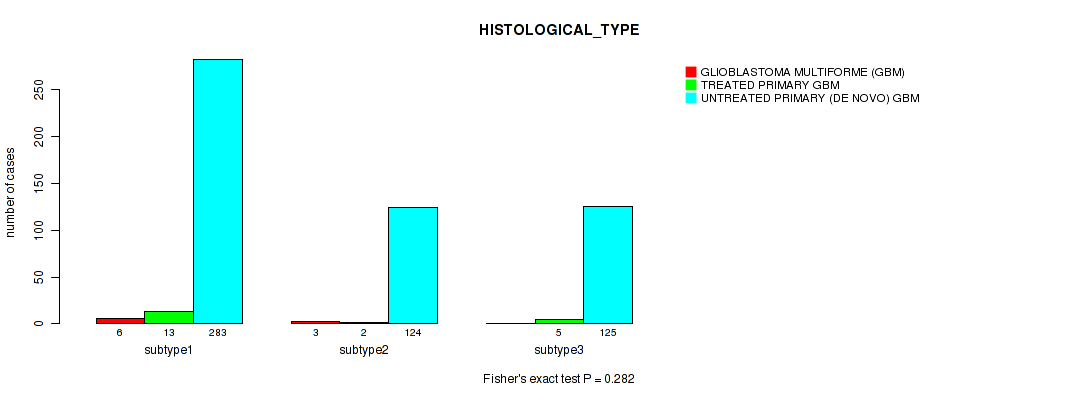
P value = 0.977 (Fisher's exact test), Q value = 1
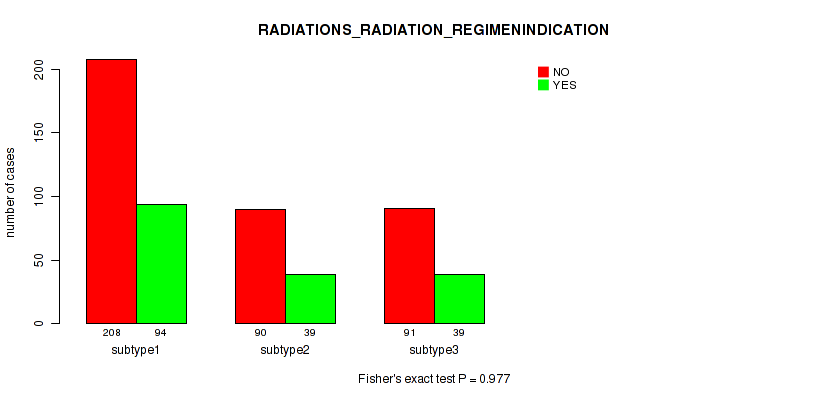
Table S34. Clustering Approach #4: 'miR cHierClus subtypes' versus Clinical Feature #6: 'RADIATIONS_RADIATION_REGIMENINDICATION'
| nPatients | NO | YES |
|---|---|---|
| ALL | 389 | 172 |
| subtype1 | 208 | 94 |
| subtype2 | 90 | 39 |
| subtype3 | 91 | 39 |
Figure S30. Get High-res Image Clustering Approach #4: 'miR cHierClus subtypes' versus Clinical Feature #6: 'RADIATIONS_RADIATION_REGIMENINDICATION'
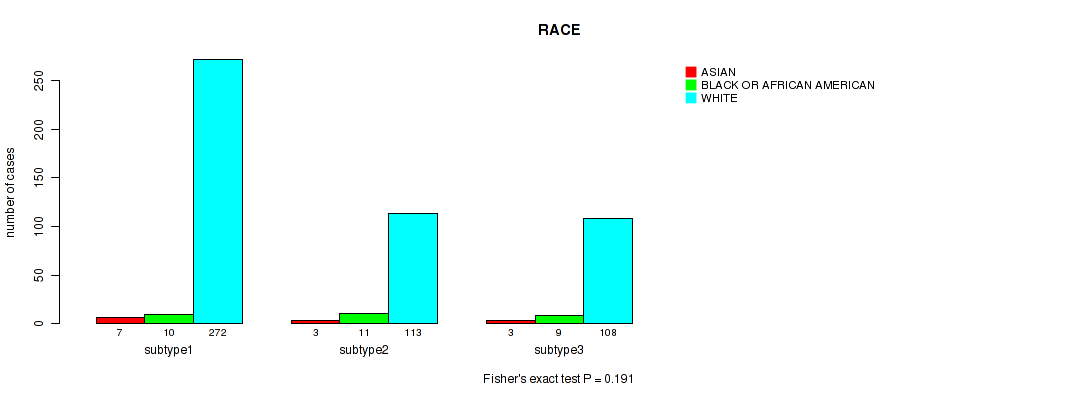
P value = 0.191 (Fisher's exact test), Q value = 0.46
Table S35. Clustering Approach #4: 'miR cHierClus subtypes' versus Clinical Feature #7: 'RACE'
| nPatients | ASIAN | BLACK OR AFRICAN AMERICAN | WHITE |
|---|---|---|---|
| ALL | 13 | 30 | 493 |
| subtype1 | 7 | 10 | 272 |
| subtype2 | 3 | 11 | 113 |
| subtype3 | 3 | 9 | 108 |
Figure S31. Get High-res Image Clustering Approach #4: 'miR cHierClus subtypes' versus Clinical Feature #7: 'RACE'
P value = 0.677 (Fisher's exact test), Q value = 0.87
Table S36. Clustering Approach #4: 'miR cHierClus subtypes' versus Clinical Feature #8: 'ETHNICITY'
| nPatients | HISPANIC OR LATINO | NOT HISPANIC OR LATINO |
|---|---|---|
| ALL | 12 | 459 |
| subtype1 | 6 | 249 |
| subtype2 | 2 | 109 |
| subtype3 | 4 | 101 |
Figure S32. Get High-res Image Clustering Approach #4: 'miR cHierClus subtypes' versus Clinical Feature #8: 'ETHNICITY'
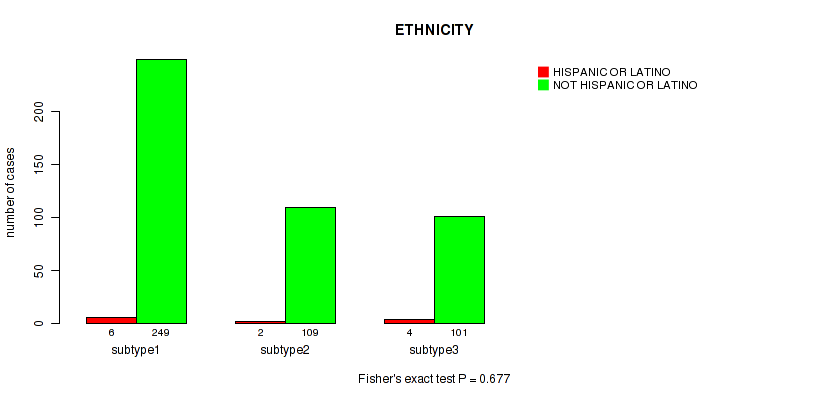
Table S37. Description of clustering approach #5: 'Copy Number Ratio CNMF subtypes'
| Cluster Labels | 1 | 2 | 3 |
|---|---|---|---|
| Number of samples | 160 | 217 | 193 |
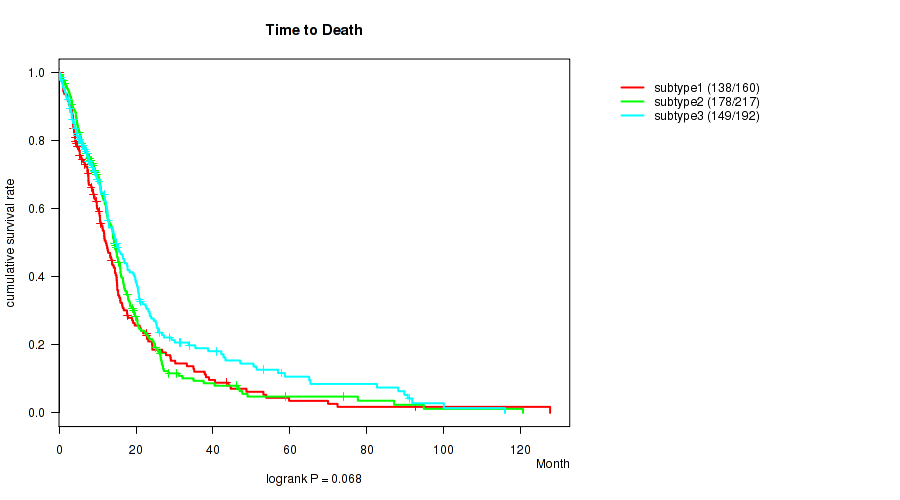
P value = 0.068 (logrank test), Q value = 0.33
Table S38. Clustering Approach #5: 'Copy Number Ratio CNMF subtypes' versus Clinical Feature #1: 'Time to Death'
| nPatients | nDeath | Duration Range (Median), Month | |
|---|---|---|---|
| ALL | 569 | 465 | 0.1 - 127.6 (11.8) |
| subtype1 | 160 | 138 | 0.1 - 127.6 (10.6) |
| subtype2 | 217 | 178 | 0.1 - 120.6 (12.6) |
| subtype3 | 192 | 149 | 0.2 - 115.9 (12.2) |
Figure S33. Get High-res Image Clustering Approach #5: 'Copy Number Ratio CNMF subtypes' versus Clinical Feature #1: 'Time to Death'
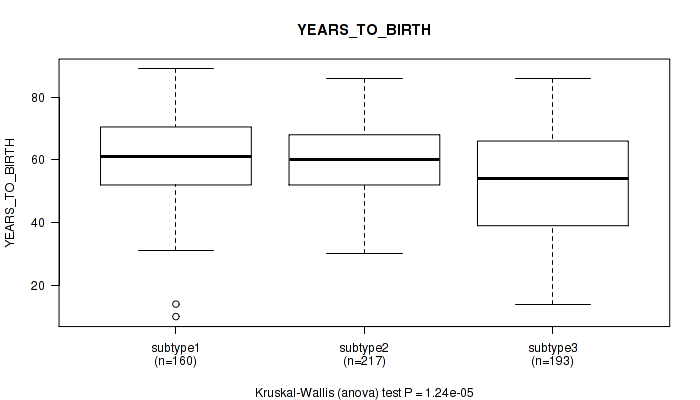
P value = 1.24e-05 (Kruskal-Wallis (anova)), Q value = 0.001
Table S39. Clustering Approach #5: 'Copy Number Ratio CNMF subtypes' versus Clinical Feature #2: 'YEARS_TO_BIRTH'
| nPatients | Mean (Std.Dev) | |
|---|---|---|
| ALL | 570 | 57.7 (14.5) |
| subtype1 | 160 | 60.5 (13.5) |
| subtype2 | 217 | 60.1 (10.7) |
| subtype3 | 193 | 52.9 (17.5) |
Figure S34. Get High-res Image Clustering Approach #5: 'Copy Number Ratio CNMF subtypes' versus Clinical Feature #2: 'YEARS_TO_BIRTH'
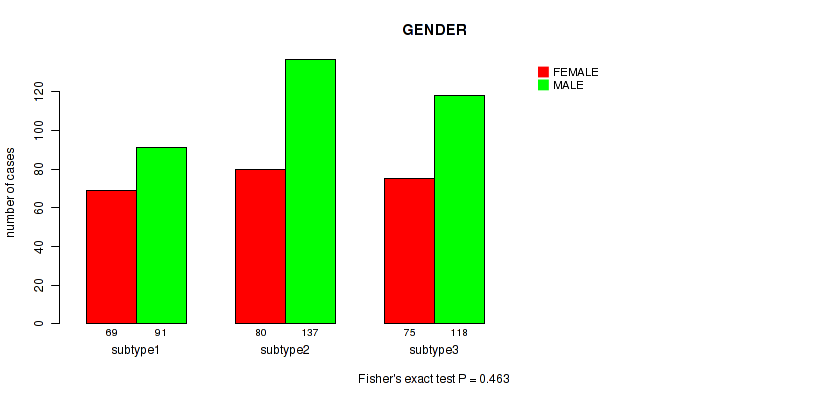
P value = 0.463 (Fisher's exact test), Q value = 0.79
Table S40. Clustering Approach #5: 'Copy Number Ratio CNMF subtypes' versus Clinical Feature #3: 'GENDER'
| nPatients | FEMALE | MALE |
|---|---|---|
| ALL | 224 | 346 |
| subtype1 | 69 | 91 |
| subtype2 | 80 | 137 |
| subtype3 | 75 | 118 |
Figure S35. Get High-res Image Clustering Approach #5: 'Copy Number Ratio CNMF subtypes' versus Clinical Feature #3: 'GENDER'
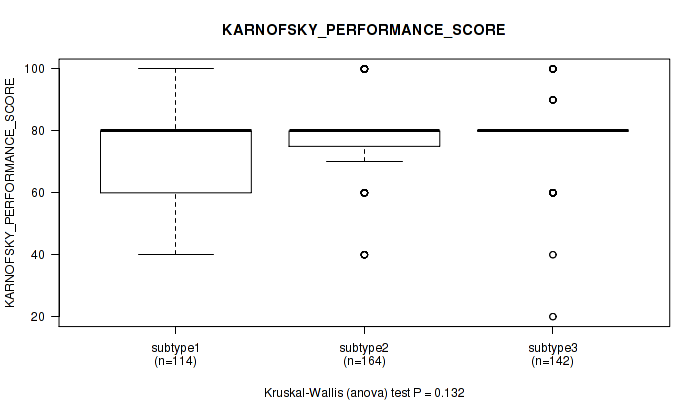
P value = 0.132 (Kruskal-Wallis (anova)), Q value = 0.41
Table S41. Clustering Approach #5: 'Copy Number Ratio CNMF subtypes' versus Clinical Feature #4: 'KARNOFSKY_PERFORMANCE_SCORE'
| nPatients | Mean (Std.Dev) | |
|---|---|---|
| ALL | 420 | 77.5 (14.7) |
| subtype1 | 114 | 75.8 (14.4) |
| subtype2 | 164 | 77.8 (15.4) |
| subtype3 | 142 | 78.7 (14.1) |
Figure S36. Get High-res Image Clustering Approach #5: 'Copy Number Ratio CNMF subtypes' versus Clinical Feature #4: 'KARNOFSKY_PERFORMANCE_SCORE'
P value = 0.15 (Fisher's exact test), Q value = 0.42
Table S42. Clustering Approach #5: 'Copy Number Ratio CNMF subtypes' versus Clinical Feature #5: 'HISTOLOGICAL_TYPE'
| nPatients | GLIOBLASTOMA MULTIFORME (GBM) | TREATED PRIMARY GBM | UNTREATED PRIMARY (DE NOVO) GBM |
|---|---|---|---|
| ALL | 27 | 18 | 525 |
| subtype1 | 4 | 4 | 152 |
| subtype2 | 9 | 5 | 203 |
| subtype3 | 14 | 9 | 170 |
Figure S37. Get High-res Image Clustering Approach #5: 'Copy Number Ratio CNMF subtypes' versus Clinical Feature #5: 'HISTOLOGICAL_TYPE'
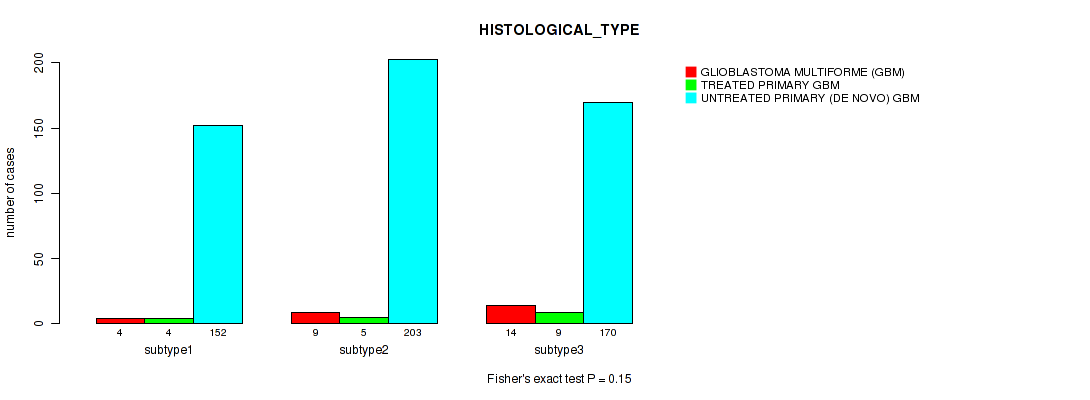
P value = 0.189 (Fisher's exact test), Q value = 0.46
Table S43. Clustering Approach #5: 'Copy Number Ratio CNMF subtypes' versus Clinical Feature #6: 'RADIATIONS_RADIATION_REGIMENINDICATION'
| nPatients | NO | YES |
|---|---|---|
| ALL | 382 | 188 |
| subtype1 | 98 | 62 |
| subtype2 | 150 | 67 |
| subtype3 | 134 | 59 |
Figure S38. Get High-res Image Clustering Approach #5: 'Copy Number Ratio CNMF subtypes' versus Clinical Feature #6: 'RADIATIONS_RADIATION_REGIMENINDICATION'
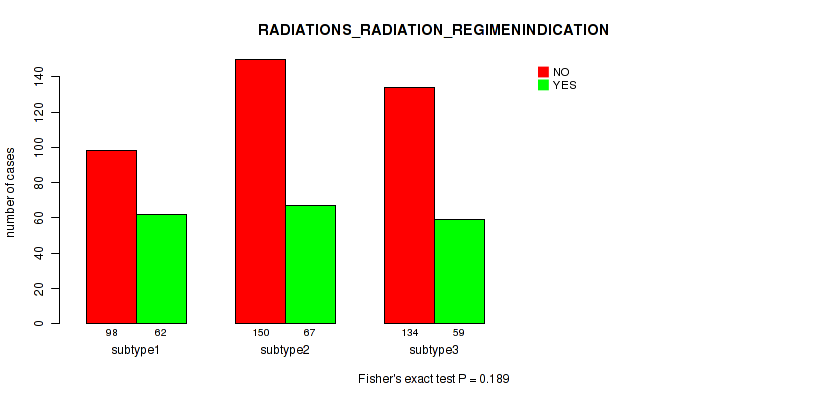
P value = 0.124 (Fisher's exact test), Q value = 0.41
Table S44. Clustering Approach #5: 'Copy Number Ratio CNMF subtypes' versus Clinical Feature #7: 'RACE'
| nPatients | ASIAN | BLACK OR AFRICAN AMERICAN | WHITE |
|---|---|---|---|
| ALL | 13 | 49 | 485 |
| subtype1 | 1 | 14 | 139 |
| subtype2 | 3 | 17 | 188 |
| subtype3 | 9 | 18 | 158 |
Figure S39. Get High-res Image Clustering Approach #5: 'Copy Number Ratio CNMF subtypes' versus Clinical Feature #7: 'RACE'
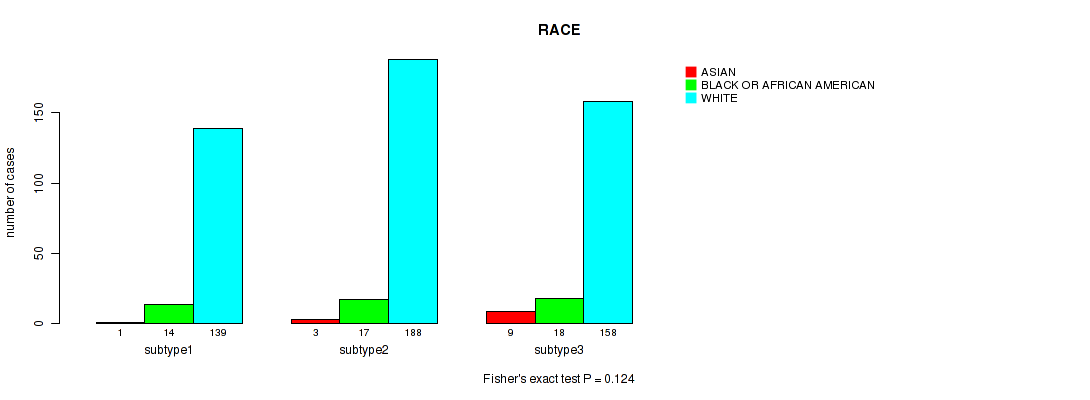
P value = 0.762 (Fisher's exact test), Q value = 0.9
Table S45. Clustering Approach #5: 'Copy Number Ratio CNMF subtypes' versus Clinical Feature #8: 'ETHNICITY'
| nPatients | HISPANIC OR LATINO | NOT HISPANIC OR LATINO |
|---|---|---|
| ALL | 12 | 472 |
| subtype1 | 2 | 133 |
| subtype2 | 5 | 176 |
| subtype3 | 5 | 163 |
Figure S40. Get High-res Image Clustering Approach #5: 'Copy Number Ratio CNMF subtypes' versus Clinical Feature #8: 'ETHNICITY'
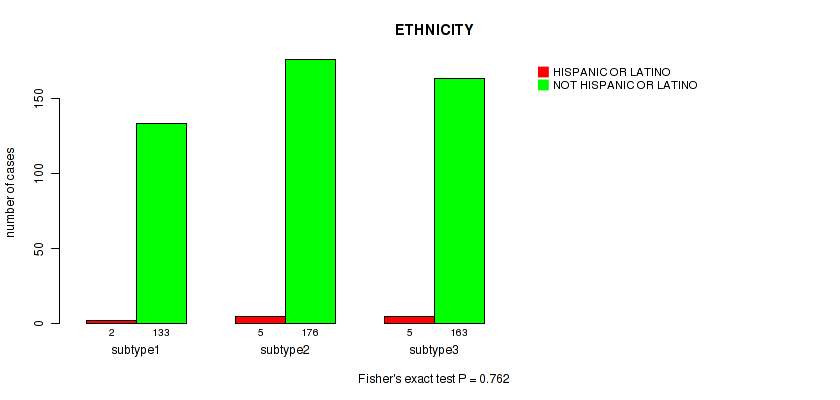
Table S46. Description of clustering approach #6: 'METHLYATION CNMF'
| Cluster Labels | 1 | 2 | 3 |
|---|---|---|---|
| Number of samples | 92 | 110 | 81 |
P value = 0.000455 (logrank test), Q value = 0.0091
Table S47. Clustering Approach #6: 'METHLYATION CNMF' versus Clinical Feature #1: 'Time to Death'
| nPatients | nDeath | Duration Range (Median), Month | |
|---|---|---|---|
| ALL | 283 | 226 | 0.1 - 127.6 (12.2) |
| subtype1 | 92 | 72 | 0.1 - 92.7 (11.8) |
| subtype2 | 110 | 94 | 0.1 - 77.7 (10.5) |
| subtype3 | 81 | 60 | 0.2 - 127.6 (14.3) |
Figure S41. Get High-res Image Clustering Approach #6: 'METHLYATION CNMF' versus Clinical Feature #1: 'Time to Death'
P value = 8.57e-05 (Kruskal-Wallis (anova)), Q value = 0.0034
Table S48. Clustering Approach #6: 'METHLYATION CNMF' versus Clinical Feature #2: 'YEARS_TO_BIRTH'
| nPatients | Mean (Std.Dev) | |
|---|---|---|
| ALL | 283 | 57.8 (15.0) |
| subtype1 | 92 | 59.0 (12.9) |
| subtype2 | 110 | 61.8 (12.6) |
| subtype3 | 81 | 51.1 (17.8) |
Figure S42. Get High-res Image Clustering Approach #6: 'METHLYATION CNMF' versus Clinical Feature #2: 'YEARS_TO_BIRTH'
P value = 0.599 (Fisher's exact test), Q value = 0.82
Table S49. Clustering Approach #6: 'METHLYATION CNMF' versus Clinical Feature #3: 'GENDER'
| nPatients | FEMALE | MALE |
|---|---|---|
| ALL | 115 | 168 |
| subtype1 | 41 | 51 |
| subtype2 | 44 | 66 |
| subtype3 | 30 | 51 |
Figure S43. Get High-res Image Clustering Approach #6: 'METHLYATION CNMF' versus Clinical Feature #3: 'GENDER'
P value = 0.0612 (Kruskal-Wallis (anova)), Q value = 0.33
Table S50. Clustering Approach #6: 'METHLYATION CNMF' versus Clinical Feature #4: 'KARNOFSKY_PERFORMANCE_SCORE'
| nPatients | Mean (Std.Dev) | |
|---|---|---|
| ALL | 214 | 75.4 (15.0) |
| subtype1 | 71 | 76.8 (17.0) |
| subtype2 | 80 | 73.0 (14.6) |
| subtype3 | 63 | 77.0 (12.7) |
Figure S44. Get High-res Image Clustering Approach #6: 'METHLYATION CNMF' versus Clinical Feature #4: 'KARNOFSKY_PERFORMANCE_SCORE'
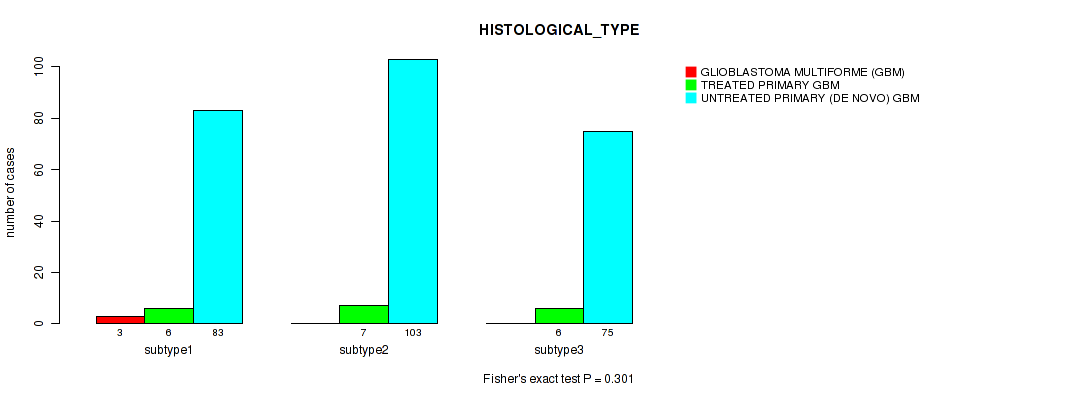
P value = 0.301 (Fisher's exact test), Q value = 0.61
Table S51. Clustering Approach #6: 'METHLYATION CNMF' versus Clinical Feature #5: 'HISTOLOGICAL_TYPE'
| nPatients | GLIOBLASTOMA MULTIFORME (GBM) | TREATED PRIMARY GBM | UNTREATED PRIMARY (DE NOVO) GBM |
|---|---|---|---|
| ALL | 3 | 19 | 261 |
| subtype1 | 3 | 6 | 83 |
| subtype2 | 0 | 7 | 103 |
| subtype3 | 0 | 6 | 75 |
Figure S45. Get High-res Image Clustering Approach #6: 'METHLYATION CNMF' versus Clinical Feature #5: 'HISTOLOGICAL_TYPE'
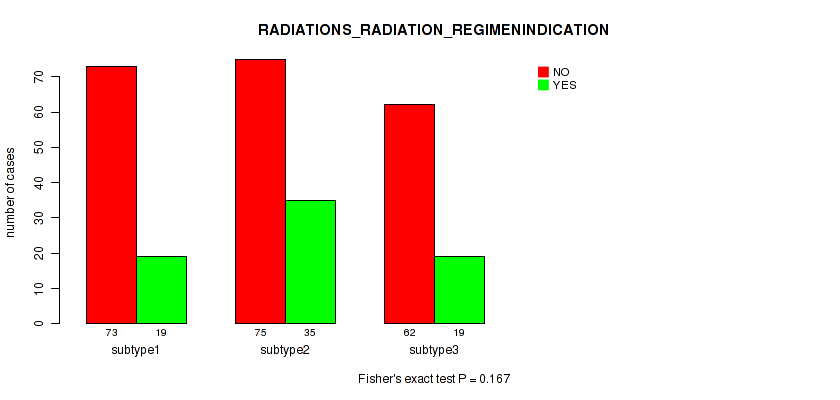
P value = 0.167 (Fisher's exact test), Q value = 0.43
Table S52. Clustering Approach #6: 'METHLYATION CNMF' versus Clinical Feature #6: 'RADIATIONS_RADIATION_REGIMENINDICATION'
| nPatients | NO | YES |
|---|---|---|
| ALL | 210 | 73 |
| subtype1 | 73 | 19 |
| subtype2 | 75 | 35 |
| subtype3 | 62 | 19 |
Figure S46. Get High-res Image Clustering Approach #6: 'METHLYATION CNMF' versus Clinical Feature #6: 'RADIATIONS_RADIATION_REGIMENINDICATION'
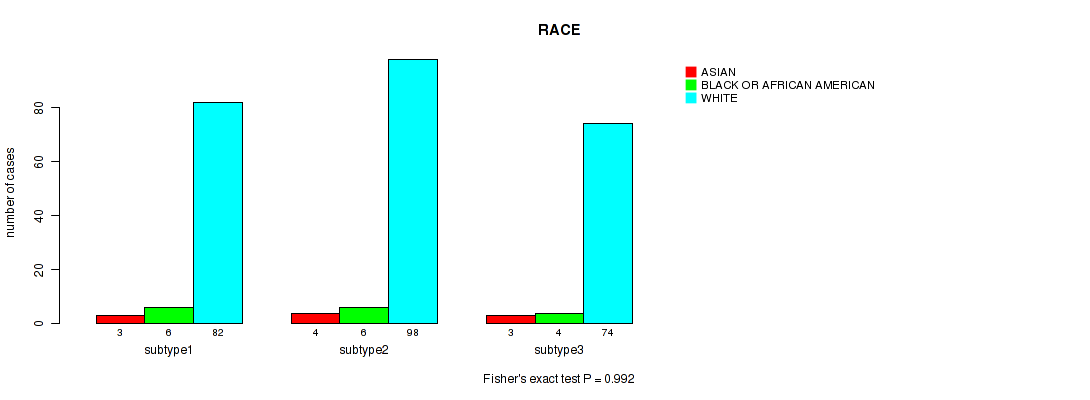
P value = 0.992 (Fisher's exact test), Q value = 1
Table S53. Clustering Approach #6: 'METHLYATION CNMF' versus Clinical Feature #7: 'RACE'
| nPatients | ASIAN | BLACK OR AFRICAN AMERICAN | WHITE |
|---|---|---|---|
| ALL | 10 | 16 | 254 |
| subtype1 | 3 | 6 | 82 |
| subtype2 | 4 | 6 | 98 |
| subtype3 | 3 | 4 | 74 |
Figure S47. Get High-res Image Clustering Approach #6: 'METHLYATION CNMF' versus Clinical Feature #7: 'RACE'
P value = 0.894 (Fisher's exact test), Q value = 0.95
Table S54. Clustering Approach #6: 'METHLYATION CNMF' versus Clinical Feature #8: 'ETHNICITY'
| nPatients | HISPANIC OR LATINO | NOT HISPANIC OR LATINO |
|---|---|---|
| ALL | 7 | 232 |
| subtype1 | 3 | 80 |
| subtype2 | 2 | 88 |
| subtype3 | 2 | 64 |
Figure S48. Get High-res Image Clustering Approach #6: 'METHLYATION CNMF' versus Clinical Feature #8: 'ETHNICITY'
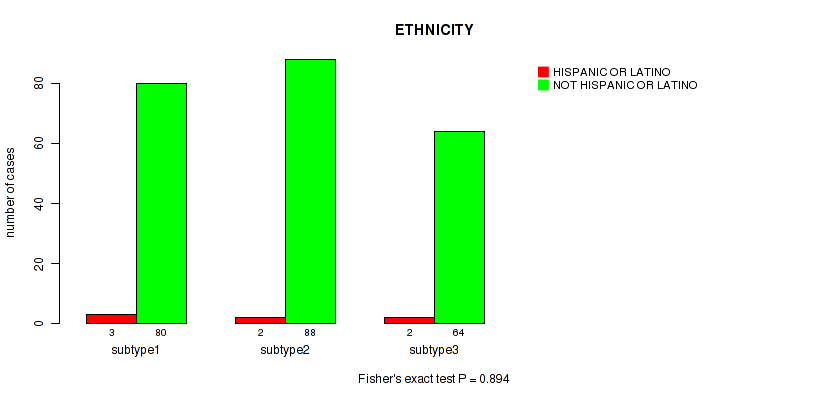
Table S55. Description of clustering approach #7: 'RPPA CNMF subtypes'
| Cluster Labels | 1 | 2 | 3 | 4 |
|---|---|---|---|---|
| Number of samples | 57 | 61 | 44 | 49 |
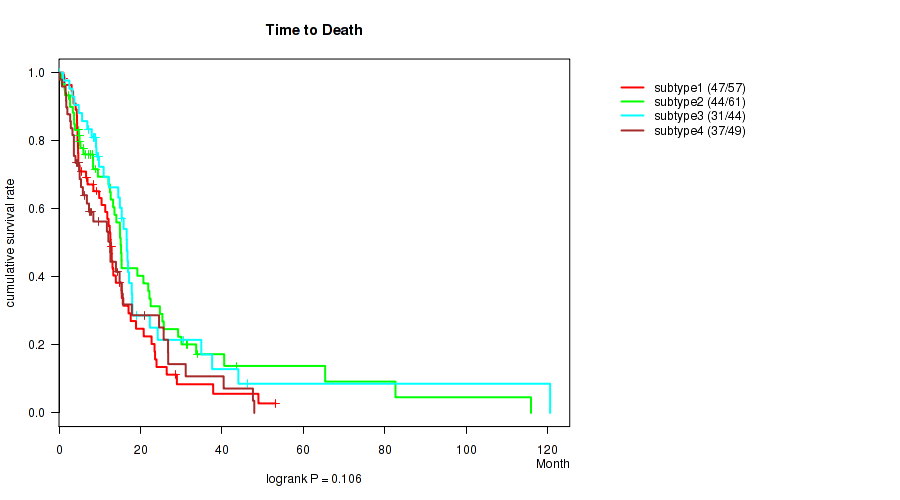
P value = 0.106 (logrank test), Q value = 0.39
Table S56. Clustering Approach #7: 'RPPA CNMF subtypes' versus Clinical Feature #1: 'Time to Death'
| nPatients | nDeath | Duration Range (Median), Month | |
|---|---|---|---|
| ALL | 211 | 159 | 0.1 - 120.6 (9.9) |
| subtype1 | 57 | 47 | 0.1 - 53.2 (11.8) |
| subtype2 | 61 | 44 | 0.2 - 115.9 (12.1) |
| subtype3 | 44 | 31 | 0.1 - 120.6 (13.4) |
| subtype4 | 49 | 37 | 0.2 - 47.9 (7.4) |
Figure S49. Get High-res Image Clustering Approach #7: 'RPPA CNMF subtypes' versus Clinical Feature #1: 'Time to Death'
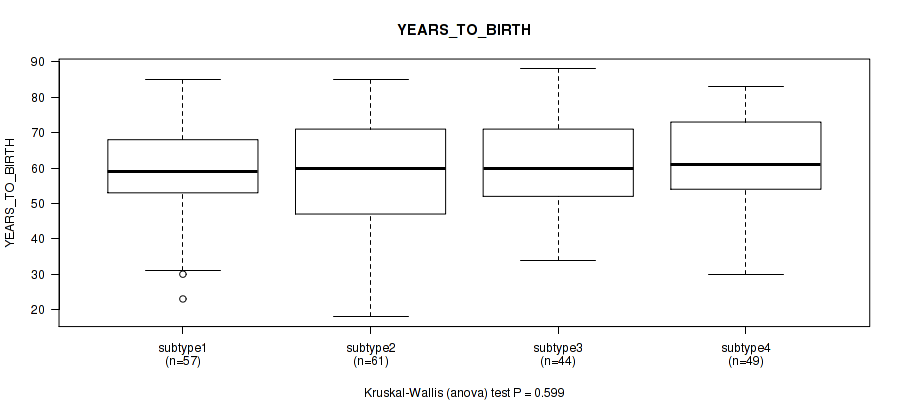
P value = 0.599 (Kruskal-Wallis (anova)), Q value = 0.82
Table S57. Clustering Approach #7: 'RPPA CNMF subtypes' versus Clinical Feature #2: 'YEARS_TO_BIRTH'
| nPatients | Mean (Std.Dev) | |
|---|---|---|
| ALL | 211 | 59.9 (14.1) |
| subtype1 | 57 | 59.2 (13.6) |
| subtype2 | 61 | 57.2 (16.8) |
| subtype3 | 44 | 61.5 (12.2) |
| subtype4 | 49 | 62.5 (12.0) |
Figure S50. Get High-res Image Clustering Approach #7: 'RPPA CNMF subtypes' versus Clinical Feature #2: 'YEARS_TO_BIRTH'
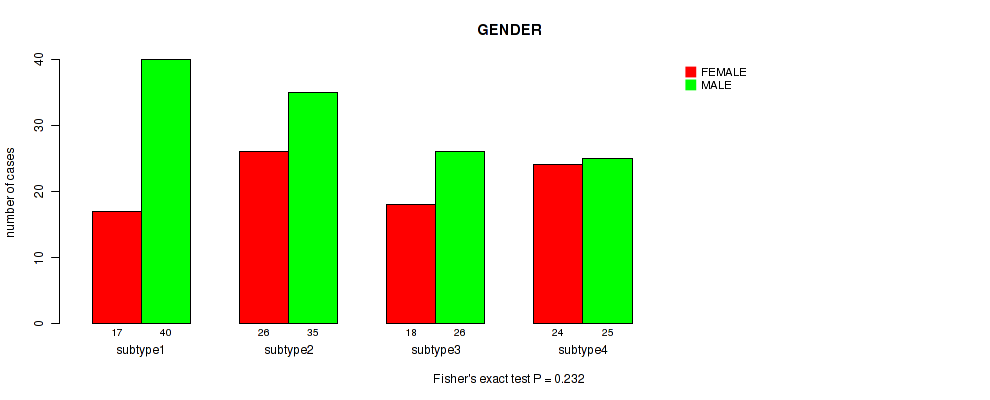
P value = 0.232 (Fisher's exact test), Q value = 0.53
Table S58. Clustering Approach #7: 'RPPA CNMF subtypes' versus Clinical Feature #3: 'GENDER'
| nPatients | FEMALE | MALE |
|---|---|---|
| ALL | 85 | 126 |
| subtype1 | 17 | 40 |
| subtype2 | 26 | 35 |
| subtype3 | 18 | 26 |
| subtype4 | 24 | 25 |
Figure S51. Get High-res Image Clustering Approach #7: 'RPPA CNMF subtypes' versus Clinical Feature #3: 'GENDER'
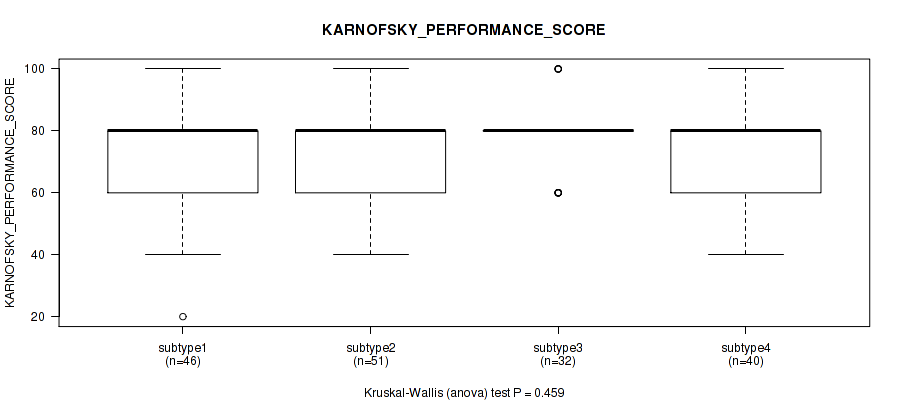
P value = 0.459 (Kruskal-Wallis (anova)), Q value = 0.79
Table S59. Clustering Approach #7: 'RPPA CNMF subtypes' versus Clinical Feature #4: 'KARNOFSKY_PERFORMANCE_SCORE'
| nPatients | Mean (Std.Dev) | |
|---|---|---|
| ALL | 169 | 75.7 (15.3) |
| subtype1 | 46 | 75.0 (15.9) |
| subtype2 | 51 | 76.7 (16.5) |
| subtype3 | 32 | 78.8 (11.3) |
| subtype4 | 40 | 72.8 (15.8) |
Figure S52. Get High-res Image Clustering Approach #7: 'RPPA CNMF subtypes' versus Clinical Feature #4: 'KARNOFSKY_PERFORMANCE_SCORE'
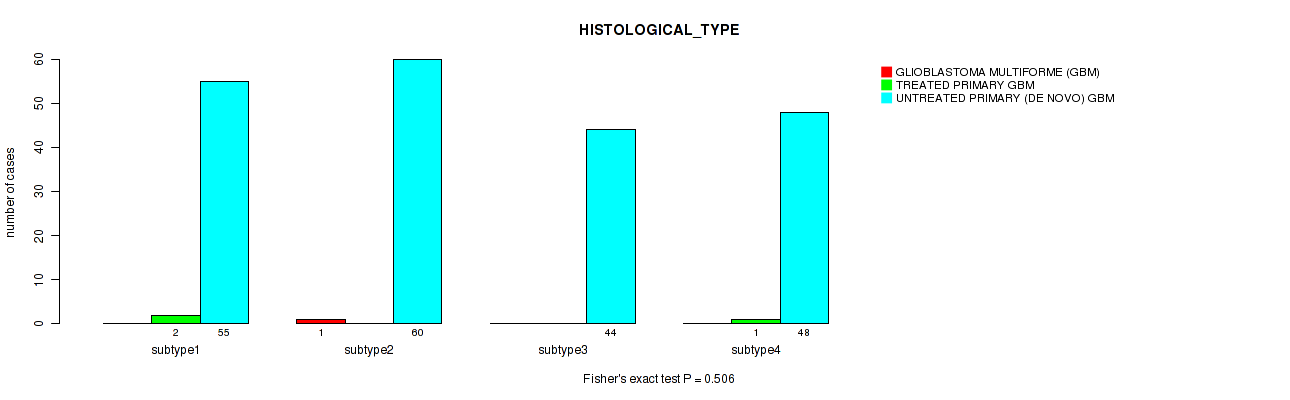
P value = 0.506 (Fisher's exact test), Q value = 0.81
Table S60. Clustering Approach #7: 'RPPA CNMF subtypes' versus Clinical Feature #5: 'HISTOLOGICAL_TYPE'
| nPatients | GLIOBLASTOMA MULTIFORME (GBM) | TREATED PRIMARY GBM | UNTREATED PRIMARY (DE NOVO) GBM |
|---|---|---|---|
| ALL | 1 | 3 | 207 |
| subtype1 | 0 | 2 | 55 |
| subtype2 | 1 | 0 | 60 |
| subtype3 | 0 | 0 | 44 |
| subtype4 | 0 | 1 | 48 |
Figure S53. Get High-res Image Clustering Approach #7: 'RPPA CNMF subtypes' versus Clinical Feature #5: 'HISTOLOGICAL_TYPE'
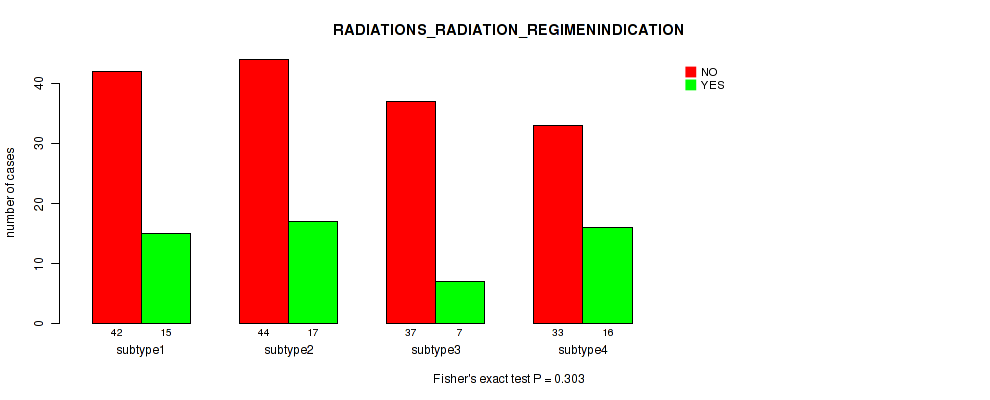
P value = 0.303 (Fisher's exact test), Q value = 0.61
Table S61. Clustering Approach #7: 'RPPA CNMF subtypes' versus Clinical Feature #6: 'RADIATIONS_RADIATION_REGIMENINDICATION'
| nPatients | NO | YES |
|---|---|---|
| ALL | 156 | 55 |
| subtype1 | 42 | 15 |
| subtype2 | 44 | 17 |
| subtype3 | 37 | 7 |
| subtype4 | 33 | 16 |
Figure S54. Get High-res Image Clustering Approach #7: 'RPPA CNMF subtypes' versus Clinical Feature #6: 'RADIATIONS_RADIATION_REGIMENINDICATION'
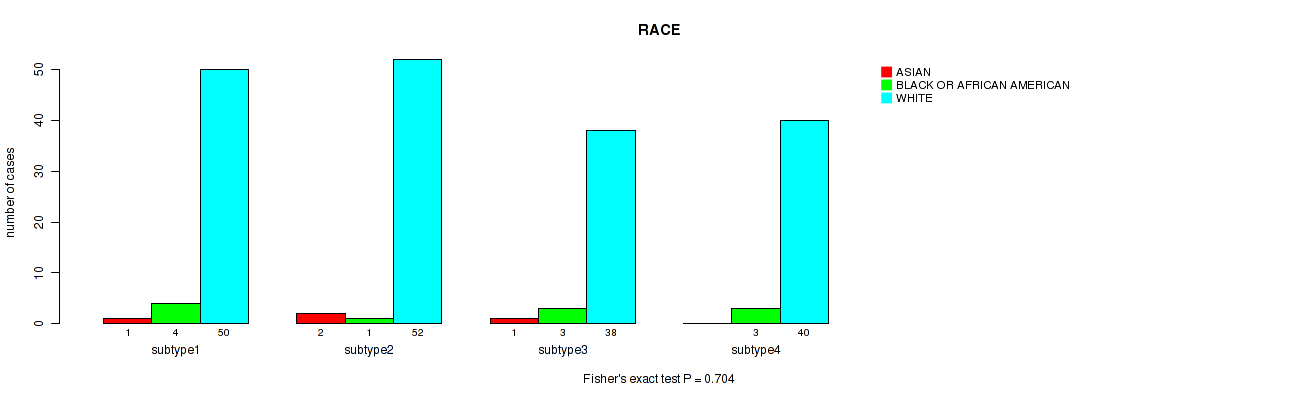
P value = 0.704 (Fisher's exact test), Q value = 0.88
Table S62. Clustering Approach #7: 'RPPA CNMF subtypes' versus Clinical Feature #7: 'RACE'
| nPatients | ASIAN | BLACK OR AFRICAN AMERICAN | WHITE |
|---|---|---|---|
| ALL | 4 | 11 | 180 |
| subtype1 | 1 | 4 | 50 |
| subtype2 | 2 | 1 | 52 |
| subtype3 | 1 | 3 | 38 |
| subtype4 | 0 | 3 | 40 |
Figure S55. Get High-res Image Clustering Approach #7: 'RPPA CNMF subtypes' versus Clinical Feature #7: 'RACE'
P value = 1 (Fisher's exact test), Q value = 1
Table S63. Clustering Approach #7: 'RPPA CNMF subtypes' versus Clinical Feature #8: 'ETHNICITY'
| nPatients | HISPANIC OR LATINO | NOT HISPANIC OR LATINO |
|---|---|---|
| ALL | 2 | 177 |
| subtype1 | 1 | 48 |
| subtype2 | 1 | 52 |
| subtype3 | 0 | 39 |
| subtype4 | 0 | 38 |
Figure S56. Get High-res Image Clustering Approach #7: 'RPPA CNMF subtypes' versus Clinical Feature #8: 'ETHNICITY'
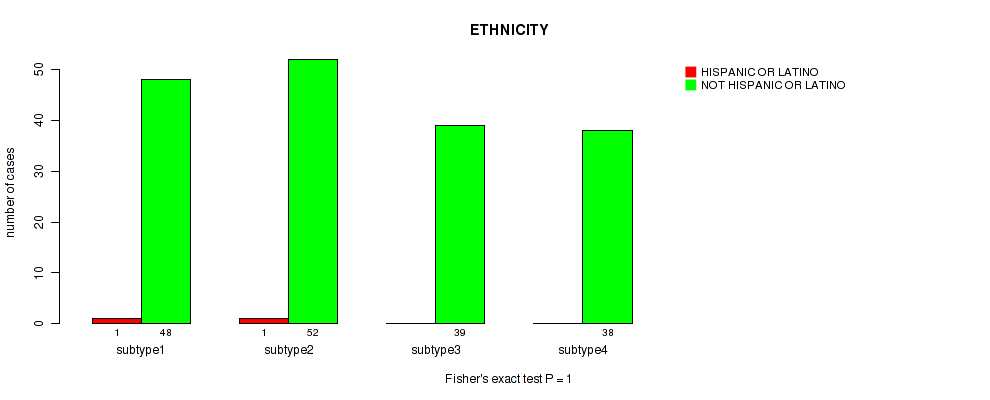
Table S64. Description of clustering approach #8: 'RPPA cHierClus subtypes'
| Cluster Labels | 1 | 2 | 3 |
|---|---|---|---|
| Number of samples | 72 | 82 | 57 |
P value = 0.0135 (logrank test), Q value = 0.12
Table S65. Clustering Approach #8: 'RPPA cHierClus subtypes' versus Clinical Feature #1: 'Time to Death'
| nPatients | nDeath | Duration Range (Median), Month | |
|---|---|---|---|
| ALL | 211 | 159 | 0.1 - 120.6 (9.9) |
| subtype1 | 72 | 58 | 0.2 - 53.2 (8.4) |
| subtype2 | 82 | 57 | 0.1 - 115.9 (9.6) |
| subtype3 | 57 | 44 | 0.1 - 120.6 (13.9) |
Figure S57. Get High-res Image Clustering Approach #8: 'RPPA cHierClus subtypes' versus Clinical Feature #1: 'Time to Death'
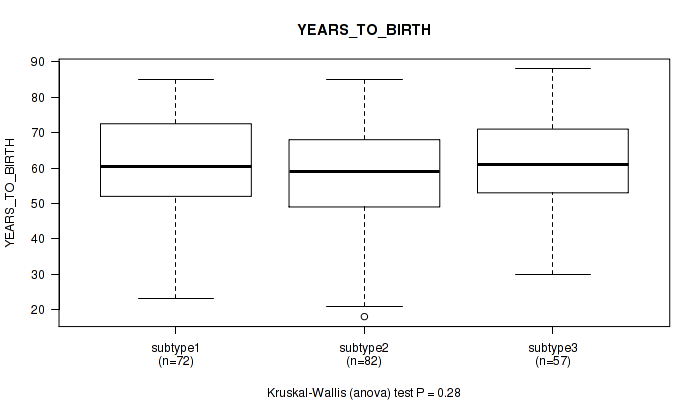
P value = 0.28 (Kruskal-Wallis (anova)), Q value = 0.59
Table S66. Clustering Approach #8: 'RPPA cHierClus subtypes' versus Clinical Feature #2: 'YEARS_TO_BIRTH'
| nPatients | Mean (Std.Dev) | |
|---|---|---|
| ALL | 211 | 59.9 (14.1) |
| subtype1 | 72 | 60.9 (13.9) |
| subtype2 | 82 | 57.5 (15.4) |
| subtype3 | 57 | 62.0 (11.8) |
Figure S58. Get High-res Image Clustering Approach #8: 'RPPA cHierClus subtypes' versus Clinical Feature #2: 'YEARS_TO_BIRTH'
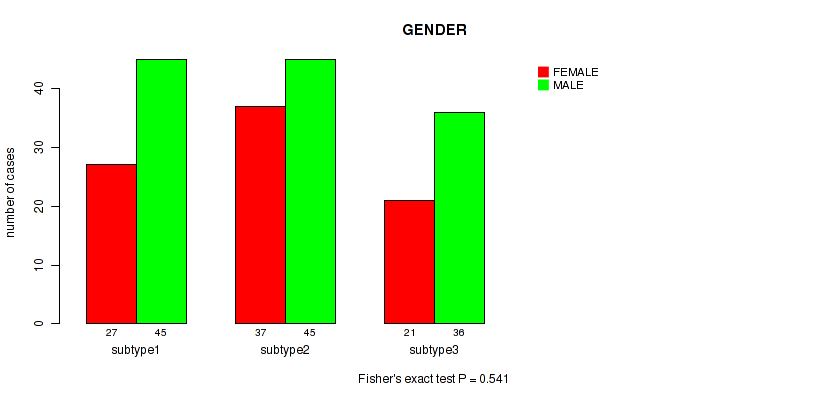
P value = 0.541 (Fisher's exact test), Q value = 0.82
Table S67. Clustering Approach #8: 'RPPA cHierClus subtypes' versus Clinical Feature #3: 'GENDER'
| nPatients | FEMALE | MALE |
|---|---|---|
| ALL | 85 | 126 |
| subtype1 | 27 | 45 |
| subtype2 | 37 | 45 |
| subtype3 | 21 | 36 |
Figure S59. Get High-res Image Clustering Approach #8: 'RPPA cHierClus subtypes' versus Clinical Feature #3: 'GENDER'
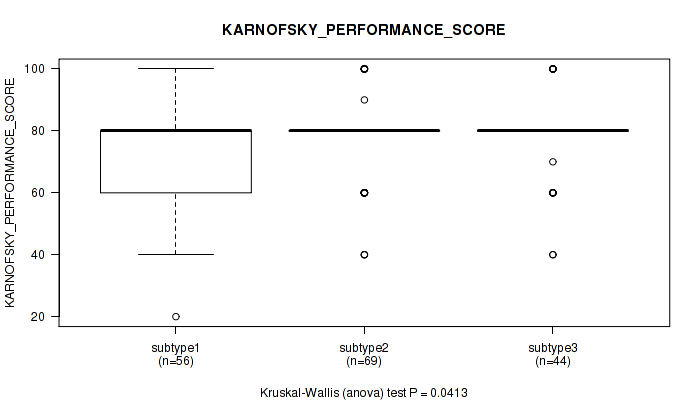
P value = 0.0413 (Kruskal-Wallis (anova)), Q value = 0.3
Table S68. Clustering Approach #8: 'RPPA cHierClus subtypes' versus Clinical Feature #4: 'KARNOFSKY_PERFORMANCE_SCORE'
| nPatients | Mean (Std.Dev) | |
|---|---|---|
| ALL | 169 | 75.7 (15.3) |
| subtype1 | 56 | 71.2 (17.3) |
| subtype2 | 69 | 77.5 (13.8) |
| subtype3 | 44 | 78.4 (14.0) |
Figure S60. Get High-res Image Clustering Approach #8: 'RPPA cHierClus subtypes' versus Clinical Feature #4: 'KARNOFSKY_PERFORMANCE_SCORE'
P value = 1 (Fisher's exact test), Q value = 1
Table S69. Clustering Approach #8: 'RPPA cHierClus subtypes' versus Clinical Feature #5: 'HISTOLOGICAL_TYPE'
| nPatients | GLIOBLASTOMA MULTIFORME (GBM) | TREATED PRIMARY GBM | UNTREATED PRIMARY (DE NOVO) GBM |
|---|---|---|---|
| ALL | 1 | 3 | 207 |
| subtype1 | 0 | 1 | 71 |
| subtype2 | 1 | 1 | 80 |
| subtype3 | 0 | 1 | 56 |
Figure S61. Get High-res Image Clustering Approach #8: 'RPPA cHierClus subtypes' versus Clinical Feature #5: 'HISTOLOGICAL_TYPE'
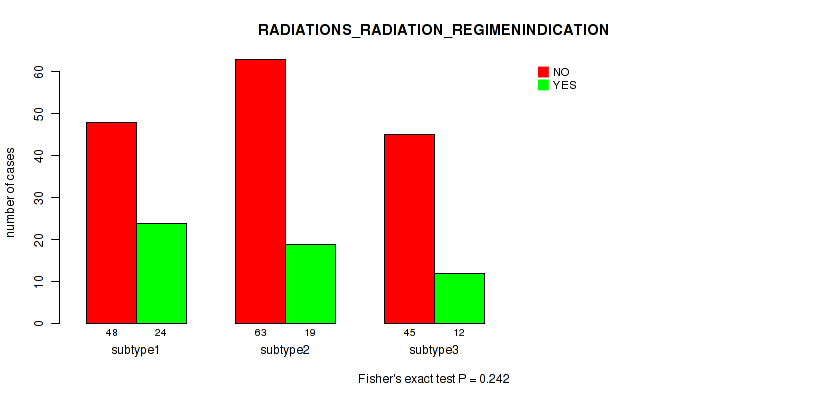
P value = 0.242 (Fisher's exact test), Q value = 0.54
Table S70. Clustering Approach #8: 'RPPA cHierClus subtypes' versus Clinical Feature #6: 'RADIATIONS_RADIATION_REGIMENINDICATION'
| nPatients | NO | YES |
|---|---|---|
| ALL | 156 | 55 |
| subtype1 | 48 | 24 |
| subtype2 | 63 | 19 |
| subtype3 | 45 | 12 |
Figure S62. Get High-res Image Clustering Approach #8: 'RPPA cHierClus subtypes' versus Clinical Feature #6: 'RADIATIONS_RADIATION_REGIMENINDICATION'
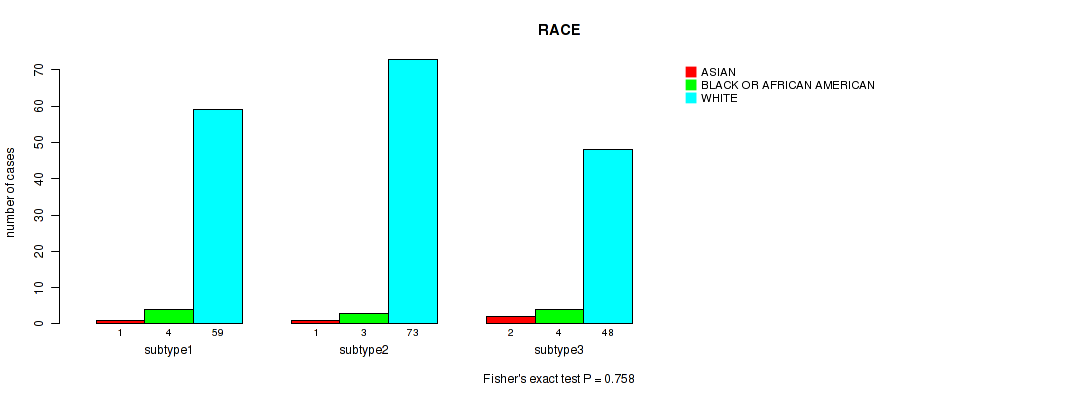
P value = 0.758 (Fisher's exact test), Q value = 0.9
Table S71. Clustering Approach #8: 'RPPA cHierClus subtypes' versus Clinical Feature #7: 'RACE'
| nPatients | ASIAN | BLACK OR AFRICAN AMERICAN | WHITE |
|---|---|---|---|
| ALL | 4 | 11 | 180 |
| subtype1 | 1 | 4 | 59 |
| subtype2 | 1 | 3 | 73 |
| subtype3 | 2 | 4 | 48 |
Figure S63. Get High-res Image Clustering Approach #8: 'RPPA cHierClus subtypes' versus Clinical Feature #7: 'RACE'
P value = 1 (Fisher's exact test), Q value = 1
Table S72. Clustering Approach #8: 'RPPA cHierClus subtypes' versus Clinical Feature #8: 'ETHNICITY'
| nPatients | HISPANIC OR LATINO | NOT HISPANIC OR LATINO |
|---|---|---|
| ALL | 2 | 177 |
| subtype1 | 1 | 56 |
| subtype2 | 1 | 72 |
| subtype3 | 0 | 49 |
Figure S64. Get High-res Image Clustering Approach #8: 'RPPA cHierClus subtypes' versus Clinical Feature #8: 'ETHNICITY'
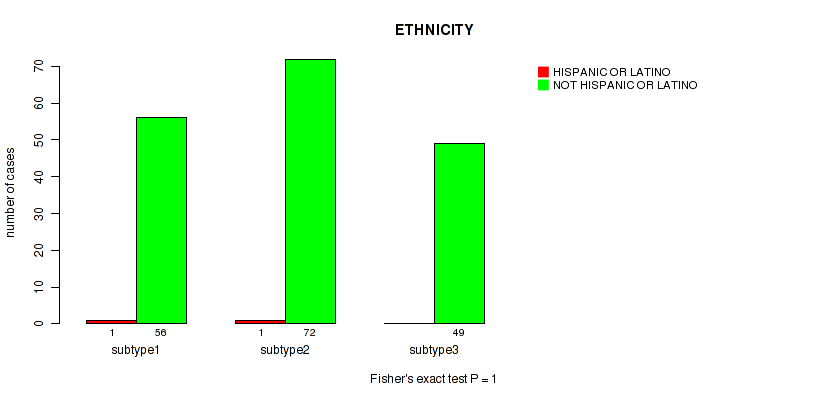
Table S73. Description of clustering approach #9: 'RNAseq CNMF subtypes'
| Cluster Labels | 1 | 2 | 3 |
|---|---|---|---|
| Number of samples | 47 | 70 | 35 |
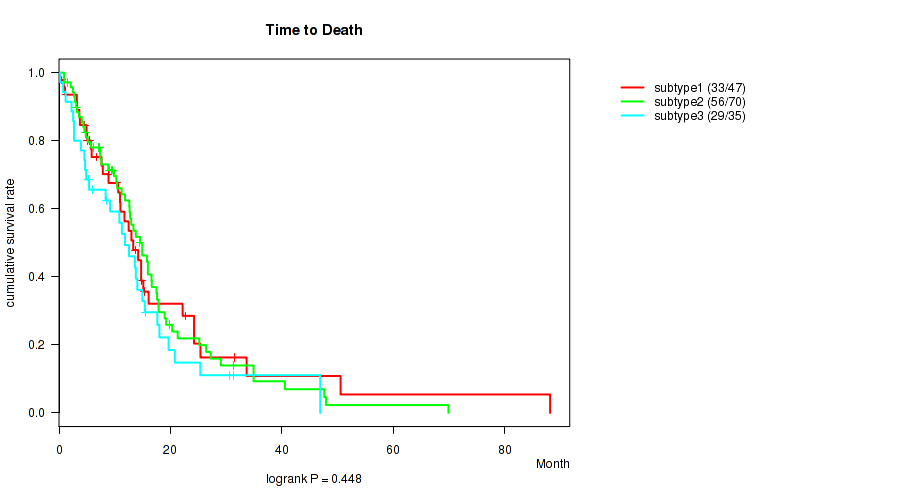
P value = 0.448 (logrank test), Q value = 0.79
Table S74. Clustering Approach #9: 'RNAseq CNMF subtypes' versus Clinical Feature #1: 'Time to Death'
| nPatients | nDeath | Duration Range (Median), Month | |
|---|---|---|---|
| ALL | 152 | 118 | 0.2 - 88.1 (11.0) |
| subtype1 | 47 | 33 | 0.2 - 88.1 (10.6) |
| subtype2 | 70 | 56 | 0.9 - 69.9 (12.2) |
| subtype3 | 35 | 29 | 0.2 - 46.9 (10.8) |
Figure S65. Get High-res Image Clustering Approach #9: 'RNAseq CNMF subtypes' versus Clinical Feature #1: 'Time to Death'
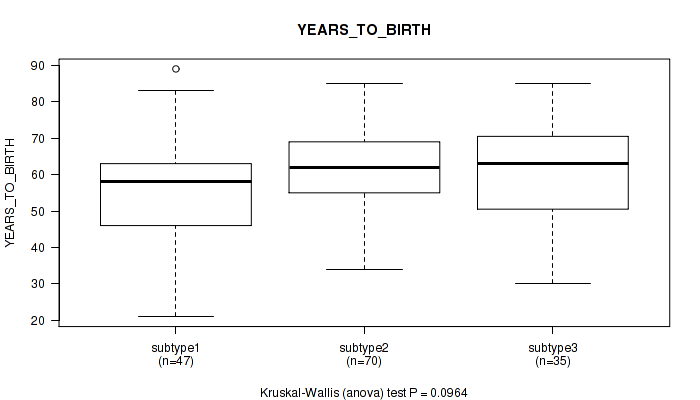
P value = 0.0964 (Kruskal-Wallis (anova)), Q value = 0.37
Table S75. Clustering Approach #9: 'RNAseq CNMF subtypes' versus Clinical Feature #2: 'YEARS_TO_BIRTH'
| nPatients | Mean (Std.Dev) | |
|---|---|---|
| ALL | 152 | 59.7 (13.5) |
| subtype1 | 47 | 55.6 (16.6) |
| subtype2 | 70 | 62.0 (10.6) |
| subtype3 | 35 | 60.9 (13.3) |
Figure S66. Get High-res Image Clustering Approach #9: 'RNAseq CNMF subtypes' versus Clinical Feature #2: 'YEARS_TO_BIRTH'
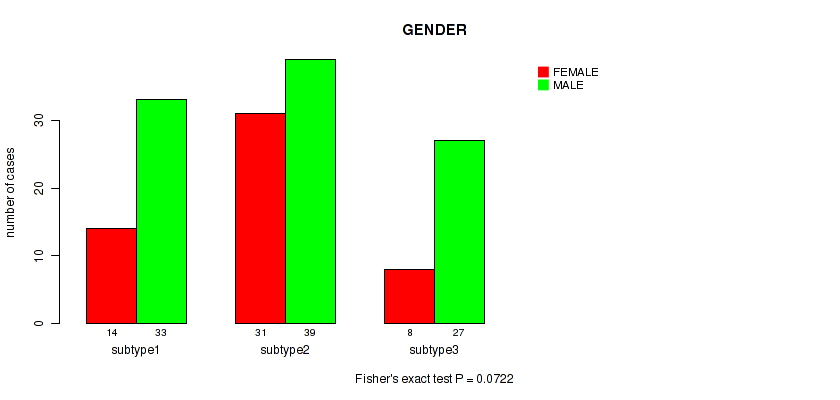
P value = 0.0722 (Fisher's exact test), Q value = 0.33
Table S76. Clustering Approach #9: 'RNAseq CNMF subtypes' versus Clinical Feature #3: 'GENDER'
| nPatients | FEMALE | MALE |
|---|---|---|
| ALL | 53 | 99 |
| subtype1 | 14 | 33 |
| subtype2 | 31 | 39 |
| subtype3 | 8 | 27 |
Figure S67. Get High-res Image Clustering Approach #9: 'RNAseq CNMF subtypes' versus Clinical Feature #3: 'GENDER'
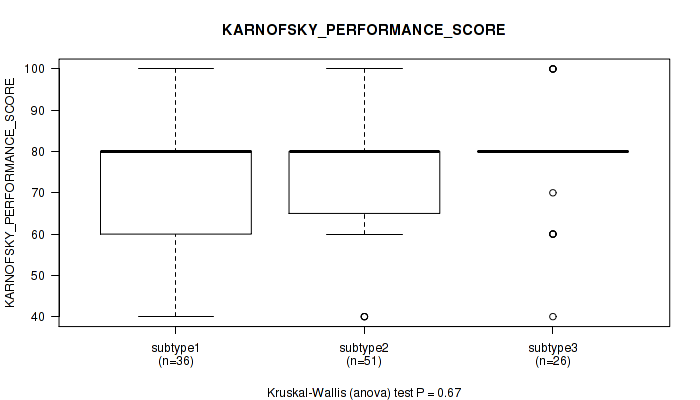
P value = 0.67 (Kruskal-Wallis (anova)), Q value = 0.87
Table S77. Clustering Approach #9: 'RNAseq CNMF subtypes' versus Clinical Feature #4: 'KARNOFSKY_PERFORMANCE_SCORE'
| nPatients | Mean (Std.Dev) | |
|---|---|---|
| ALL | 113 | 75.8 (14.4) |
| subtype1 | 36 | 74.2 (15.2) |
| subtype2 | 51 | 75.7 (14.2) |
| subtype3 | 26 | 78.1 (13.9) |
Figure S68. Get High-res Image Clustering Approach #9: 'RNAseq CNMF subtypes' versus Clinical Feature #4: 'KARNOFSKY_PERFORMANCE_SCORE'
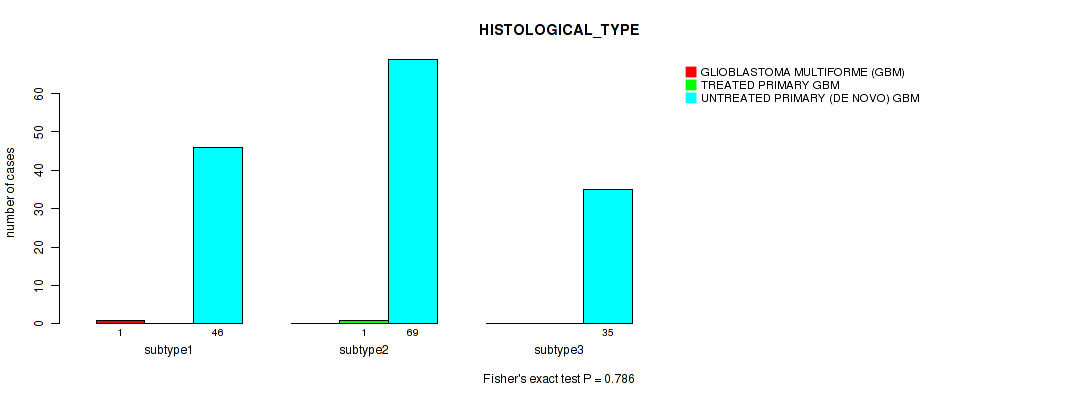
P value = 0.786 (Fisher's exact test), Q value = 0.9
Table S78. Clustering Approach #9: 'RNAseq CNMF subtypes' versus Clinical Feature #5: 'HISTOLOGICAL_TYPE'
| nPatients | GLIOBLASTOMA MULTIFORME (GBM) | TREATED PRIMARY GBM | UNTREATED PRIMARY (DE NOVO) GBM |
|---|---|---|---|
| ALL | 1 | 1 | 150 |
| subtype1 | 1 | 0 | 46 |
| subtype2 | 0 | 1 | 69 |
| subtype3 | 0 | 0 | 35 |
Figure S69. Get High-res Image Clustering Approach #9: 'RNAseq CNMF subtypes' versus Clinical Feature #5: 'HISTOLOGICAL_TYPE'
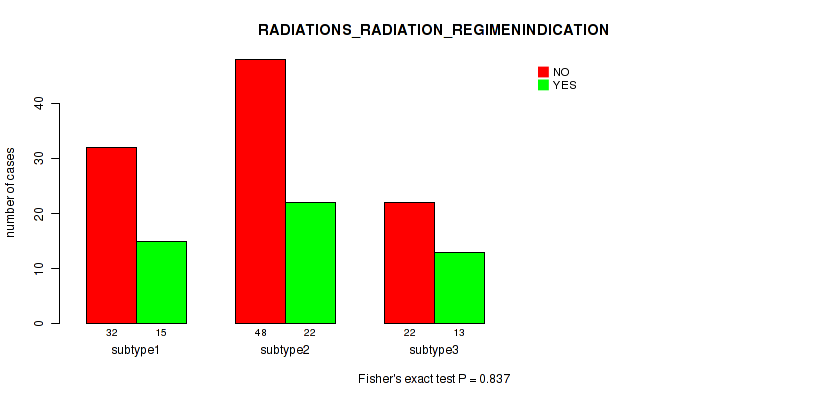
P value = 0.837 (Fisher's exact test), Q value = 0.93
Table S79. Clustering Approach #9: 'RNAseq CNMF subtypes' versus Clinical Feature #6: 'RADIATIONS_RADIATION_REGIMENINDICATION'
| nPatients | NO | YES |
|---|---|---|
| ALL | 102 | 50 |
| subtype1 | 32 | 15 |
| subtype2 | 48 | 22 |
| subtype3 | 22 | 13 |
Figure S70. Get High-res Image Clustering Approach #9: 'RNAseq CNMF subtypes' versus Clinical Feature #6: 'RADIATIONS_RADIATION_REGIMENINDICATION'
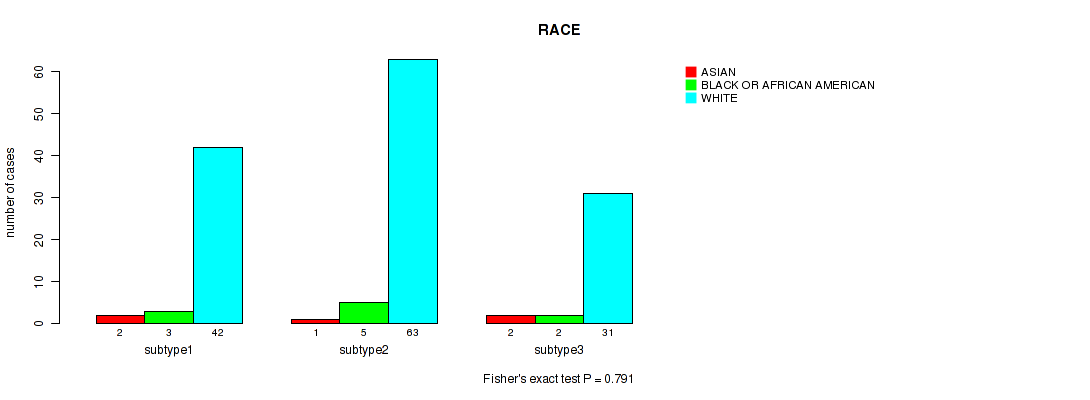
P value = 0.791 (Fisher's exact test), Q value = 0.9
Table S80. Clustering Approach #9: 'RNAseq CNMF subtypes' versus Clinical Feature #7: 'RACE'
| nPatients | ASIAN | BLACK OR AFRICAN AMERICAN | WHITE |
|---|---|---|---|
| ALL | 5 | 10 | 136 |
| subtype1 | 2 | 3 | 42 |
| subtype2 | 1 | 5 | 63 |
| subtype3 | 2 | 2 | 31 |
Figure S71. Get High-res Image Clustering Approach #9: 'RNAseq CNMF subtypes' versus Clinical Feature #7: 'RACE'
P value = 0.791 (Fisher's exact test), Q value = 0.9
Table S81. Clustering Approach #9: 'RNAseq CNMF subtypes' versus Clinical Feature #8: 'ETHNICITY'
| nPatients | HISPANIC OR LATINO | NOT HISPANIC OR LATINO |
|---|---|---|
| ALL | 3 | 125 |
| subtype1 | 1 | 44 |
| subtype2 | 2 | 51 |
| subtype3 | 0 | 30 |
Figure S72. Get High-res Image Clustering Approach #9: 'RNAseq CNMF subtypes' versus Clinical Feature #8: 'ETHNICITY'
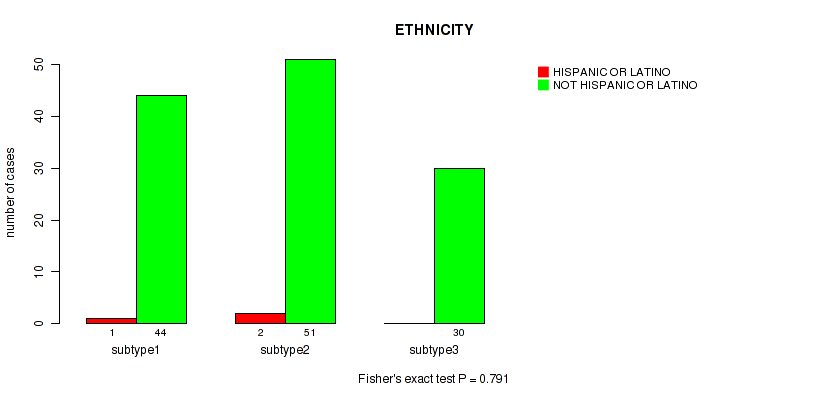
Table S82. Description of clustering approach #10: 'RNAseq cHierClus subtypes'
| Cluster Labels | 1 | 2 | 3 |
|---|---|---|---|
| Number of samples | 32 | 96 | 24 |
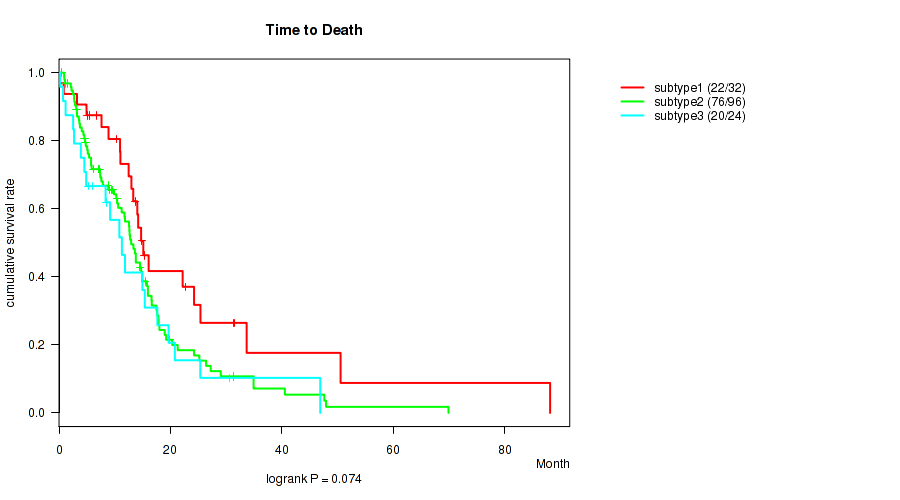
P value = 0.074 (logrank test), Q value = 0.33
Table S83. Clustering Approach #10: 'RNAseq cHierClus subtypes' versus Clinical Feature #1: 'Time to Death'
| nPatients | nDeath | Duration Range (Median), Month | |
|---|---|---|---|
| ALL | 152 | 118 | 0.2 - 88.1 (11.0) |
| subtype1 | 32 | 22 | 0.2 - 88.1 (13.8) |
| subtype2 | 96 | 76 | 0.4 - 69.9 (10.3) |
| subtype3 | 24 | 20 | 0.2 - 46.9 (8.9) |
Figure S73. Get High-res Image Clustering Approach #10: 'RNAseq cHierClus subtypes' versus Clinical Feature #1: 'Time to Death'
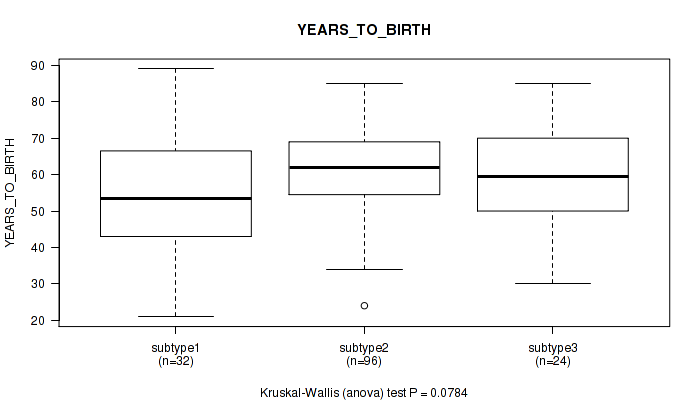
P value = 0.0784 (Kruskal-Wallis (anova)), Q value = 0.33
Table S84. Clustering Approach #10: 'RNAseq cHierClus subtypes' versus Clinical Feature #2: 'YEARS_TO_BIRTH'
| nPatients | Mean (Std.Dev) | |
|---|---|---|
| ALL | 152 | 59.7 (13.5) |
| subtype1 | 32 | 54.2 (18.3) |
| subtype2 | 96 | 61.6 (11.4) |
| subtype3 | 24 | 59.6 (12.5) |
Figure S74. Get High-res Image Clustering Approach #10: 'RNAseq cHierClus subtypes' versus Clinical Feature #2: 'YEARS_TO_BIRTH'
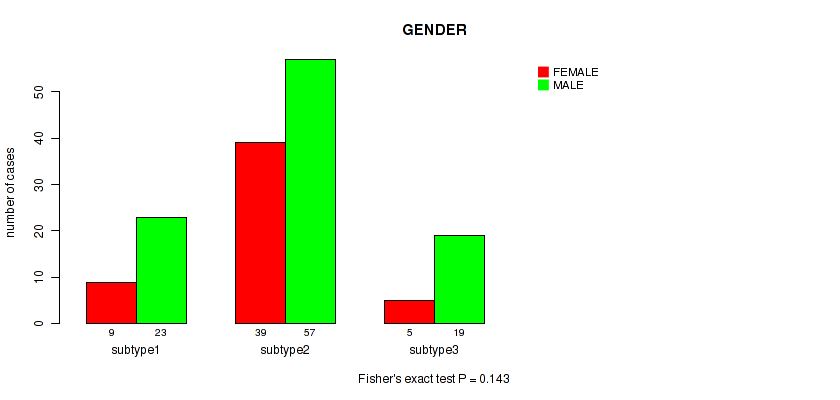
P value = 0.143 (Fisher's exact test), Q value = 0.42
Table S85. Clustering Approach #10: 'RNAseq cHierClus subtypes' versus Clinical Feature #3: 'GENDER'
| nPatients | FEMALE | MALE |
|---|---|---|
| ALL | 53 | 99 |
| subtype1 | 9 | 23 |
| subtype2 | 39 | 57 |
| subtype3 | 5 | 19 |
Figure S75. Get High-res Image Clustering Approach #10: 'RNAseq cHierClus subtypes' versus Clinical Feature #3: 'GENDER'
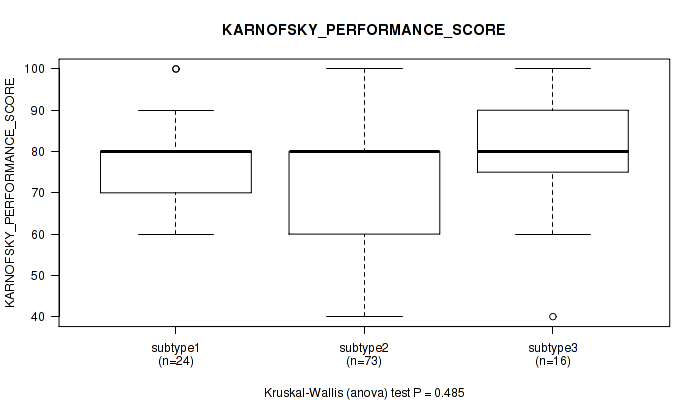
P value = 0.485 (Kruskal-Wallis (anova)), Q value = 0.81
Table S86. Clustering Approach #10: 'RNAseq cHierClus subtypes' versus Clinical Feature #4: 'KARNOFSKY_PERFORMANCE_SCORE'
| nPatients | Mean (Std.Dev) | |
|---|---|---|
| ALL | 113 | 75.8 (14.4) |
| subtype1 | 24 | 77.1 (11.6) |
| subtype2 | 73 | 74.5 (14.7) |
| subtype3 | 16 | 79.4 (16.5) |
Figure S76. Get High-res Image Clustering Approach #10: 'RNAseq cHierClus subtypes' versus Clinical Feature #4: 'KARNOFSKY_PERFORMANCE_SCORE'
P value = 0.603 (Fisher's exact test), Q value = 0.82
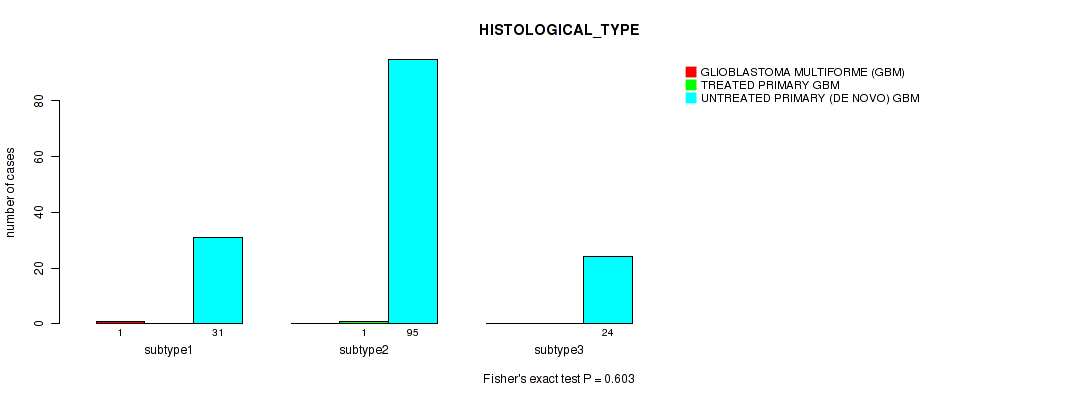
Table S87. Clustering Approach #10: 'RNAseq cHierClus subtypes' versus Clinical Feature #5: 'HISTOLOGICAL_TYPE'
| nPatients | GLIOBLASTOMA MULTIFORME (GBM) | TREATED PRIMARY GBM | UNTREATED PRIMARY (DE NOVO) GBM |
|---|---|---|---|
| ALL | 1 | 1 | 150 |
| subtype1 | 1 | 0 | 31 |
| subtype2 | 0 | 1 | 95 |
| subtype3 | 0 | 0 | 24 |
Figure S77. Get High-res Image Clustering Approach #10: 'RNAseq cHierClus subtypes' versus Clinical Feature #5: 'HISTOLOGICAL_TYPE'
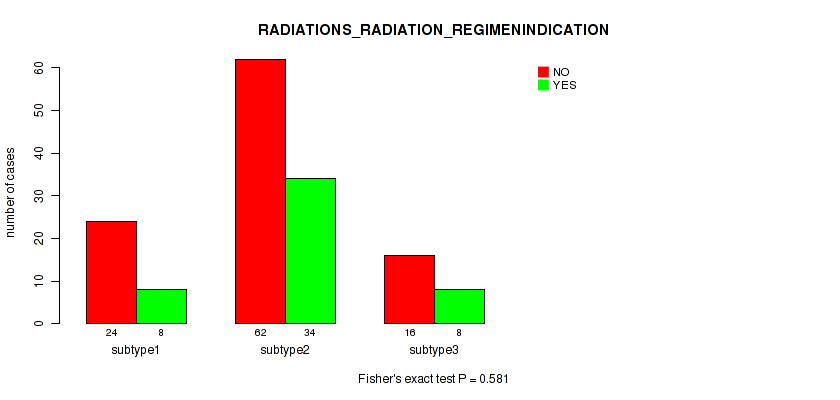
P value = 0.581 (Fisher's exact test), Q value = 0.82
Table S88. Clustering Approach #10: 'RNAseq cHierClus subtypes' versus Clinical Feature #6: 'RADIATIONS_RADIATION_REGIMENINDICATION'
| nPatients | NO | YES |
|---|---|---|
| ALL | 102 | 50 |
| subtype1 | 24 | 8 |
| subtype2 | 62 | 34 |
| subtype3 | 16 | 8 |
Figure S78. Get High-res Image Clustering Approach #10: 'RNAseq cHierClus subtypes' versus Clinical Feature #6: 'RADIATIONS_RADIATION_REGIMENINDICATION'
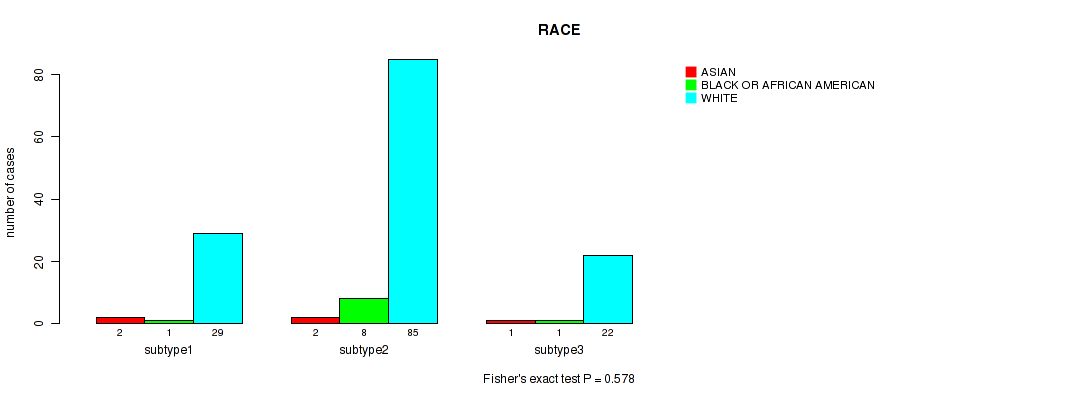
P value = 0.578 (Fisher's exact test), Q value = 0.82
Table S89. Clustering Approach #10: 'RNAseq cHierClus subtypes' versus Clinical Feature #7: 'RACE'
| nPatients | ASIAN | BLACK OR AFRICAN AMERICAN | WHITE |
|---|---|---|---|
| ALL | 5 | 10 | 136 |
| subtype1 | 2 | 1 | 29 |
| subtype2 | 2 | 8 | 85 |
| subtype3 | 1 | 1 | 22 |
Figure S79. Get High-res Image Clustering Approach #10: 'RNAseq cHierClus subtypes' versus Clinical Feature #7: 'RACE'
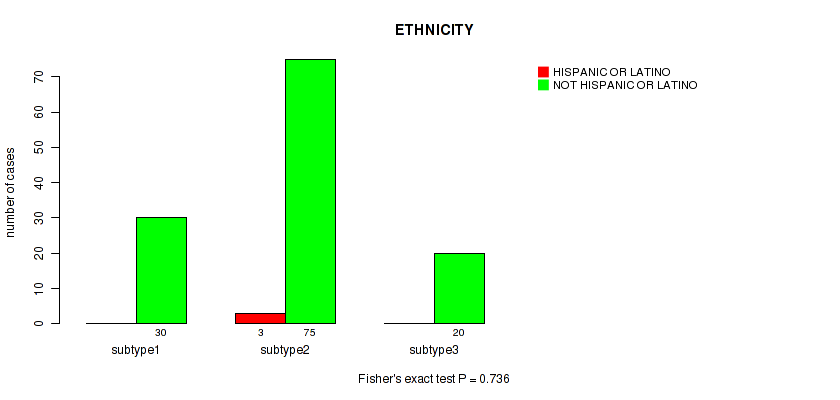
P value = 0.736 (Fisher's exact test), Q value = 0.9
Table S90. Clustering Approach #10: 'RNAseq cHierClus subtypes' versus Clinical Feature #8: 'ETHNICITY'
| nPatients | HISPANIC OR LATINO | NOT HISPANIC OR LATINO |
|---|---|---|
| ALL | 3 | 125 |
| subtype1 | 0 | 30 |
| subtype2 | 3 | 75 |
| subtype3 | 0 | 20 |
Figure S80. Get High-res Image Clustering Approach #10: 'RNAseq cHierClus subtypes' versus Clinical Feature #8: 'ETHNICITY'
-
Cluster data file = /xchip/cga/gdac-prod/tcga-gdac/jobResults/GDAC_mergedClustering/GBM-TP/15125141/GBM-TP.mergedcluster.txt
-
Clinical data file = /xchip/cga/gdac-prod/tcga-gdac/jobResults/Append_Data/GBM-TP/15078636/GBM-TP.merged_data.txt
-
Number of patients = 592
-
Number of clustering approaches = 10
-
Number of selected clinical features = 8
-
Exclude small clusters that include fewer than K patients, K = 3
consensus non-negative matrix factorization clustering approach (Brunet et al. 2004)
Resampling-based clustering method (Monti et al. 2003)
For survival clinical features, the Kaplan-Meier survival curves of tumors with and without gene mutations were plotted and the statistical significance P values were estimated by logrank test (Bland and Altman 2004) using the 'survdiff' function in R
For binary clinical features, two-tailed Fisher's exact tests (Fisher 1922) were used to estimate the P values using the 'fisher.test' function in R
For multiple hypothesis correction, Q value is the False Discovery Rate (FDR) analogue of the P value (Benjamini and Hochberg 1995), defined as the minimum FDR at which the test may be called significant. We used the 'Benjamini and Hochberg' method of 'p.adjust' function in R to convert P values into Q values.
In addition to the links below, the full results of the analysis summarized in this report can also be downloaded programmatically using firehose_get, or interactively from either the Broad GDAC website or TCGA Data Coordination Center Portal.