This pipeline computes the correlation between significantly recurrent gene mutations and selected clinical features.
Testing the association between mutation status of 38 genes and 8 clinical features across 278 patients, 6 significant findings detected with Q value < 0.25.
-
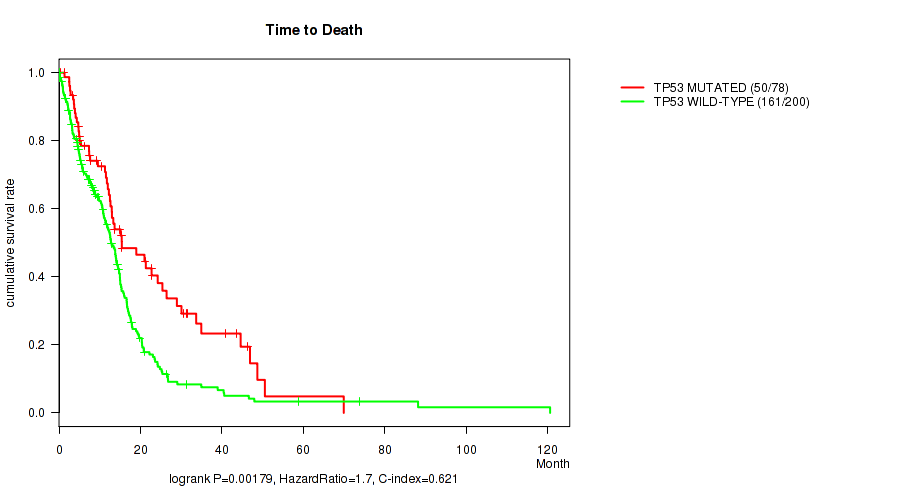
TP53 mutation correlated to 'Time to Death'.
-
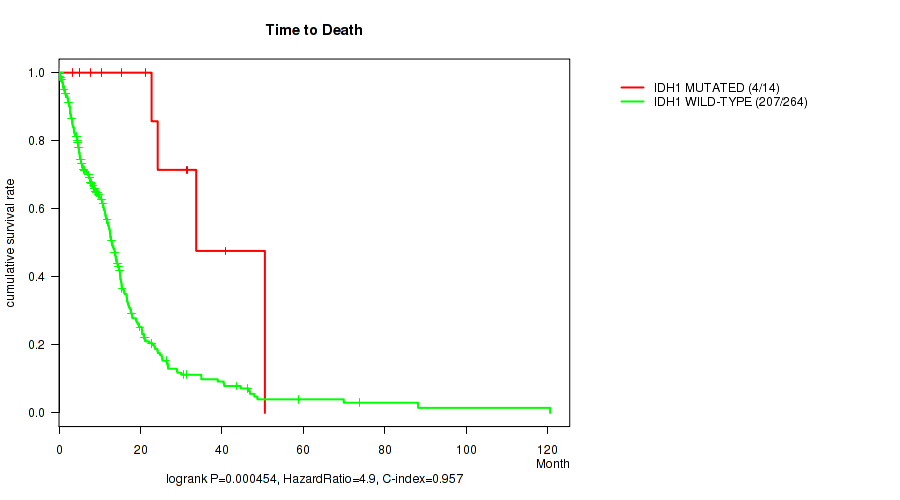
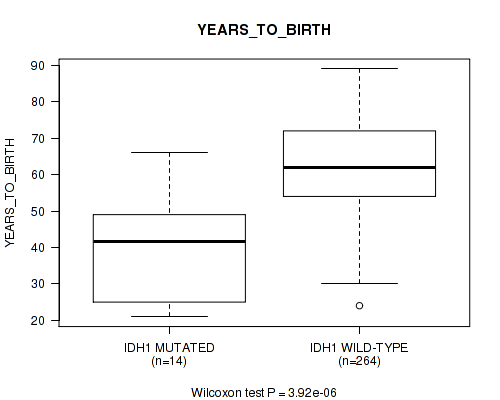
IDH1 mutation correlated to 'Time to Death' and 'YEARS_TO_BIRTH'.
-
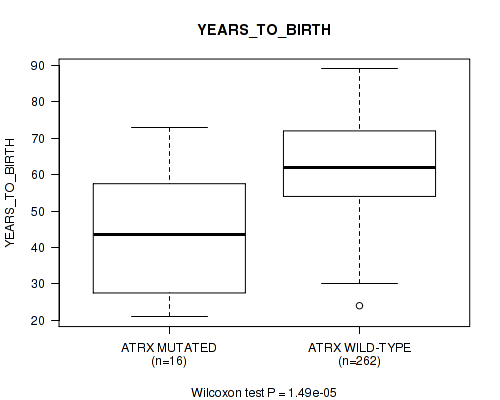
ATRX mutation correlated to 'YEARS_TO_BIRTH'.
-
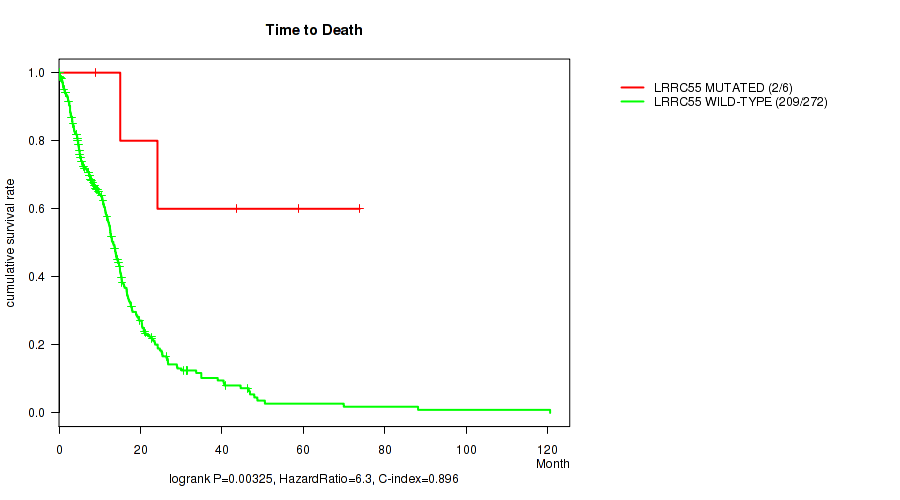
LRRC55 mutation correlated to 'Time to Death'.
-
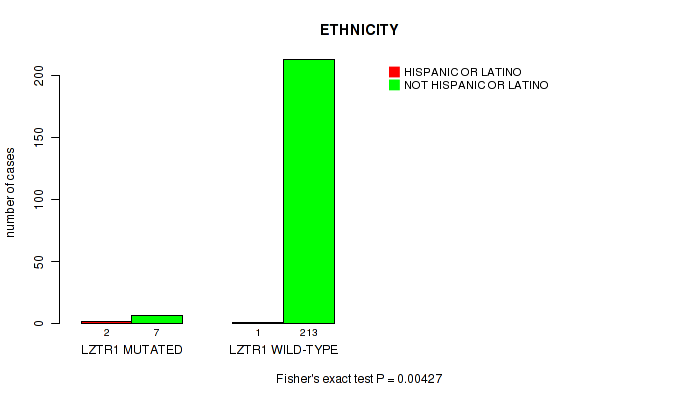
LZTR1 mutation correlated to 'ETHNICITY'.
Table 1. Get Full Table Overview of the association between mutation status of 38 genes and 8 clinical features. Shown in the table are P values (Q values). Thresholded by Q value < 0.25, 6 significant findings detected.
|
Clinical Features |
Time to Death |
YEARS TO BIRTH |
GENDER |
KARNOFSKY PERFORMANCE SCORE |
HISTOLOGICAL TYPE |
RADIATIONS RADIATION REGIMENINDICATION |
RACE | ETHNICITY | ||
| nMutated (%) | nWild-Type | logrank test | Wilcoxon-test | Fisher's exact test | Wilcoxon-test | Fisher's exact test | Fisher's exact test | Fisher's exact test | Fisher's exact test | |
| IDH1 | 14 (5%) | 264 |
0.000454 (0.046) |
3.92e-06 (0.00119) |
0.392 (1.00) |
0.123 (1.00) |
0.494 (1.00) |
0.04 (0.752) |
0.0284 (0.663) |
1 (1.00) |
| TP53 | 78 (28%) | 200 |
0.00179 (0.136) |
0.32 (1.00) |
0.677 (1.00) |
0.102 (1.00) |
0.351 (1.00) |
0.202 (1.00) |
0.598 (1.00) |
1 (1.00) |
| ATRX | 16 (6%) | 262 |
0.00713 (0.31) |
1.49e-05 (0.00226) |
0.593 (1.00) |
0.057 (0.801) |
0.546 (1.00) |
0.279 (1.00) |
0.0252 (0.663) |
1 (1.00) |
| LRRC55 | 6 (2%) | 272 |
0.00325 (0.197) |
0.719 (1.00) |
0.67 (1.00) |
0.0955 (1.00) |
1 (1.00) |
0.667 (1.00) |
0.399 (1.00) |
1 (1.00) |
| LZTR1 | 11 (4%) | 267 |
0.82 (1.00) |
0.446 (1.00) |
0.338 (1.00) |
0.813 (1.00) |
0.187 (1.00) |
0.514 (1.00) |
1 (1.00) |
0.00427 (0.216) |
| PIK3R1 | 32 (12%) | 246 |
0.973 (1.00) |
0.495 (1.00) |
0.434 (1.00) |
0.76 (1.00) |
1 (1.00) |
0.69 (1.00) |
0.678 (1.00) |
1 (1.00) |
| RB1 | 23 (8%) | 255 |
0.279 (1.00) |
0.949 (1.00) |
0.654 (1.00) |
0.0253 (0.663) |
0.681 (1.00) |
1 (1.00) |
0.602 (1.00) |
1 (1.00) |
| PTEN | 85 (31%) | 193 |
0.614 (1.00) |
0.324 (1.00) |
0.588 (1.00) |
0.829 (1.00) |
0.061 (0.807) |
0.678 (1.00) |
1 (1.00) |
0.227 (1.00) |
| NF1 | 29 (10%) | 249 |
0.327 (1.00) |
0.134 (1.00) |
0.84 (1.00) |
0.241 (1.00) |
1 (1.00) |
0.54 (1.00) |
1 (1.00) |
1 (1.00) |
| PIK3CA | 28 (10%) | 250 |
0.195 (1.00) |
0.997 (1.00) |
0.684 (1.00) |
0.751 (1.00) |
0.498 (1.00) |
0.676 (1.00) |
0.422 (1.00) |
1 (1.00) |
| STAG2 | 12 (4%) | 266 |
0.0114 (0.432) |
0.849 (1.00) |
0.761 (1.00) |
0.0422 (0.752) |
1 (1.00) |
0.54 (1.00) |
0.615 (1.00) |
1 (1.00) |
| SEMG2 | 11 (4%) | 267 |
0.598 (1.00) |
0.413 (1.00) |
1 (1.00) |
0.754 (1.00) |
1 (1.00) |
0.756 (1.00) |
0.309 (1.00) |
1 (1.00) |
| MAP3K1 | 6 (2%) | 272 |
0.657 (1.00) |
0.295 (1.00) |
0.424 (1.00) |
0.652 (1.00) |
1 (1.00) |
0.401 (1.00) |
1 (1.00) |
1 (1.00) |
| SLC26A3 | 6 (2%) | 272 |
0.683 (1.00) |
0.279 (1.00) |
0.424 (1.00) |
0.678 (1.00) |
1 (1.00) |
0.183 (1.00) |
1 (1.00) |
1 (1.00) |
| BRAF | 6 (2%) | 272 |
0.242 (1.00) |
0.918 (1.00) |
1 (1.00) |
0.279 (1.00) |
0.0273 (0.663) |
0.401 (1.00) |
0.4 (1.00) |
1 (1.00) |
| EGFR | 73 (26%) | 205 |
0.881 (1.00) |
0.695 (1.00) |
0.257 (1.00) |
0.382 (1.00) |
0.45 (1.00) |
0.565 (1.00) |
0.413 (1.00) |
1 (1.00) |
| TMPRSS6 | 6 (2%) | 272 |
0.978 (1.00) |
0.274 (1.00) |
0.67 (1.00) |
0.284 (1.00) |
1 (1.00) |
0.667 (1.00) |
1 (1.00) |
1 (1.00) |
| SEMA3C | 11 (4%) | 267 |
0.301 (1.00) |
0.995 (1.00) |
0.751 (1.00) |
0.739 (1.00) |
1 (1.00) |
0.514 (1.00) |
0.0566 (0.801) |
0.129 (1.00) |
| RPL5 | 7 (3%) | 271 |
0.854 (1.00) |
0.803 (1.00) |
0.256 (1.00) |
0.423 (1.00) |
1 (1.00) |
0.431 (1.00) |
0.448 (1.00) |
1 (1.00) |
| PDGFRA | 12 (4%) | 266 |
0.737 (1.00) |
0.084 (0.946) |
1 (1.00) |
0.467 (1.00) |
1 (1.00) |
0.067 (0.815) |
1 (1.00) |
1 (1.00) |
| MMP13 | 5 (2%) | 273 |
0.655 (1.00) |
0.12 (1.00) |
0.657 (1.00) |
0.0658 (0.815) |
1 (1.00) |
0.174 (1.00) |
1 (1.00) |
1 (1.00) |
| REN | 5 (2%) | 273 |
0.418 (1.00) |
0.617 (1.00) |
0.657 (1.00) |
0.333 (1.00) |
0.0791 (0.925) |
1 (1.00) |
1 (1.00) |
1 (1.00) |
| DSP | 10 (4%) | 268 |
0.393 (1.00) |
0.29 (1.00) |
0.75 (1.00) |
0.349 (1.00) |
1 (1.00) |
0.505 (1.00) |
1 (1.00) |
1 (1.00) |
| CHD8 | 8 (3%) | 270 |
0.931 (1.00) |
0.0224 (0.663) |
0.141 (1.00) |
0.238 (1.00) |
1 (1.00) |
0.446 (1.00) |
1 (1.00) |
1 (1.00) |
| KDR | 8 (3%) | 270 |
0.645 (1.00) |
0.499 (1.00) |
0.266 (1.00) |
0.754 (1.00) |
0.32 (1.00) |
0.722 (1.00) |
1 (1.00) |
1 (1.00) |
| ODF4 | 3 (1%) | 275 |
0.339 (1.00) |
0.568 (1.00) |
1 (1.00) |
1 (1.00) |
0.255 (1.00) |
1 (1.00) |
1 (1.00) |
|
| TP63 | 6 (2%) | 272 |
0.327 (1.00) |
0.994 (1.00) |
0.67 (1.00) |
0.479 (1.00) |
1 (1.00) |
1 (1.00) |
1 (1.00) |
0.0531 (0.801) |
| PRKCD | 3 (1%) | 275 |
0.958 (1.00) |
0.123 (1.00) |
1 (1.00) |
1 (1.00) |
1 (1.00) |
0.224 (1.00) |
1 (1.00) |
|
| ACSM2B | 4 (1%) | 274 |
0.23 (1.00) |
0.2 (1.00) |
1 (1.00) |
0.605 (1.00) |
1 (1.00) |
0.306 (1.00) |
0.285 (1.00) |
1 (1.00) |
| CLCN7 | 4 (1%) | 274 |
0.644 (1.00) |
0.788 (1.00) |
1 (1.00) |
0.513 (1.00) |
1 (1.00) |
0.306 (1.00) |
1 (1.00) |
1 (1.00) |
| DDX5 | 3 (1%) | 275 |
0.0334 (0.725) |
0.0388 (0.752) |
0.555 (1.00) |
0.134 (1.00) |
1 (1.00) |
1 (1.00) |
1 (1.00) |
|
| FBN3 | 11 (4%) | 267 |
0.0944 (1.00) |
0.94 (1.00) |
0.532 (1.00) |
0.943 (1.00) |
0.189 (1.00) |
0.348 (1.00) |
0.614 (1.00) |
1 (1.00) |
| CD1D | 4 (1%) | 274 |
0.296 (1.00) |
0.253 (1.00) |
0.621 (1.00) |
0.706 (1.00) |
1 (1.00) |
1 (1.00) |
1 (1.00) |
1 (1.00) |
| TEX15 | 8 (3%) | 270 |
0.15 (1.00) |
0.94 (1.00) |
0.715 (1.00) |
0.748 (1.00) |
1 (1.00) |
0.277 (1.00) |
0.495 (1.00) |
1 (1.00) |
| KEL | 15 (5%) | 263 |
0.805 (1.00) |
0.543 (1.00) |
0.413 (1.00) |
0.278 (1.00) |
1 (1.00) |
1 (1.00) |
0.707 (1.00) |
1 (1.00) |
| MUC17 | 21 (8%) | 257 |
0.33 (1.00) |
0.5 (1.00) |
0.817 (1.00) |
0.782 (1.00) |
1 (1.00) |
1 (1.00) |
1 (1.00) |
1 (1.00) |
| SLC6A14 | 5 (2%) | 273 |
0.57 (1.00) |
0.151 (1.00) |
0.354 (1.00) |
0.0445 (0.752) |
0.213 (1.00) |
0.667 (1.00) |
1 (1.00) |
1 (1.00) |
| CD209 | 5 (2%) | 273 |
0.697 (1.00) |
0.717 (1.00) |
0.0579 (0.801) |
0.605 (1.00) |
1 (1.00) |
0.667 (1.00) |
1 (1.00) |
1 (1.00) |
P value = 0.00179 (logrank test), Q value = 0.14
Table S1. Gene #1: 'TP53 MUTATION STATUS' versus Clinical Feature #1: 'Time to Death'
| nPatients | nDeath | Duration Range (Median), Month | |
|---|---|---|---|
| ALL | 278 | 211 | 0.1 - 120.6 (10.8) |
| TP53 MUTATED | 78 | 50 | 0.4 - 69.9 (12.1) |
| TP53 WILD-TYPE | 200 | 161 | 0.1 - 120.6 (10.5) |
Figure S1. Get High-res Image Gene #1: 'TP53 MUTATION STATUS' versus Clinical Feature #1: 'Time to Death'
P value = 0.000454 (logrank test), Q value = 0.046
Table S2. Gene #6: 'IDH1 MUTATION STATUS' versus Clinical Feature #1: 'Time to Death'
| nPatients | nDeath | Duration Range (Median), Month | |
|---|---|---|---|
| ALL | 278 | 211 | 0.1 - 120.6 (10.8) |
| IDH1 MUTATED | 14 | 4 | 3.4 - 50.5 (21.9) |
| IDH1 WILD-TYPE | 264 | 207 | 0.1 - 120.6 (10.7) |
Figure S2. Get High-res Image Gene #6: 'IDH1 MUTATION STATUS' versus Clinical Feature #1: 'Time to Death'
P value = 3.92e-06 (Wilcoxon-test), Q value = 0.0012
Table S3. Gene #6: 'IDH1 MUTATION STATUS' versus Clinical Feature #2: 'YEARS_TO_BIRTH'
| nPatients | Mean (Std.Dev) | |
|---|---|---|
| ALL | 278 | 61.0 (13.0) |
| IDH1 MUTATED | 14 | 40.0 (15.1) |
| IDH1 WILD-TYPE | 264 | 62.2 (11.9) |
Figure S3. Get High-res Image Gene #6: 'IDH1 MUTATION STATUS' versus Clinical Feature #2: 'YEARS_TO_BIRTH'
P value = 1.49e-05 (Wilcoxon-test), Q value = 0.0023
Table S4. Gene #12: 'ATRX MUTATION STATUS' versus Clinical Feature #2: 'YEARS_TO_BIRTH'
| nPatients | Mean (Std.Dev) | |
|---|---|---|
| ALL | 278 | 61.0 (13.0) |
| ATRX MUTATED | 16 | 42.7 (16.4) |
| ATRX WILD-TYPE | 262 | 62.2 (11.9) |
Figure S4. Get High-res Image Gene #12: 'ATRX MUTATION STATUS' versus Clinical Feature #2: 'YEARS_TO_BIRTH'
P value = 0.00325 (logrank test), Q value = 0.2
Table S5. Gene #36: 'LRRC55 MUTATION STATUS' versus Clinical Feature #1: 'Time to Death'
| nPatients | nDeath | Duration Range (Median), Month | |
|---|---|---|---|
| ALL | 278 | 211 | 0.1 - 120.6 (10.8) |
| LRRC55 MUTATED | 6 | 2 | 9.0 - 73.8 (33.8) |
| LRRC55 WILD-TYPE | 272 | 209 | 0.1 - 120.6 (10.7) |
Figure S5. Get High-res Image Gene #36: 'LRRC55 MUTATION STATUS' versus Clinical Feature #1: 'Time to Death'
P value = 0.00427 (Fisher's exact test), Q value = 0.22
Table S6. Gene #38: 'LZTR1 MUTATION STATUS' versus Clinical Feature #8: 'ETHNICITY'
| nPatients | HISPANIC OR LATINO | NOT HISPANIC OR LATINO |
|---|---|---|
| ALL | 3 | 220 |
| LZTR1 MUTATED | 2 | 7 |
| LZTR1 WILD-TYPE | 1 | 213 |
Figure S6. Get High-res Image Gene #38: 'LZTR1 MUTATION STATUS' versus Clinical Feature #8: 'ETHNICITY'
-
Mutation data file = sample_sig_gene_table.txt from Mutsig_2CV pipeline
-
Processed Mutation data file = /xchip/cga/gdac-prod/tcga-gdac/jobResults/GDAC_Correlate_Genomic_Events_Preprocess/GBM-TP/15658343/transformed.cor.cli.txt
-
Clinical data file = /xchip/cga/gdac-prod/tcga-gdac/jobResults/Append_Data/GBM-TP/15078636/GBM-TP.merged_data.txt
-
Number of patients = 278
-
Number of significantly mutated genes = 38
-
Number of selected clinical features = 8
-
Exclude genes that fewer than K tumors have mutations, K = 3
For survival clinical features, the Kaplan-Meier survival curves of tumors with and without gene mutations were plotted and the statistical significance P values were estimated by logrank test (Bland and Altman 2004) using the 'survdiff' function in R
For binary or multi-class clinical features (nominal or ordinal), two-tailed Fisher's exact tests (Fisher 1922) were used to estimate the P values using the 'fisher.test' function in R
For multiple hypothesis correction, Q value is the False Discovery Rate (FDR) analogue of the P value (Benjamini and Hochberg 1995), defined as the minimum FDR at which the test may be called significant. We used the 'Benjamini and Hochberg' method of 'p.adjust' function in R to convert P values into Q values.
In addition to the links below, the full results of the analysis summarized in this report can also be downloaded programmatically using firehose_get, or interactively from either the Broad GDAC website or TCGA Data Coordination Center Portal.