This pipeline computes the correlation between cancer subtypes identified by different molecular patterns and selected clinical features.
Testing the association between subtypes identified by 12 different clustering approaches and 9 clinical features across 1066 patients, 48 significant findings detected with P value < 0.05 and Q value < 0.25.
-
CNMF clustering analysis on array-based mRNA expression data identified 4 subtypes that correlate to 'HISTOLOGICAL_TYPE'.
-
Consensus hierarchical clustering analysis on array-based mRNA expression data identified 4 subtypes that correlate to 'Time to Death', 'YEARS_TO_BIRTH', 'HISTOLOGICAL_TYPE', and 'RADIATIONS_RADIATION_REGIMENINDICATION'.
-
CNMF clustering analysis on array-based miR expression data identified 4 subtypes that correlate to 'Time to Death'.
-
Consensus hierarchical clustering analysis on array-based miR expression data identified 3 subtypes that do not correlate to any clinical features.
-
3 subtypes identified in current cancer cohort by 'Copy Number Ratio CNMF subtypes'. These subtypes correlate to 'Time to Death', 'YEARS_TO_BIRTH', 'PRIMARY_SITE_OF_DISEASE', 'KARNOFSKY_PERFORMANCE_SCORE', 'HISTOLOGICAL_TYPE', 'RADIATIONS_RADIATION_REGIMENINDICATION', 'RACE', and 'ETHNICITY'.
-
4 subtypes identified in current cancer cohort by 'METHLYATION CNMF'. These subtypes correlate to 'Time to Death', 'YEARS_TO_BIRTH', 'PRIMARY_SITE_OF_DISEASE', 'KARNOFSKY_PERFORMANCE_SCORE', 'HISTOLOGICAL_TYPE', 'RADIATIONS_RADIATION_REGIMENINDICATION', and 'RACE'.
-
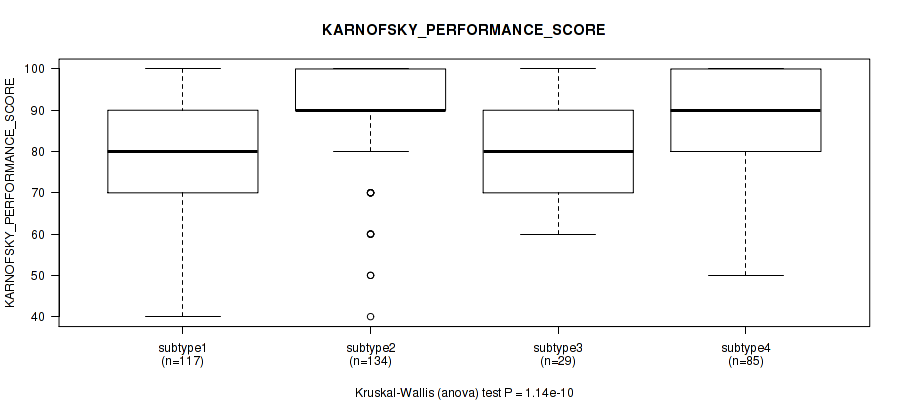
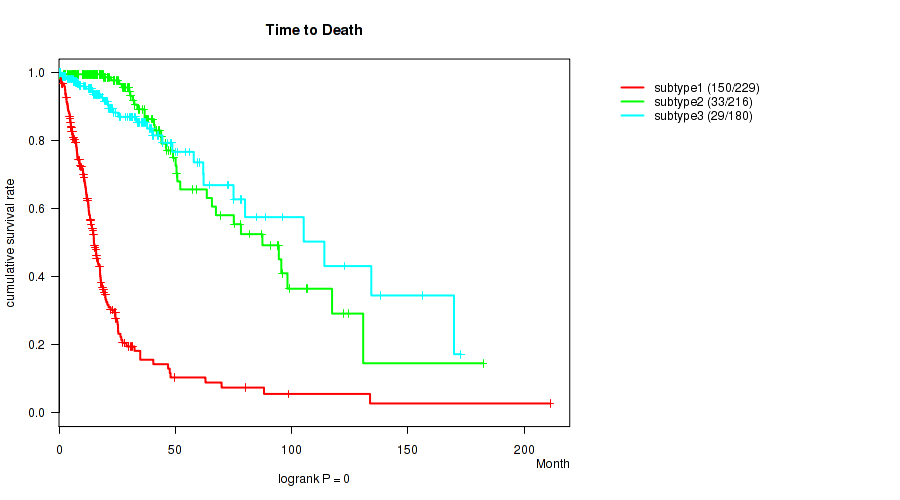
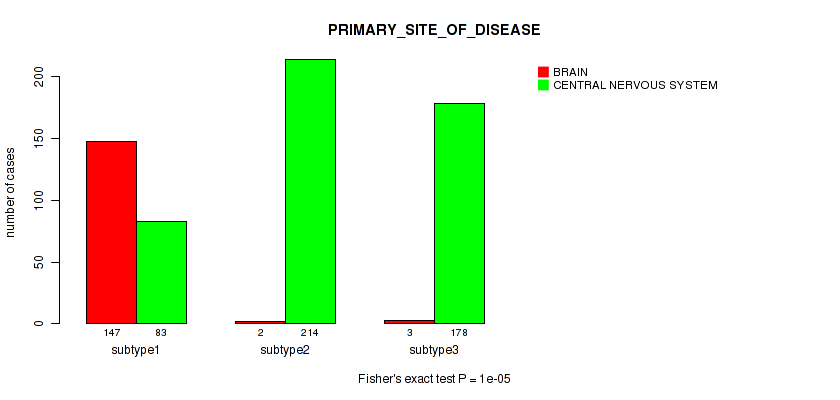
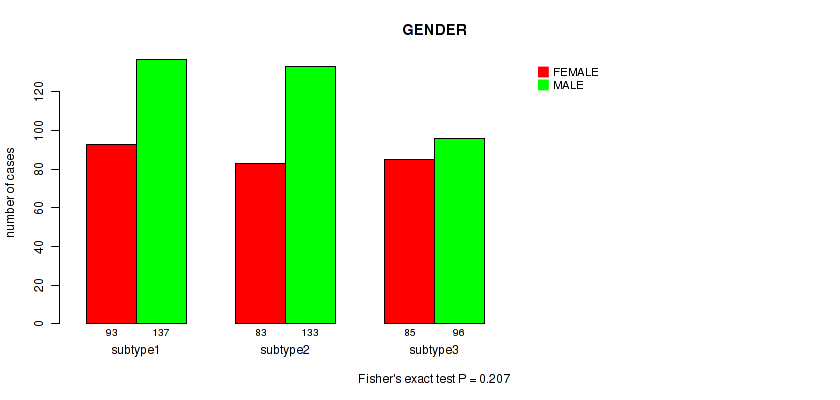
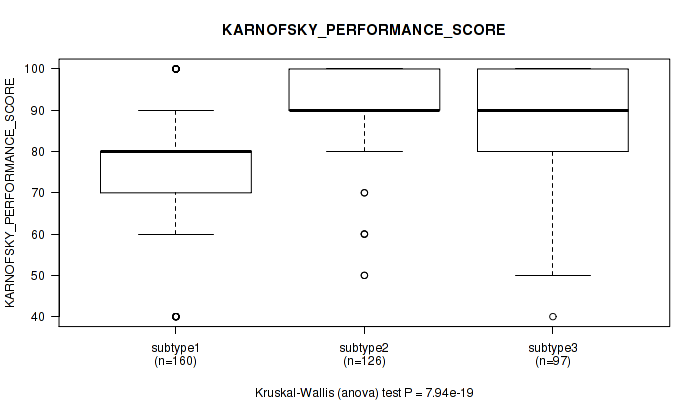
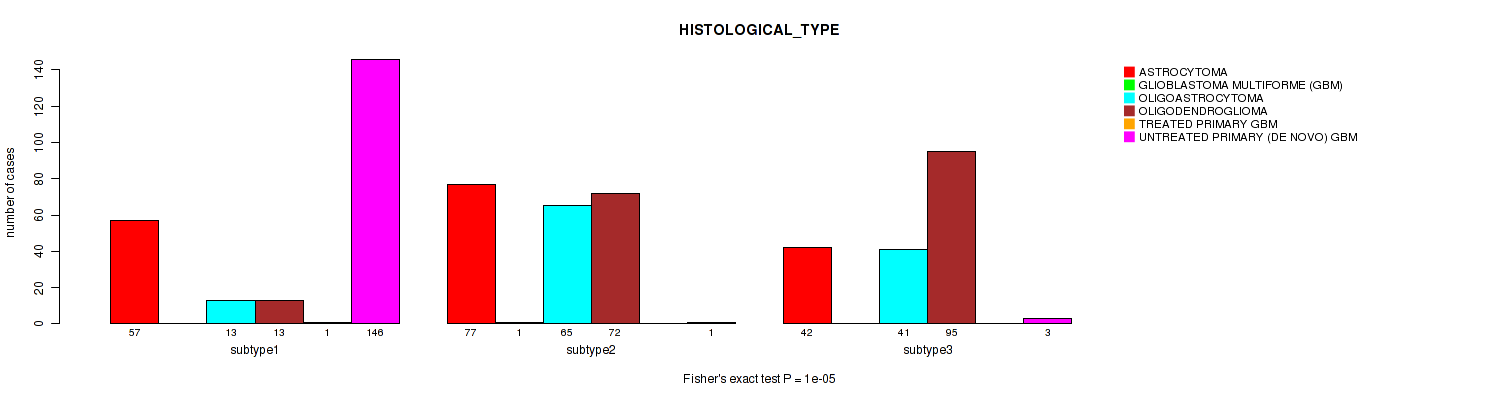
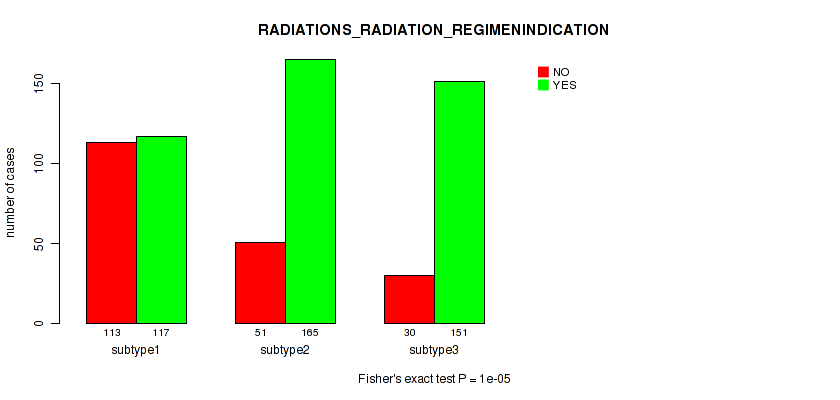
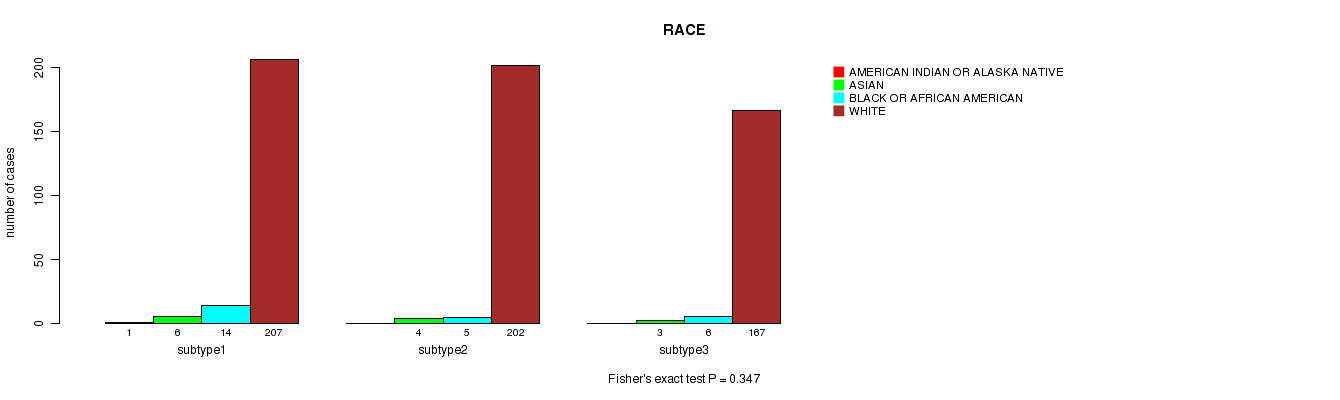
CNMF clustering analysis on sequencing-based mRNA expression data identified 3 subtypes that correlate to 'Time to Death', 'YEARS_TO_BIRTH', 'PRIMARY_SITE_OF_DISEASE', 'KARNOFSKY_PERFORMANCE_SCORE', 'HISTOLOGICAL_TYPE', and 'RADIATIONS_RADIATION_REGIMENINDICATION'.
-
Consensus hierarchical clustering analysis on sequencing-based mRNA expression data identified 3 subtypes that correlate to 'Time to Death', 'YEARS_TO_BIRTH', 'PRIMARY_SITE_OF_DISEASE', 'KARNOFSKY_PERFORMANCE_SCORE', 'HISTOLOGICAL_TYPE', and 'RADIATIONS_RADIATION_REGIMENINDICATION'.
-
4 subtypes identified in current cancer cohort by 'MIRSEQ CNMF'. These subtypes correlate to 'Time to Death', 'KARNOFSKY_PERFORMANCE_SCORE', and 'HISTOLOGICAL_TYPE'.
-
3 subtypes identified in current cancer cohort by 'MIRSEQ CHIERARCHICAL'. These subtypes correlate to 'Time to Death', 'YEARS_TO_BIRTH', 'KARNOFSKY_PERFORMANCE_SCORE', and 'HISTOLOGICAL_TYPE'.
-
3 subtypes identified in current cancer cohort by 'MIRseq Mature CNMF subtypes'. These subtypes correlate to 'Time to Death', 'GENDER', 'HISTOLOGICAL_TYPE', and 'RADIATIONS_RADIATION_REGIMENINDICATION'.
-
4 subtypes identified in current cancer cohort by 'MIRseq Mature cHierClus subtypes'. These subtypes correlate to 'Time to Death', 'YEARS_TO_BIRTH', 'KARNOFSKY_PERFORMANCE_SCORE', and 'HISTOLOGICAL_TYPE'.
Table 1. Get Full Table Overview of the association between subtypes identified by 12 different clustering approaches and 9 clinical features. Shown in the table are P values (Q values). Thresholded by P value < 0.05 and Q value < 0.25, 48 significant findings detected.
|
Clinical Features |
Time to Death |
YEARS TO BIRTH |
PRIMARY SITE OF DISEASE |
GENDER |
KARNOFSKY PERFORMANCE SCORE |
HISTOLOGICAL TYPE |
RADIATIONS RADIATION REGIMENINDICATION |
RACE | ETHNICITY |
| Statistical Tests | logrank test | Kruskal-Wallis (anova) | Fisher's exact test | Fisher's exact test | Kruskal-Wallis (anova) | Fisher's exact test | Fisher's exact test | Fisher's exact test | Fisher's exact test |
| mRNA CNMF subtypes |
0.0641 (0.136) |
0.0788 (0.161) |
0.397 (0.579) |
0.6 (0.771) |
0.00404 (0.0112) |
0.0682 (0.142) |
0.833 (0.947) |
0.125 (0.237) |
|
| mRNA cHierClus subtypes |
0.000134 (0.000438) |
0.00252 (0.00716) |
0.0898 (0.18) |
0.509 (0.696) |
0.0296 (0.0712) |
0.0134 (0.0338) |
0.588 (0.765) |
0.683 (0.828) |
|
| miR CNMF subtypes |
0.0042 (0.0113) |
0.38 (0.562) |
0.649 (0.819) |
0.882 (0.982) |
0.362 (0.543) |
0.418 (0.586) |
0.205 (0.349) |
0.855 (0.962) |
|
| miR cHierClus subtypes |
0.165 (0.293) |
0.127 (0.237) |
0.151 (0.276) |
0.571 (0.752) |
0.284 (0.457) |
0.977 (1.00) |
0.193 (0.336) |
0.675 (0.828) |
|
| Copy Number Ratio CNMF subtypes |
0 (0) |
1.62e-72 (2.91e-71) |
1e-05 (3.48e-05) |
0.336 (0.518) |
3.59e-19 (3.87e-18) |
1e-05 (3.48e-05) |
1e-05 (3.48e-05) |
0.013 (0.0334) |
0.0419 (0.0944) |
| METHLYATION CNMF |
0 (0) |
2.12e-43 (3.27e-42) |
1e-05 (3.48e-05) |
0.917 (1.00) |
1.14e-10 (8.21e-10) |
1e-05 (3.48e-05) |
1e-05 (3.48e-05) |
0.00023 (0.00071) |
0.663 (0.823) |
| RNAseq CNMF subtypes |
0 (0) |
1.2e-31 (1.44e-30) |
1e-05 (3.48e-05) |
0.207 (0.349) |
7.94e-19 (7.8e-18) |
1e-05 (3.48e-05) |
1e-05 (3.48e-05) |
0.347 (0.528) |
0.505 (0.696) |
| RNAseq cHierClus subtypes |
0 (0) |
1.69e-41 (2.29e-40) |
1e-05 (3.48e-05) |
0.256 (0.418) |
1.05e-15 (9.44e-15) |
1e-05 (3.48e-05) |
1e-05 (3.48e-05) |
0.126 (0.237) |
0.818 (0.947) |
| MIRSEQ CNMF |
0.042 (0.0944) |
0.652 (0.819) |
0.707 (0.839) |
0.0232 (0.057) |
1e-05 (3.48e-05) |
0.316 (0.494) |
0.106 (0.209) |
0.825 (0.947) |
|
| MIRSEQ CHIERARCHICAL |
1.14e-11 (9.47e-11) |
8.83e-08 (5.96e-07) |
0.231 (0.384) |
0.000327 (0.000982) |
1e-05 (3.48e-05) |
0.411 (0.585) |
0.559 (0.745) |
1 (1.00) |
|
| MIRseq Mature CNMF subtypes |
0.000731 (0.00213) |
0.163 (0.293) |
0.0321 (0.0755) |
0.0535 (0.118) |
8e-05 (0.00027) |
0.00651 (0.0171) |
0.739 (0.867) |
0.408 (0.585) |
|
| MIRseq Mature cHierClus subtypes |
0 (0) |
1.51e-11 (1.17e-10) |
0.0626 (0.135) |
0.000172 (0.000546) |
1e-05 (3.48e-05) |
0.702 (0.839) |
0.3 (0.477) |
0.526 (0.71) |
Table S1. Description of clustering approach #1: 'mRNA CNMF subtypes'
| Cluster Labels | 1 | 2 | 3 | 4 |
|---|---|---|---|---|
| Number of samples | 154 | 97 | 156 | 118 |
P value = 0.0641 (logrank test), Q value = 0.14
Table S2. Clustering Approach #1: 'mRNA CNMF subtypes' versus Clinical Feature #1: 'Time to Death'
| nPatients | nDeath | Duration Range (Median), Month | |
|---|---|---|---|
| ALL | 525 | 446 | 0.1 - 127.6 (12.2) |
| subtype1 | 154 | 138 | 0.1 - 127.6 (10.7) |
| subtype2 | 97 | 80 | 0.2 - 115.9 (14.2) |
| subtype3 | 156 | 129 | 0.1 - 94.8 (13.8) |
| subtype4 | 118 | 99 | 0.2 - 91.8 (12.5) |
Figure S1. Get High-res Image Clustering Approach #1: 'mRNA CNMF subtypes' versus Clinical Feature #1: 'Time to Death'

P value = 0.0788 (Kruskal-Wallis (anova)), Q value = 0.16
Table S3. Clustering Approach #1: 'mRNA CNMF subtypes' versus Clinical Feature #2: 'YEARS_TO_BIRTH'
| nPatients | Mean (Std.Dev) | |
|---|---|---|
| ALL | 525 | 57.7 (14.6) |
| subtype1 | 154 | 58.4 (12.4) |
| subtype2 | 97 | 54.2 (17.4) |
| subtype3 | 156 | 60.0 (13.3) |
| subtype4 | 118 | 56.5 (15.7) |
Figure S2. Get High-res Image Clustering Approach #1: 'mRNA CNMF subtypes' versus Clinical Feature #2: 'YEARS_TO_BIRTH'

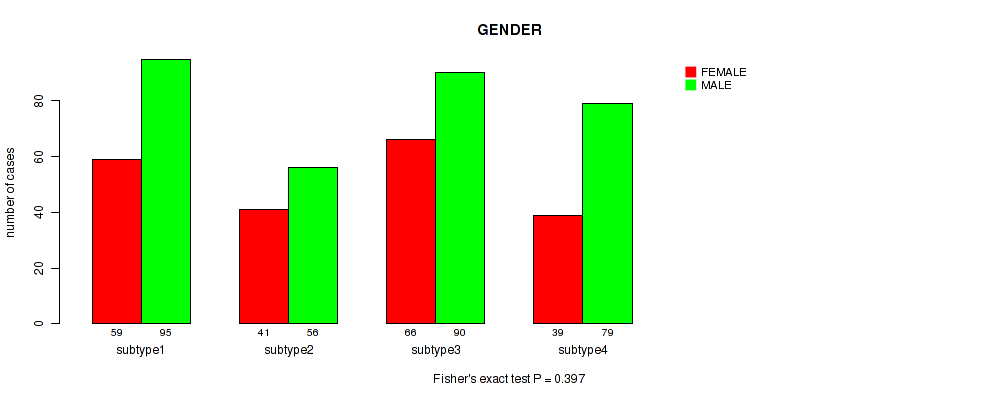
P value = 0.397 (Fisher's exact test), Q value = 0.58
Table S4. Clustering Approach #1: 'mRNA CNMF subtypes' versus Clinical Feature #4: 'GENDER'
| nPatients | FEMALE | MALE |
|---|---|---|
| ALL | 205 | 320 |
| subtype1 | 59 | 95 |
| subtype2 | 41 | 56 |
| subtype3 | 66 | 90 |
| subtype4 | 39 | 79 |
Figure S3. Get High-res Image Clustering Approach #1: 'mRNA CNMF subtypes' versus Clinical Feature #4: 'GENDER'
P value = 0.6 (Kruskal-Wallis (anova)), Q value = 0.77
Table S5. Clustering Approach #1: 'mRNA CNMF subtypes' versus Clinical Feature #5: 'KARNOFSKY_PERFORMANCE_SCORE'
| nPatients | Mean (Std.Dev) | |
|---|---|---|
| ALL | 392 | 77.2 (14.4) |
| subtype1 | 114 | 78.0 (15.5) |
| subtype2 | 75 | 76.5 (11.0) |
| subtype3 | 119 | 76.5 (15.2) |
| subtype4 | 84 | 77.9 (14.5) |
Figure S4. Get High-res Image Clustering Approach #1: 'mRNA CNMF subtypes' versus Clinical Feature #5: 'KARNOFSKY_PERFORMANCE_SCORE'

P value = 0.00404 (Fisher's exact test), Q value = 0.011
Table S6. Clustering Approach #1: 'mRNA CNMF subtypes' versus Clinical Feature #6: 'HISTOLOGICAL_TYPE'
| nPatients | GLIOBLASTOMA MULTIFORME (GBM) | TREATED PRIMARY GBM | UNTREATED PRIMARY (DE NOVO) GBM |
|---|---|---|---|
| ALL | 6 | 20 | 499 |
| subtype1 | 1 | 8 | 145 |
| subtype2 | 0 | 7 | 90 |
| subtype3 | 0 | 4 | 152 |
| subtype4 | 5 | 1 | 112 |
Figure S5. Get High-res Image Clustering Approach #1: 'mRNA CNMF subtypes' versus Clinical Feature #6: 'HISTOLOGICAL_TYPE'

P value = 0.0682 (Fisher's exact test), Q value = 0.14
Table S7. Clustering Approach #1: 'mRNA CNMF subtypes' versus Clinical Feature #7: 'RADIATIONS_RADIATION_REGIMENINDICATION'
| nPatients | NO | YES |
|---|---|---|
| ALL | 360 | 165 |
| subtype1 | 106 | 48 |
| subtype2 | 68 | 29 |
| subtype3 | 116 | 40 |
| subtype4 | 70 | 48 |
Figure S6. Get High-res Image Clustering Approach #1: 'mRNA CNMF subtypes' versus Clinical Feature #7: 'RADIATIONS_RADIATION_REGIMENINDICATION'

P value = 0.833 (Fisher's exact test), Q value = 0.95
Table S8. Clustering Approach #1: 'mRNA CNMF subtypes' versus Clinical Feature #8: 'RACE'
| nPatients | ASIAN | BLACK OR AFRICAN AMERICAN | WHITE |
|---|---|---|---|
| ALL | 13 | 31 | 462 |
| subtype1 | 4 | 12 | 135 |
| subtype2 | 2 | 7 | 84 |
| subtype3 | 5 | 7 | 139 |
| subtype4 | 2 | 5 | 104 |
Figure S7. Get High-res Image Clustering Approach #1: 'mRNA CNMF subtypes' versus Clinical Feature #8: 'RACE'

P value = 0.125 (Fisher's exact test), Q value = 0.24
Table S9. Clustering Approach #1: 'mRNA CNMF subtypes' versus Clinical Feature #9: 'ETHNICITY'
| nPatients | HISPANIC OR LATINO | NOT HISPANIC OR LATINO |
|---|---|---|
| ALL | 12 | 438 |
| subtype1 | 3 | 131 |
| subtype2 | 5 | 68 |
| subtype3 | 3 | 135 |
| subtype4 | 1 | 104 |
Figure S8. Get High-res Image Clustering Approach #1: 'mRNA CNMF subtypes' versus Clinical Feature #9: 'ETHNICITY'
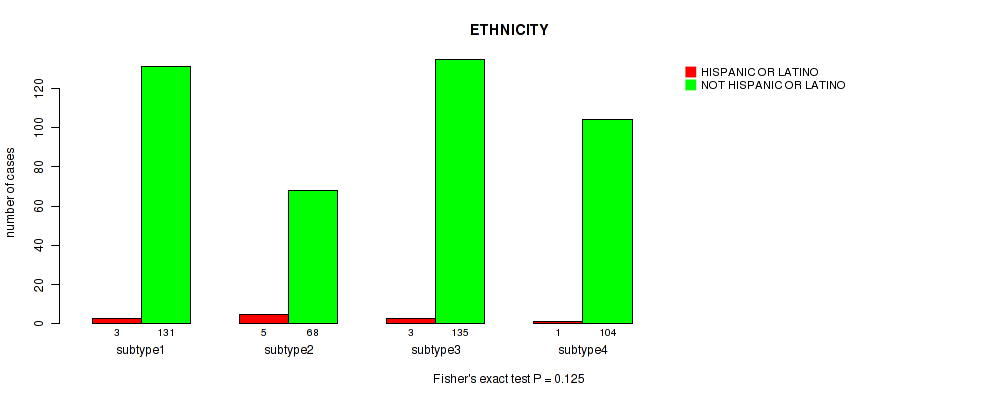
Table S10. Description of clustering approach #2: 'mRNA cHierClus subtypes'
| Cluster Labels | 1 | 2 | 3 | 4 |
|---|---|---|---|---|
| Number of samples | 153 | 107 | 103 | 162 |
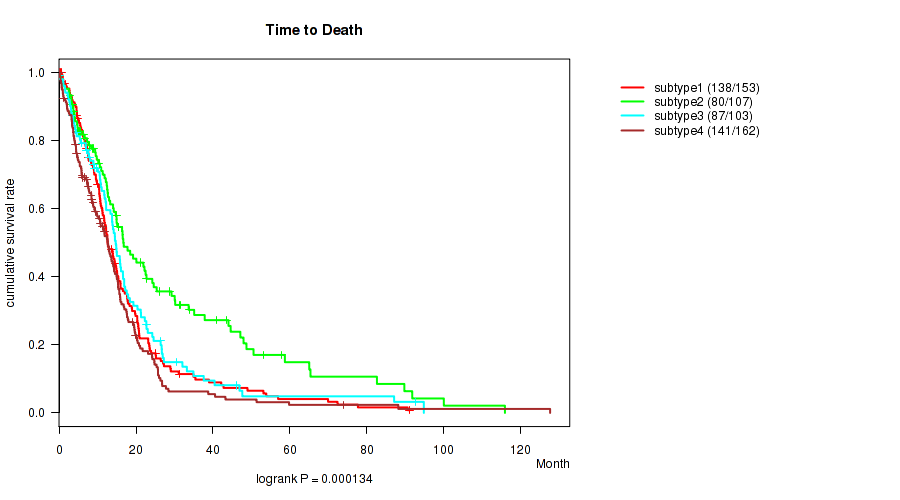
P value = 0.000134 (logrank test), Q value = 0.00044
Table S11. Clustering Approach #2: 'mRNA cHierClus subtypes' versus Clinical Feature #1: 'Time to Death'
| nPatients | nDeath | Duration Range (Median), Month | |
|---|---|---|---|
| ALL | 525 | 446 | 0.1 - 127.6 (12.2) |
| subtype1 | 153 | 138 | 0.1 - 91.0 (12.2) |
| subtype2 | 107 | 80 | 0.2 - 115.9 (14.7) |
| subtype3 | 103 | 87 | 0.1 - 94.8 (13.8) |
| subtype4 | 162 | 141 | 0.1 - 127.6 (10.3) |
Figure S9. Get High-res Image Clustering Approach #2: 'mRNA cHierClus subtypes' versus Clinical Feature #1: 'Time to Death'
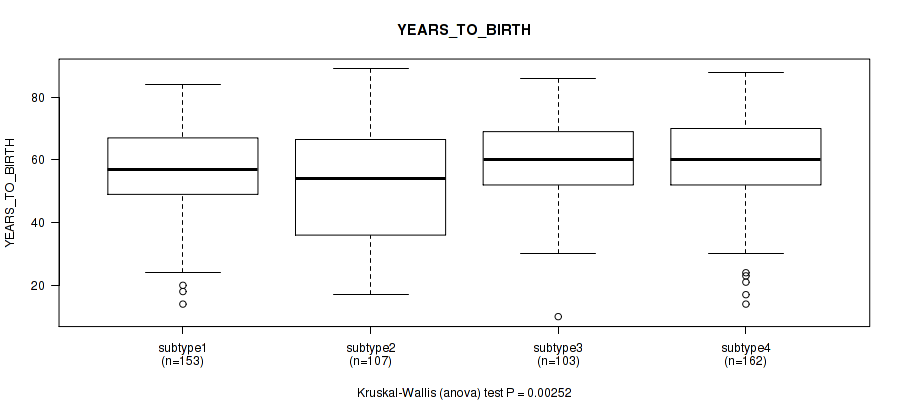
P value = 0.00252 (Kruskal-Wallis (anova)), Q value = 0.0072
Table S12. Clustering Approach #2: 'mRNA cHierClus subtypes' versus Clinical Feature #2: 'YEARS_TO_BIRTH'
| nPatients | Mean (Std.Dev) | |
|---|---|---|
| ALL | 525 | 57.7 (14.6) |
| subtype1 | 153 | 56.9 (13.6) |
| subtype2 | 107 | 52.9 (17.9) |
| subtype3 | 103 | 60.6 (12.1) |
| subtype4 | 162 | 59.8 (13.7) |
Figure S10. Get High-res Image Clustering Approach #2: 'mRNA cHierClus subtypes' versus Clinical Feature #2: 'YEARS_TO_BIRTH'
P value = 0.0898 (Fisher's exact test), Q value = 0.18
Table S13. Clustering Approach #2: 'mRNA cHierClus subtypes' versus Clinical Feature #4: 'GENDER'
| nPatients | FEMALE | MALE |
|---|---|---|
| ALL | 205 | 320 |
| subtype1 | 51 | 102 |
| subtype2 | 44 | 63 |
| subtype3 | 50 | 53 |
| subtype4 | 60 | 102 |
Figure S11. Get High-res Image Clustering Approach #2: 'mRNA cHierClus subtypes' versus Clinical Feature #4: 'GENDER'

P value = 0.509 (Kruskal-Wallis (anova)), Q value = 0.7
Table S14. Clustering Approach #2: 'mRNA cHierClus subtypes' versus Clinical Feature #5: 'KARNOFSKY_PERFORMANCE_SCORE'
| nPatients | Mean (Std.Dev) | |
|---|---|---|
| ALL | 392 | 77.2 (14.4) |
| subtype1 | 117 | 78.5 (14.9) |
| subtype2 | 83 | 77.6 (11.4) |
| subtype3 | 81 | 75.4 (15.5) |
| subtype4 | 111 | 76.9 (14.9) |
Figure S12. Get High-res Image Clustering Approach #2: 'mRNA cHierClus subtypes' versus Clinical Feature #5: 'KARNOFSKY_PERFORMANCE_SCORE'

P value = 0.0296 (Fisher's exact test), Q value = 0.071
Table S15. Clustering Approach #2: 'mRNA cHierClus subtypes' versus Clinical Feature #6: 'HISTOLOGICAL_TYPE'
| nPatients | GLIOBLASTOMA MULTIFORME (GBM) | TREATED PRIMARY GBM | UNTREATED PRIMARY (DE NOVO) GBM |
|---|---|---|---|
| ALL | 6 | 20 | 499 |
| subtype1 | 0 | 11 | 142 |
| subtype2 | 1 | 3 | 103 |
| subtype3 | 0 | 3 | 100 |
| subtype4 | 5 | 3 | 154 |
Figure S13. Get High-res Image Clustering Approach #2: 'mRNA cHierClus subtypes' versus Clinical Feature #6: 'HISTOLOGICAL_TYPE'

P value = 0.0134 (Fisher's exact test), Q value = 0.034
Table S16. Clustering Approach #2: 'mRNA cHierClus subtypes' versus Clinical Feature #7: 'RADIATIONS_RADIATION_REGIMENINDICATION'
| nPatients | NO | YES |
|---|---|---|
| ALL | 360 | 165 |
| subtype1 | 114 | 39 |
| subtype2 | 78 | 29 |
| subtype3 | 73 | 30 |
| subtype4 | 95 | 67 |
Figure S14. Get High-res Image Clustering Approach #2: 'mRNA cHierClus subtypes' versus Clinical Feature #7: 'RADIATIONS_RADIATION_REGIMENINDICATION'

P value = 0.588 (Fisher's exact test), Q value = 0.77
Table S17. Clustering Approach #2: 'mRNA cHierClus subtypes' versus Clinical Feature #8: 'RACE'
| nPatients | ASIAN | BLACK OR AFRICAN AMERICAN | WHITE |
|---|---|---|---|
| ALL | 13 | 31 | 462 |
| subtype1 | 4 | 13 | 130 |
| subtype2 | 4 | 6 | 95 |
| subtype3 | 3 | 4 | 93 |
| subtype4 | 2 | 8 | 144 |
Figure S15. Get High-res Image Clustering Approach #2: 'mRNA cHierClus subtypes' versus Clinical Feature #8: 'RACE'

P value = 0.683 (Fisher's exact test), Q value = 0.83
Table S18. Clustering Approach #2: 'mRNA cHierClus subtypes' versus Clinical Feature #9: 'ETHNICITY'
| nPatients | HISPANIC OR LATINO | NOT HISPANIC OR LATINO |
|---|---|---|
| ALL | 12 | 438 |
| subtype1 | 5 | 124 |
| subtype2 | 1 | 91 |
| subtype3 | 2 | 90 |
| subtype4 | 4 | 133 |
Figure S16. Get High-res Image Clustering Approach #2: 'mRNA cHierClus subtypes' versus Clinical Feature #9: 'ETHNICITY'

Table S19. Description of clustering approach #3: 'miR CNMF subtypes'
| Cluster Labels | 1 | 2 | 3 | 4 |
|---|---|---|---|---|
| Number of samples | 165 | 182 | 90 | 124 |
P value = 0.0042 (logrank test), Q value = 0.011
Table S20. Clustering Approach #3: 'miR CNMF subtypes' versus Clinical Feature #1: 'Time to Death'
| nPatients | nDeath | Duration Range (Median), Month | |
|---|---|---|---|
| ALL | 561 | 462 | 0.1 - 127.6 (11.9) |
| subtype1 | 165 | 140 | 0.1 - 91.0 (11.3) |
| subtype2 | 182 | 147 | 0.1 - 127.6 (13.3) |
| subtype3 | 90 | 72 | 0.4 - 65.3 (9.1) |
| subtype4 | 124 | 103 | 0.1 - 120.6 (12.6) |
Figure S17. Get High-res Image Clustering Approach #3: 'miR CNMF subtypes' versus Clinical Feature #1: 'Time to Death'

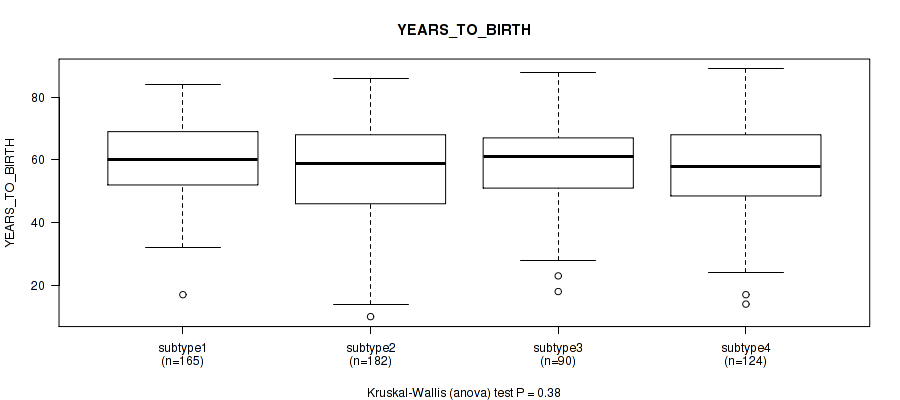
P value = 0.38 (Kruskal-Wallis (anova)), Q value = 0.56
Table S21. Clustering Approach #3: 'miR CNMF subtypes' versus Clinical Feature #2: 'YEARS_TO_BIRTH'
| nPatients | Mean (Std.Dev) | |
|---|---|---|
| ALL | 561 | 57.9 (14.3) |
| subtype1 | 165 | 59.8 (11.6) |
| subtype2 | 182 | 55.7 (16.6) |
| subtype3 | 90 | 58.5 (14.6) |
| subtype4 | 124 | 58.1 (13.6) |
Figure S18. Get High-res Image Clustering Approach #3: 'miR CNMF subtypes' versus Clinical Feature #2: 'YEARS_TO_BIRTH'
P value = 0.649 (Fisher's exact test), Q value = 0.82
Table S22. Clustering Approach #3: 'miR CNMF subtypes' versus Clinical Feature #4: 'GENDER'
| nPatients | FEMALE | MALE |
|---|---|---|
| ALL | 218 | 343 |
| subtype1 | 63 | 102 |
| subtype2 | 76 | 106 |
| subtype3 | 36 | 54 |
| subtype4 | 43 | 81 |
Figure S19. Get High-res Image Clustering Approach #3: 'miR CNMF subtypes' versus Clinical Feature #4: 'GENDER'

P value = 0.882 (Kruskal-Wallis (anova)), Q value = 0.98
Table S23. Clustering Approach #3: 'miR CNMF subtypes' versus Clinical Feature #5: 'KARNOFSKY_PERFORMANCE_SCORE'
| nPatients | Mean (Std.Dev) | |
|---|---|---|
| ALL | 424 | 77.5 (14.5) |
| subtype1 | 127 | 76.6 (15.3) |
| subtype2 | 131 | 77.3 (14.6) |
| subtype3 | 73 | 78.2 (13.6) |
| subtype4 | 93 | 78.4 (14.2) |
Figure S20. Get High-res Image Clustering Approach #3: 'miR CNMF subtypes' versus Clinical Feature #5: 'KARNOFSKY_PERFORMANCE_SCORE'

P value = 0.362 (Fisher's exact test), Q value = 0.54
Table S24. Clustering Approach #3: 'miR CNMF subtypes' versus Clinical Feature #6: 'HISTOLOGICAL_TYPE'
| nPatients | GLIOBLASTOMA MULTIFORME (GBM) | TREATED PRIMARY GBM | UNTREATED PRIMARY (DE NOVO) GBM |
|---|---|---|---|
| ALL | 9 | 20 | 532 |
| subtype1 | 2 | 4 | 159 |
| subtype2 | 1 | 8 | 173 |
| subtype3 | 3 | 5 | 82 |
| subtype4 | 3 | 3 | 118 |
Figure S21. Get High-res Image Clustering Approach #3: 'miR CNMF subtypes' versus Clinical Feature #6: 'HISTOLOGICAL_TYPE'

P value = 0.418 (Fisher's exact test), Q value = 0.59
Table S25. Clustering Approach #3: 'miR CNMF subtypes' versus Clinical Feature #7: 'RADIATIONS_RADIATION_REGIMENINDICATION'
| nPatients | NO | YES |
|---|---|---|
| ALL | 389 | 172 |
| subtype1 | 118 | 47 |
| subtype2 | 131 | 51 |
| subtype3 | 57 | 33 |
| subtype4 | 83 | 41 |
Figure S22. Get High-res Image Clustering Approach #3: 'miR CNMF subtypes' versus Clinical Feature #7: 'RADIATIONS_RADIATION_REGIMENINDICATION'

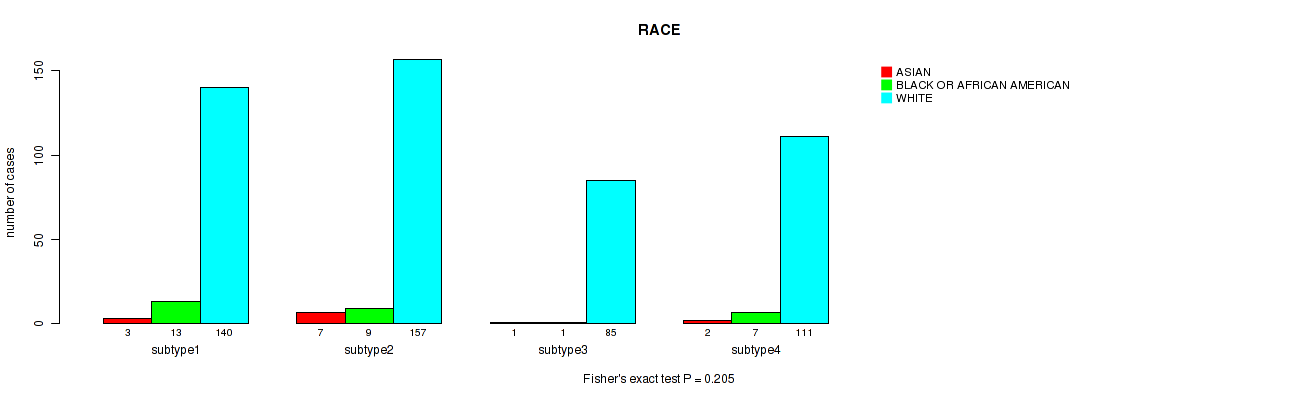
P value = 0.205 (Fisher's exact test), Q value = 0.35
Table S26. Clustering Approach #3: 'miR CNMF subtypes' versus Clinical Feature #8: 'RACE'
| nPatients | ASIAN | BLACK OR AFRICAN AMERICAN | WHITE |
|---|---|---|---|
| ALL | 13 | 30 | 493 |
| subtype1 | 3 | 13 | 140 |
| subtype2 | 7 | 9 | 157 |
| subtype3 | 1 | 1 | 85 |
| subtype4 | 2 | 7 | 111 |
Figure S23. Get High-res Image Clustering Approach #3: 'miR CNMF subtypes' versus Clinical Feature #8: 'RACE'
P value = 0.855 (Fisher's exact test), Q value = 0.96
Table S27. Clustering Approach #3: 'miR CNMF subtypes' versus Clinical Feature #9: 'ETHNICITY'
| nPatients | HISPANIC OR LATINO | NOT HISPANIC OR LATINO |
|---|---|---|
| ALL | 12 | 459 |
| subtype1 | 5 | 134 |
| subtype2 | 4 | 153 |
| subtype3 | 1 | 71 |
| subtype4 | 2 | 101 |
Figure S24. Get High-res Image Clustering Approach #3: 'miR CNMF subtypes' versus Clinical Feature #9: 'ETHNICITY'

Table S28. Description of clustering approach #4: 'miR cHierClus subtypes'
| Cluster Labels | 1 | 2 | 3 |
|---|---|---|---|
| Number of samples | 302 | 129 | 130 |
P value = 0.165 (logrank test), Q value = 0.29
Table S29. Clustering Approach #4: 'miR cHierClus subtypes' versus Clinical Feature #1: 'Time to Death'
| nPatients | nDeath | Duration Range (Median), Month | |
|---|---|---|---|
| ALL | 561 | 462 | 0.1 - 127.6 (11.9) |
| subtype1 | 302 | 249 | 0.1 - 120.6 (12.5) |
| subtype2 | 129 | 106 | 0.1 - 92.7 (10.6) |
| subtype3 | 130 | 107 | 0.1 - 127.6 (12.0) |
Figure S25. Get High-res Image Clustering Approach #4: 'miR cHierClus subtypes' versus Clinical Feature #1: 'Time to Death'

P value = 0.127 (Kruskal-Wallis (anova)), Q value = 0.24
Table S30. Clustering Approach #4: 'miR cHierClus subtypes' versus Clinical Feature #2: 'YEARS_TO_BIRTH'
| nPatients | Mean (Std.Dev) | |
|---|---|---|
| ALL | 561 | 57.9 (14.3) |
| subtype1 | 302 | 56.5 (15.9) |
| subtype2 | 129 | 59.0 (11.5) |
| subtype3 | 130 | 60.0 (12.5) |
Figure S26. Get High-res Image Clustering Approach #4: 'miR cHierClus subtypes' versus Clinical Feature #2: 'YEARS_TO_BIRTH'

P value = 0.151 (Fisher's exact test), Q value = 0.28
Table S31. Clustering Approach #4: 'miR cHierClus subtypes' versus Clinical Feature #4: 'GENDER'
| nPatients | FEMALE | MALE |
|---|---|---|
| ALL | 218 | 343 |
| subtype1 | 110 | 192 |
| subtype2 | 48 | 81 |
| subtype3 | 60 | 70 |
Figure S27. Get High-res Image Clustering Approach #4: 'miR cHierClus subtypes' versus Clinical Feature #4: 'GENDER'

P value = 0.571 (Kruskal-Wallis (anova)), Q value = 0.75
Table S32. Clustering Approach #4: 'miR cHierClus subtypes' versus Clinical Feature #5: 'KARNOFSKY_PERFORMANCE_SCORE'
| nPatients | Mean (Std.Dev) | |
|---|---|---|
| ALL | 424 | 77.5 (14.5) |
| subtype1 | 225 | 78.4 (13.6) |
| subtype2 | 100 | 76.9 (15.4) |
| subtype3 | 99 | 76.0 (15.6) |
Figure S28. Get High-res Image Clustering Approach #4: 'miR cHierClus subtypes' versus Clinical Feature #5: 'KARNOFSKY_PERFORMANCE_SCORE'

P value = 0.284 (Fisher's exact test), Q value = 0.46
Table S33. Clustering Approach #4: 'miR cHierClus subtypes' versus Clinical Feature #6: 'HISTOLOGICAL_TYPE'
| nPatients | GLIOBLASTOMA MULTIFORME (GBM) | TREATED PRIMARY GBM | UNTREATED PRIMARY (DE NOVO) GBM |
|---|---|---|---|
| ALL | 9 | 20 | 532 |
| subtype1 | 6 | 13 | 283 |
| subtype2 | 3 | 2 | 124 |
| subtype3 | 0 | 5 | 125 |
Figure S29. Get High-res Image Clustering Approach #4: 'miR cHierClus subtypes' versus Clinical Feature #6: 'HISTOLOGICAL_TYPE'

P value = 0.977 (Fisher's exact test), Q value = 1
Table S34. Clustering Approach #4: 'miR cHierClus subtypes' versus Clinical Feature #7: 'RADIATIONS_RADIATION_REGIMENINDICATION'
| nPatients | NO | YES |
|---|---|---|
| ALL | 389 | 172 |
| subtype1 | 208 | 94 |
| subtype2 | 90 | 39 |
| subtype3 | 91 | 39 |
Figure S30. Get High-res Image Clustering Approach #4: 'miR cHierClus subtypes' versus Clinical Feature #7: 'RADIATIONS_RADIATION_REGIMENINDICATION'

P value = 0.193 (Fisher's exact test), Q value = 0.34
Table S35. Clustering Approach #4: 'miR cHierClus subtypes' versus Clinical Feature #8: 'RACE'
| nPatients | ASIAN | BLACK OR AFRICAN AMERICAN | WHITE |
|---|---|---|---|
| ALL | 13 | 30 | 493 |
| subtype1 | 7 | 10 | 272 |
| subtype2 | 3 | 11 | 113 |
| subtype3 | 3 | 9 | 108 |
Figure S31. Get High-res Image Clustering Approach #4: 'miR cHierClus subtypes' versus Clinical Feature #8: 'RACE'

P value = 0.675 (Fisher's exact test), Q value = 0.83
Table S36. Clustering Approach #4: 'miR cHierClus subtypes' versus Clinical Feature #9: 'ETHNICITY'
| nPatients | HISPANIC OR LATINO | NOT HISPANIC OR LATINO |
|---|---|---|
| ALL | 12 | 459 |
| subtype1 | 6 | 249 |
| subtype2 | 2 | 109 |
| subtype3 | 4 | 101 |
Figure S32. Get High-res Image Clustering Approach #4: 'miR cHierClus subtypes' versus Clinical Feature #9: 'ETHNICITY'
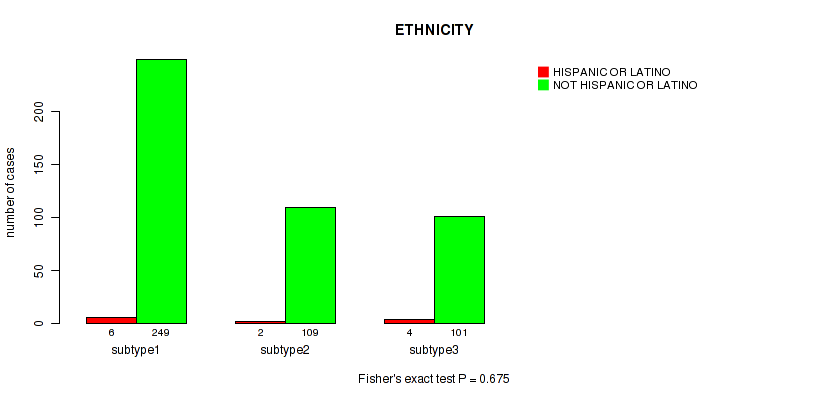
Table S37. Description of clustering approach #5: 'Copy Number Ratio CNMF subtypes'
| Cluster Labels | 1 | 2 | 3 |
|---|---|---|---|
| Number of samples | 520 | 507 | 15 |
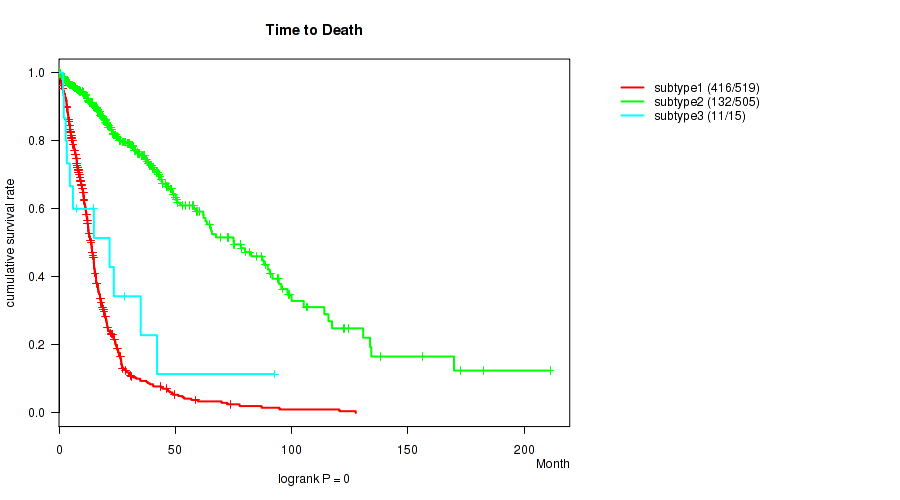
P value = 0 (logrank test), Q value = 0
Table S38. Clustering Approach #5: 'Copy Number Ratio CNMF subtypes' versus Clinical Feature #1: 'Time to Death'
| nPatients | nDeath | Duration Range (Median), Month | |
|---|---|---|---|
| ALL | 1039 | 559 | 0.0 - 211.2 (14.8) |
| subtype1 | 519 | 416 | 0.1 - 127.6 (11.7) |
| subtype2 | 505 | 132 | 0.0 - 211.2 (19.0) |
| subtype3 | 15 | 11 | 1.8 - 92.7 (14.9) |
Figure S33. Get High-res Image Clustering Approach #5: 'Copy Number Ratio CNMF subtypes' versus Clinical Feature #1: 'Time to Death'
P value = 1.62e-72 (Kruskal-Wallis (anova)), Q value = 2.9e-71
Table S39. Clustering Approach #5: 'Copy Number Ratio CNMF subtypes' versus Clinical Feature #2: 'YEARS_TO_BIRTH'
| nPatients | Mean (Std.Dev) | |
|---|---|---|
| ALL | 1041 | 51.1 (15.8) |
| subtype1 | 520 | 59.8 (12.0) |
| subtype2 | 506 | 42.1 (14.2) |
| subtype3 | 15 | 54.1 (15.7) |
Figure S34. Get High-res Image Clustering Approach #5: 'Copy Number Ratio CNMF subtypes' versus Clinical Feature #2: 'YEARS_TO_BIRTH'

P value = 1e-05 (Fisher's exact test), Q value = 3.5e-05
Table S40. Clustering Approach #5: 'Copy Number Ratio CNMF subtypes' versus Clinical Feature #3: 'PRIMARY_SITE_OF_DISEASE'
| nPatients | BRAIN | CENTRAL NERVOUS SYSTEM |
|---|---|---|
| ALL | 570 | 472 |
| subtype1 | 465 | 55 |
| subtype2 | 92 | 415 |
| subtype3 | 13 | 2 |
Figure S35. Get High-res Image Clustering Approach #5: 'Copy Number Ratio CNMF subtypes' versus Clinical Feature #3: 'PRIMARY_SITE_OF_DISEASE'

P value = 0.336 (Fisher's exact test), Q value = 0.52
Table S41. Clustering Approach #5: 'Copy Number Ratio CNMF subtypes' versus Clinical Feature #4: 'GENDER'
| nPatients | FEMALE | MALE |
|---|---|---|
| ALL | 430 | 612 |
| subtype1 | 203 | 317 |
| subtype2 | 221 | 286 |
| subtype3 | 6 | 9 |
Figure S36. Get High-res Image Clustering Approach #5: 'Copy Number Ratio CNMF subtypes' versus Clinical Feature #4: 'GENDER'

P value = 3.59e-19 (Kruskal-Wallis (anova)), Q value = 3.9e-18
Table S42. Clustering Approach #5: 'Copy Number Ratio CNMF subtypes' versus Clinical Feature #5: 'KARNOFSKY_PERFORMANCE_SCORE'
| nPatients | Mean (Std.Dev) | |
|---|---|---|
| ALL | 689 | 81.5 (14.6) |
| subtype1 | 375 | 77.2 (15.2) |
| subtype2 | 303 | 86.8 (11.8) |
| subtype3 | 11 | 82.7 (14.2) |
Figure S37. Get High-res Image Clustering Approach #5: 'Copy Number Ratio CNMF subtypes' versus Clinical Feature #5: 'KARNOFSKY_PERFORMANCE_SCORE'

P value = 1e-05 (Fisher's exact test), Q value = 3.5e-05
Table S43. Clustering Approach #5: 'Copy Number Ratio CNMF subtypes' versus Clinical Feature #6: 'HISTOLOGICAL_TYPE'
| nPatients | ASTROCYTOMA | GLIOBLASTOMA MULTIFORME (GBM) | OLIGOASTROCYTOMA | OLIGODENDROGLIOMA | TREATED PRIMARY GBM | UNTREATED PRIMARY (DE NOVO) GBM |
|---|---|---|---|---|---|---|
| ALL | 176 | 27 | 118 | 178 | 18 | 525 |
| subtype1 | 34 | 18 | 11 | 10 | 10 | 437 |
| subtype2 | 140 | 9 | 107 | 168 | 7 | 76 |
| subtype3 | 2 | 0 | 0 | 0 | 1 | 12 |
Figure S38. Get High-res Image Clustering Approach #5: 'Copy Number Ratio CNMF subtypes' versus Clinical Feature #6: 'HISTOLOGICAL_TYPE'

P value = 1e-05 (Fisher's exact test), Q value = 3.5e-05
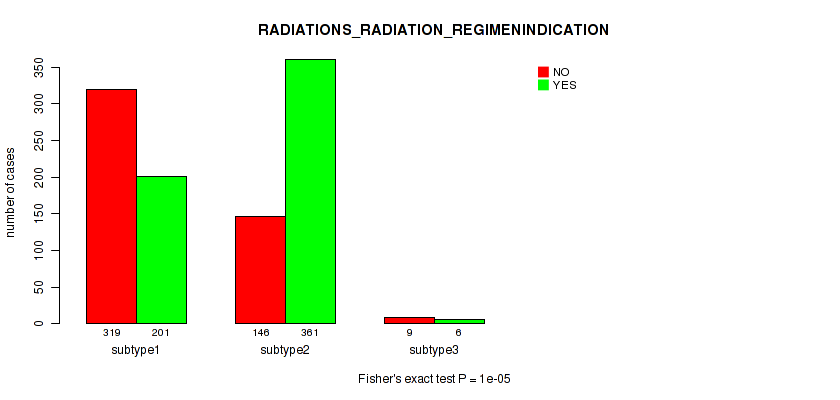
Table S44. Clustering Approach #5: 'Copy Number Ratio CNMF subtypes' versus Clinical Feature #7: 'RADIATIONS_RADIATION_REGIMENINDICATION'
| nPatients | NO | YES |
|---|---|---|
| ALL | 474 | 568 |
| subtype1 | 319 | 201 |
| subtype2 | 146 | 361 |
| subtype3 | 9 | 6 |
Figure S39. Get High-res Image Clustering Approach #5: 'Copy Number Ratio CNMF subtypes' versus Clinical Feature #7: 'RADIATIONS_RADIATION_REGIMENINDICATION'
P value = 0.013 (Fisher's exact test), Q value = 0.033
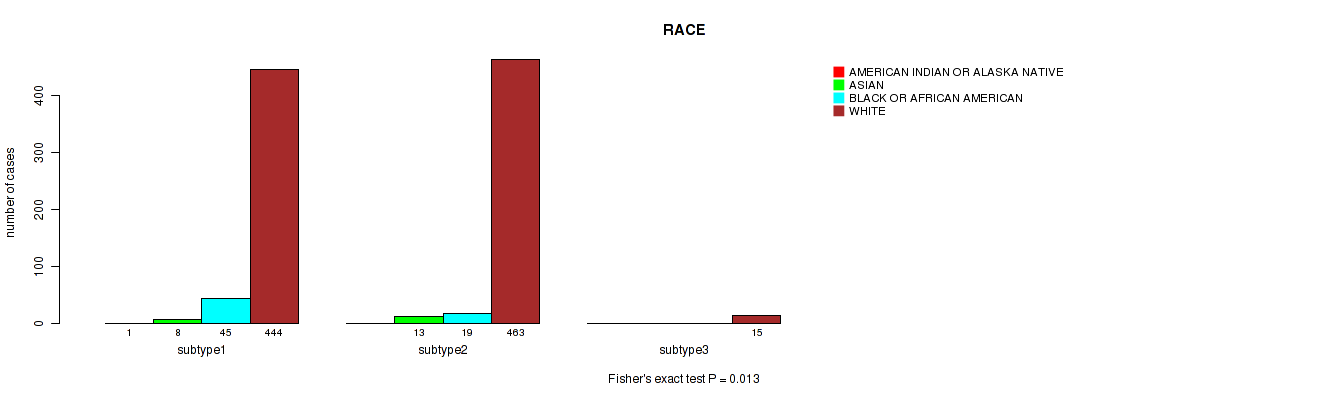
Table S45. Clustering Approach #5: 'Copy Number Ratio CNMF subtypes' versus Clinical Feature #8: 'RACE'
| nPatients | AMERICAN INDIAN OR ALASKA NATIVE | ASIAN | BLACK OR AFRICAN AMERICAN | WHITE |
|---|---|---|---|---|
| ALL | 1 | 21 | 64 | 922 |
| subtype1 | 1 | 8 | 45 | 444 |
| subtype2 | 0 | 13 | 19 | 463 |
| subtype3 | 0 | 0 | 0 | 15 |
Figure S40. Get High-res Image Clustering Approach #5: 'Copy Number Ratio CNMF subtypes' versus Clinical Feature #8: 'RACE'
P value = 0.0419 (Fisher's exact test), Q value = 0.094
Table S46. Clustering Approach #5: 'Copy Number Ratio CNMF subtypes' versus Clinical Feature #9: 'ETHNICITY'
| nPatients | HISPANIC OR LATINO | NOT HISPANIC OR LATINO |
|---|---|---|
| ALL | 30 | 891 |
| subtype1 | 8 | 432 |
| subtype2 | 22 | 446 |
| subtype3 | 0 | 13 |
Figure S41. Get High-res Image Clustering Approach #5: 'Copy Number Ratio CNMF subtypes' versus Clinical Feature #9: 'ETHNICITY'
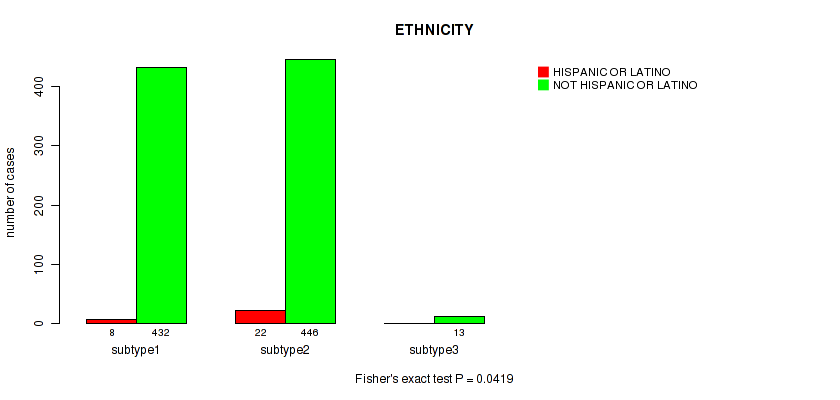
Table S47. Description of clustering approach #6: 'METHLYATION CNMF'
| Cluster Labels | 1 | 2 | 3 | 4 |
|---|---|---|---|---|
| Number of samples | 176 | 219 | 61 | 154 |
P value = 0 (logrank test), Q value = 0
Table S48. Clustering Approach #6: 'METHLYATION CNMF' versus Clinical Feature #1: 'Time to Death'
| nPatients | nDeath | Duration Range (Median), Month | |
|---|---|---|---|
| ALL | 607 | 180 | 0.0 - 211.2 (16.3) |
| subtype1 | 175 | 104 | 0.2 - 211.2 (10.7) |
| subtype2 | 218 | 37 | 0.0 - 172.8 (20.4) |
| subtype3 | 61 | 21 | 0.1 - 133.7 (15.3) |
| subtype4 | 153 | 18 | 0.1 - 182.3 (19.9) |
Figure S42. Get High-res Image Clustering Approach #6: 'METHLYATION CNMF' versus Clinical Feature #1: 'Time to Death'

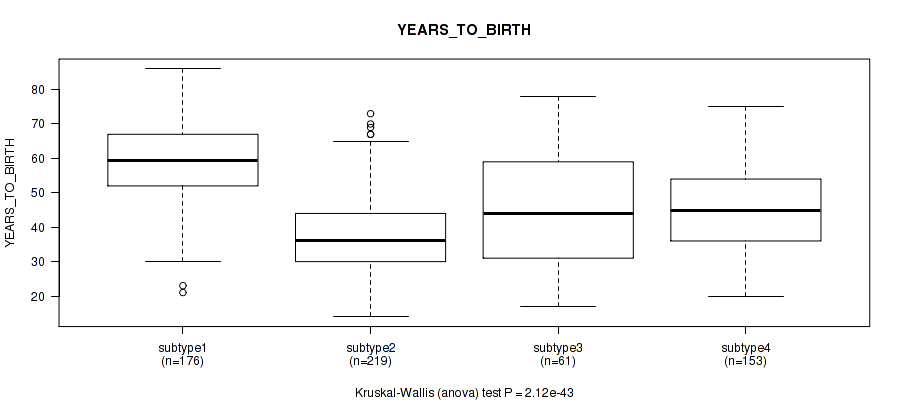
P value = 2.12e-43 (Kruskal-Wallis (anova)), Q value = 3.3e-42
Table S49. Clustering Approach #6: 'METHLYATION CNMF' versus Clinical Feature #2: 'YEARS_TO_BIRTH'
| nPatients | Mean (Std.Dev) | |
|---|---|---|
| ALL | 609 | 46.7 (15.0) |
| subtype1 | 176 | 59.4 (11.7) |
| subtype2 | 219 | 38.0 (11.3) |
| subtype3 | 61 | 44.4 (16.8) |
| subtype4 | 153 | 45.5 (12.3) |
Figure S43. Get High-res Image Clustering Approach #6: 'METHLYATION CNMF' versus Clinical Feature #2: 'YEARS_TO_BIRTH'
P value = 1e-05 (Fisher's exact test), Q value = 3.5e-05
Table S50. Clustering Approach #6: 'METHLYATION CNMF' versus Clinical Feature #3: 'PRIMARY_SITE_OF_DISEASE'
| nPatients | BRAIN | CENTRAL NERVOUS SYSTEM |
|---|---|---|
| ALL | 135 | 475 |
| subtype1 | 117 | 59 |
| subtype2 | 8 | 211 |
| subtype3 | 10 | 51 |
| subtype4 | 0 | 154 |
Figure S44. Get High-res Image Clustering Approach #6: 'METHLYATION CNMF' versus Clinical Feature #3: 'PRIMARY_SITE_OF_DISEASE'

P value = 0.917 (Fisher's exact test), Q value = 1
Table S51. Clustering Approach #6: 'METHLYATION CNMF' versus Clinical Feature #4: 'GENDER'
| nPatients | FEMALE | MALE |
|---|---|---|
| ALL | 265 | 345 |
| subtype1 | 76 | 100 |
| subtype2 | 93 | 126 |
| subtype3 | 29 | 32 |
| subtype4 | 67 | 87 |
Figure S45. Get High-res Image Clustering Approach #6: 'METHLYATION CNMF' versus Clinical Feature #4: 'GENDER'

P value = 1.14e-10 (Kruskal-Wallis (anova)), Q value = 8.2e-10
Table S52. Clustering Approach #6: 'METHLYATION CNMF' versus Clinical Feature #5: 'KARNOFSKY_PERFORMANCE_SCORE'
| nPatients | Mean (Std.Dev) | |
|---|---|---|
| ALL | 365 | 85.2 (13.6) |
| subtype1 | 117 | 78.8 (15.1) |
| subtype2 | 134 | 89.0 (11.4) |
| subtype3 | 29 | 82.4 (12.4) |
| subtype4 | 85 | 88.7 (11.7) |
Figure S46. Get High-res Image Clustering Approach #6: 'METHLYATION CNMF' versus Clinical Feature #5: 'KARNOFSKY_PERFORMANCE_SCORE'
P value = 1e-05 (Fisher's exact test), Q value = 3.5e-05
Table S53. Clustering Approach #6: 'METHLYATION CNMF' versus Clinical Feature #6: 'HISTOLOGICAL_TYPE'
| nPatients | ASTROCYTOMA | GLIOBLASTOMA MULTIFORME (GBM) | OLIGOASTROCYTOMA | OLIGODENDROGLIOMA | TREATED PRIMARY GBM | UNTREATED PRIMARY (DE NOVO) GBM |
|---|---|---|---|---|---|---|
| ALL | 176 | 18 | 119 | 180 | 1 | 116 |
| subtype1 | 37 | 13 | 10 | 12 | 1 | 103 |
| subtype2 | 114 | 3 | 65 | 32 | 0 | 5 |
| subtype3 | 20 | 2 | 14 | 17 | 0 | 8 |
| subtype4 | 5 | 0 | 30 | 119 | 0 | 0 |
Figure S47. Get High-res Image Clustering Approach #6: 'METHLYATION CNMF' versus Clinical Feature #6: 'HISTOLOGICAL_TYPE'

P value = 1e-05 (Fisher's exact test), Q value = 3.5e-05
Table S54. Clustering Approach #6: 'METHLYATION CNMF' versus Clinical Feature #7: 'RADIATIONS_RADIATION_REGIMENINDICATION'
| nPatients | NO | YES |
|---|---|---|
| ALL | 177 | 433 |
| subtype1 | 89 | 87 |
| subtype2 | 56 | 163 |
| subtype3 | 12 | 49 |
| subtype4 | 20 | 134 |
Figure S48. Get High-res Image Clustering Approach #6: 'METHLYATION CNMF' versus Clinical Feature #7: 'RADIATIONS_RADIATION_REGIMENINDICATION'

P value = 0.00023 (Fisher's exact test), Q value = 0.00071
Table S55. Clustering Approach #6: 'METHLYATION CNMF' versus Clinical Feature #8: 'RACE'
| nPatients | AMERICAN INDIAN OR ALASKA NATIVE | ASIAN | BLACK OR AFRICAN AMERICAN | WHITE |
|---|---|---|---|---|
| ALL | 1 | 8 | 38 | 545 |
| subtype1 | 0 | 2 | 23 | 144 |
| subtype2 | 0 | 2 | 7 | 207 |
| subtype3 | 1 | 0 | 4 | 54 |
| subtype4 | 0 | 4 | 4 | 140 |
Figure S49. Get High-res Image Clustering Approach #6: 'METHLYATION CNMF' versus Clinical Feature #8: 'RACE'

P value = 0.663 (Fisher's exact test), Q value = 0.82
Table S56. Clustering Approach #6: 'METHLYATION CNMF' versus Clinical Feature #9: 'ETHNICITY'
| nPatients | HISPANIC OR LATINO | NOT HISPANIC OR LATINO |
|---|---|---|
| ALL | 19 | 514 |
| subtype1 | 3 | 130 |
| subtype2 | 8 | 196 |
| subtype3 | 3 | 51 |
| subtype4 | 5 | 137 |
Figure S50. Get High-res Image Clustering Approach #6: 'METHLYATION CNMF' versus Clinical Feature #9: 'ETHNICITY'

Table S57. Description of clustering approach #7: 'RNAseq CNMF subtypes'
| Cluster Labels | 1 | 2 | 3 |
|---|---|---|---|
| Number of samples | 230 | 216 | 181 |
P value = 0 (logrank test), Q value = 0
Table S58. Clustering Approach #7: 'RNAseq CNMF subtypes' versus Clinical Feature #1: 'Time to Death'
| nPatients | nDeath | Duration Range (Median), Month | |
|---|---|---|---|
| ALL | 625 | 212 | 0.0 - 211.2 (16.2) |
| subtype1 | 229 | 150 | 0.1 - 211.2 (12.2) |
| subtype2 | 216 | 33 | 0.0 - 182.3 (20.8) |
| subtype3 | 180 | 29 | 0.1 - 172.8 (20.0) |
Figure S51. Get High-res Image Clustering Approach #7: 'RNAseq CNMF subtypes' versus Clinical Feature #1: 'Time to Death'
P value = 1.2e-31 (Kruskal-Wallis (anova)), Q value = 1.4e-30
Table S59. Clustering Approach #7: 'RNAseq CNMF subtypes' versus Clinical Feature #2: 'YEARS_TO_BIRTH'
| nPatients | Mean (Std.Dev) | |
|---|---|---|
| ALL | 626 | 47.1 (15.3) |
| subtype1 | 230 | 56.4 (14.4) |
| subtype2 | 216 | 39.6 (11.6) |
| subtype3 | 180 | 44.1 (14.2) |
Figure S52. Get High-res Image Clustering Approach #7: 'RNAseq CNMF subtypes' versus Clinical Feature #2: 'YEARS_TO_BIRTH'

P value = 1e-05 (Fisher's exact test), Q value = 3.5e-05
Table S60. Clustering Approach #7: 'RNAseq CNMF subtypes' versus Clinical Feature #3: 'PRIMARY_SITE_OF_DISEASE'
| nPatients | BRAIN | CENTRAL NERVOUS SYSTEM |
|---|---|---|
| ALL | 152 | 475 |
| subtype1 | 147 | 83 |
| subtype2 | 2 | 214 |
| subtype3 | 3 | 178 |
Figure S53. Get High-res Image Clustering Approach #7: 'RNAseq CNMF subtypes' versus Clinical Feature #3: 'PRIMARY_SITE_OF_DISEASE'
P value = 0.207 (Fisher's exact test), Q value = 0.35
Table S61. Clustering Approach #7: 'RNAseq CNMF subtypes' versus Clinical Feature #4: 'GENDER'
| nPatients | FEMALE | MALE |
|---|---|---|
| ALL | 261 | 366 |
| subtype1 | 93 | 137 |
| subtype2 | 83 | 133 |
| subtype3 | 85 | 96 |
Figure S54. Get High-res Image Clustering Approach #7: 'RNAseq CNMF subtypes' versus Clinical Feature #4: 'GENDER'
P value = 7.94e-19 (Kruskal-Wallis (anova)), Q value = 7.8e-18
Table S62. Clustering Approach #7: 'RNAseq CNMF subtypes' versus Clinical Feature #5: 'KARNOFSKY_PERFORMANCE_SCORE'
| nPatients | Mean (Std.Dev) | |
|---|---|---|
| ALL | 383 | 84.2 (13.8) |
| subtype1 | 160 | 77.6 (14.2) |
| subtype2 | 126 | 90.9 (10.0) |
| subtype3 | 97 | 86.3 (12.8) |
Figure S55. Get High-res Image Clustering Approach #7: 'RNAseq CNMF subtypes' versus Clinical Feature #5: 'KARNOFSKY_PERFORMANCE_SCORE'
P value = 1e-05 (Fisher's exact test), Q value = 3.5e-05
Table S63. Clustering Approach #7: 'RNAseq CNMF subtypes' versus Clinical Feature #6: 'HISTOLOGICAL_TYPE'
| nPatients | ASTROCYTOMA | GLIOBLASTOMA MULTIFORME (GBM) | OLIGOASTROCYTOMA | OLIGODENDROGLIOMA | TREATED PRIMARY GBM | UNTREATED PRIMARY (DE NOVO) GBM |
|---|---|---|---|---|---|---|
| ALL | 176 | 1 | 119 | 180 | 1 | 150 |
| subtype1 | 57 | 0 | 13 | 13 | 1 | 146 |
| subtype2 | 77 | 1 | 65 | 72 | 0 | 1 |
| subtype3 | 42 | 0 | 41 | 95 | 0 | 3 |
Figure S56. Get High-res Image Clustering Approach #7: 'RNAseq CNMF subtypes' versus Clinical Feature #6: 'HISTOLOGICAL_TYPE'
P value = 1e-05 (Fisher's exact test), Q value = 3.5e-05
Table S64. Clustering Approach #7: 'RNAseq CNMF subtypes' versus Clinical Feature #7: 'RADIATIONS_RADIATION_REGIMENINDICATION'
| nPatients | NO | YES |
|---|---|---|
| ALL | 194 | 433 |
| subtype1 | 113 | 117 |
| subtype2 | 51 | 165 |
| subtype3 | 30 | 151 |
Figure S57. Get High-res Image Clustering Approach #7: 'RNAseq CNMF subtypes' versus Clinical Feature #7: 'RADIATIONS_RADIATION_REGIMENINDICATION'
P value = 0.347 (Fisher's exact test), Q value = 0.53
Table S65. Clustering Approach #7: 'RNAseq CNMF subtypes' versus Clinical Feature #8: 'RACE'
| nPatients | AMERICAN INDIAN OR ALASKA NATIVE | ASIAN | BLACK OR AFRICAN AMERICAN | WHITE |
|---|---|---|---|---|
| ALL | 1 | 13 | 25 | 576 |
| subtype1 | 1 | 6 | 14 | 207 |
| subtype2 | 0 | 4 | 5 | 202 |
| subtype3 | 0 | 3 | 6 | 167 |
Figure S58. Get High-res Image Clustering Approach #7: 'RNAseq CNMF subtypes' versus Clinical Feature #8: 'RACE'
P value = 0.505 (Fisher's exact test), Q value = 0.7
Table S66. Clustering Approach #7: 'RNAseq CNMF subtypes' versus Clinical Feature #9: 'ETHNICITY'
| nPatients | HISPANIC OR LATINO | NOT HISPANIC OR LATINO |
|---|---|---|
| ALL | 21 | 547 |
| subtype1 | 5 | 197 |
| subtype2 | 9 | 188 |
| subtype3 | 7 | 162 |
Figure S59. Get High-res Image Clustering Approach #7: 'RNAseq CNMF subtypes' versus Clinical Feature #9: 'ETHNICITY'
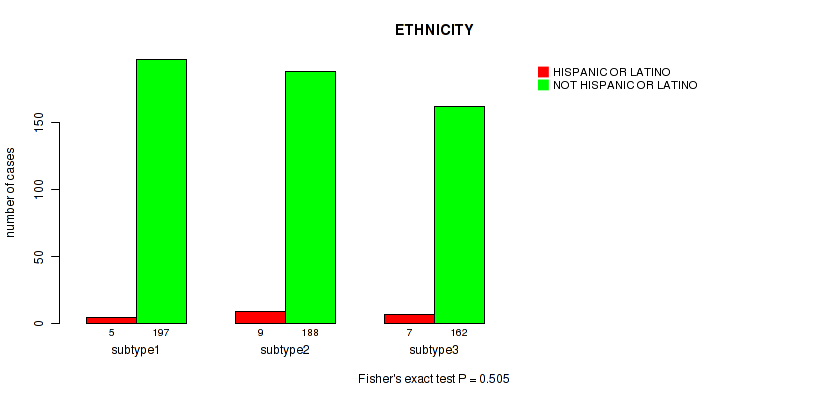
Table S67. Description of clustering approach #8: 'RNAseq cHierClus subtypes'
| Cluster Labels | 1 | 2 | 3 |
|---|---|---|---|
| Number of samples | 202 | 176 | 249 |
P value = 0 (logrank test), Q value = 0
Table S68. Clustering Approach #8: 'RNAseq cHierClus subtypes' versus Clinical Feature #1: 'Time to Death'
| nPatients | nDeath | Duration Range (Median), Month | |
|---|---|---|---|
| ALL | 625 | 212 | 0.0 - 211.2 (16.2) |
| subtype1 | 202 | 143 | 0.1 - 133.7 (11.1) |
| subtype2 | 175 | 31 | 0.0 - 211.2 (20.8) |
| subtype3 | 248 | 38 | 0.1 - 182.3 (19.7) |
Figure S60. Get High-res Image Clustering Approach #8: 'RNAseq cHierClus subtypes' versus Clinical Feature #1: 'Time to Death'

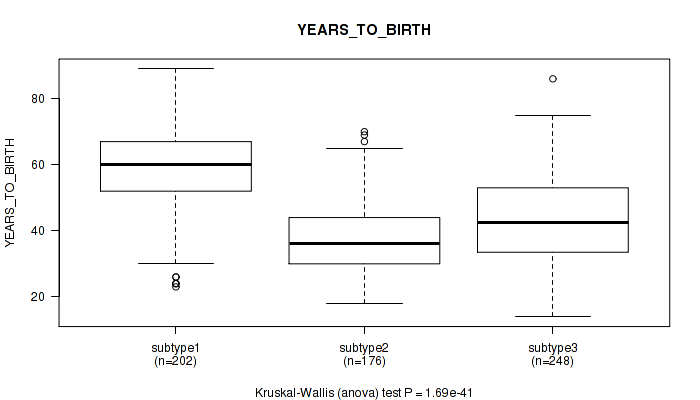
P value = 1.69e-41 (Kruskal-Wallis (anova)), Q value = 2.3e-40
Table S69. Clustering Approach #8: 'RNAseq cHierClus subtypes' versus Clinical Feature #2: 'YEARS_TO_BIRTH'
| nPatients | Mean (Std.Dev) | |
|---|---|---|
| ALL | 626 | 47.1 (15.3) |
| subtype1 | 202 | 58.8 (13.0) |
| subtype2 | 176 | 38.3 (11.3) |
| subtype3 | 248 | 43.8 (13.5) |
Figure S61. Get High-res Image Clustering Approach #8: 'RNAseq cHierClus subtypes' versus Clinical Feature #2: 'YEARS_TO_BIRTH'
P value = 1e-05 (Fisher's exact test), Q value = 3.5e-05
Table S70. Clustering Approach #8: 'RNAseq cHierClus subtypes' versus Clinical Feature #3: 'PRIMARY_SITE_OF_DISEASE'
| nPatients | BRAIN | CENTRAL NERVOUS SYSTEM |
|---|---|---|
| ALL | 152 | 475 |
| subtype1 | 139 | 63 |
| subtype2 | 9 | 167 |
| subtype3 | 4 | 245 |
Figure S62. Get High-res Image Clustering Approach #8: 'RNAseq cHierClus subtypes' versus Clinical Feature #3: 'PRIMARY_SITE_OF_DISEASE'

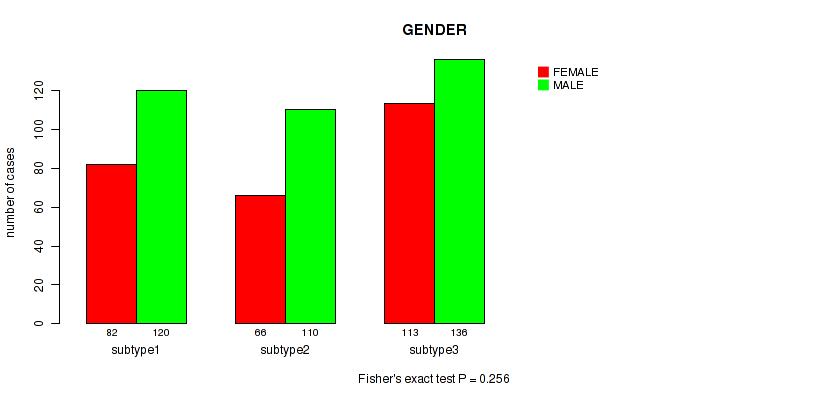
P value = 0.256 (Fisher's exact test), Q value = 0.42
Table S71. Clustering Approach #8: 'RNAseq cHierClus subtypes' versus Clinical Feature #4: 'GENDER'
| nPatients | FEMALE | MALE |
|---|---|---|
| ALL | 261 | 366 |
| subtype1 | 82 | 120 |
| subtype2 | 66 | 110 |
| subtype3 | 113 | 136 |
Figure S63. Get High-res Image Clustering Approach #8: 'RNAseq cHierClus subtypes' versus Clinical Feature #4: 'GENDER'
P value = 1.05e-15 (Kruskal-Wallis (anova)), Q value = 9.4e-15
Table S72. Clustering Approach #8: 'RNAseq cHierClus subtypes' versus Clinical Feature #5: 'KARNOFSKY_PERFORMANCE_SCORE'
| nPatients | Mean (Std.Dev) | |
|---|---|---|
| ALL | 383 | 84.2 (13.8) |
| subtype1 | 139 | 77.0 (14.6) |
| subtype2 | 108 | 89.3 (10.8) |
| subtype3 | 136 | 87.5 (12.1) |
Figure S64. Get High-res Image Clustering Approach #8: 'RNAseq cHierClus subtypes' versus Clinical Feature #5: 'KARNOFSKY_PERFORMANCE_SCORE'

P value = 1e-05 (Fisher's exact test), Q value = 3.5e-05
Table S73. Clustering Approach #8: 'RNAseq cHierClus subtypes' versus Clinical Feature #6: 'HISTOLOGICAL_TYPE'
| nPatients | ASTROCYTOMA | GLIOBLASTOMA MULTIFORME (GBM) | OLIGOASTROCYTOMA | OLIGODENDROGLIOMA | TREATED PRIMARY GBM | UNTREATED PRIMARY (DE NOVO) GBM |
|---|---|---|---|---|---|---|
| ALL | 176 | 1 | 119 | 180 | 1 | 150 |
| subtype1 | 40 | 0 | 12 | 11 | 1 | 138 |
| subtype2 | 92 | 1 | 48 | 27 | 0 | 8 |
| subtype3 | 44 | 0 | 59 | 142 | 0 | 4 |
Figure S65. Get High-res Image Clustering Approach #8: 'RNAseq cHierClus subtypes' versus Clinical Feature #6: 'HISTOLOGICAL_TYPE'

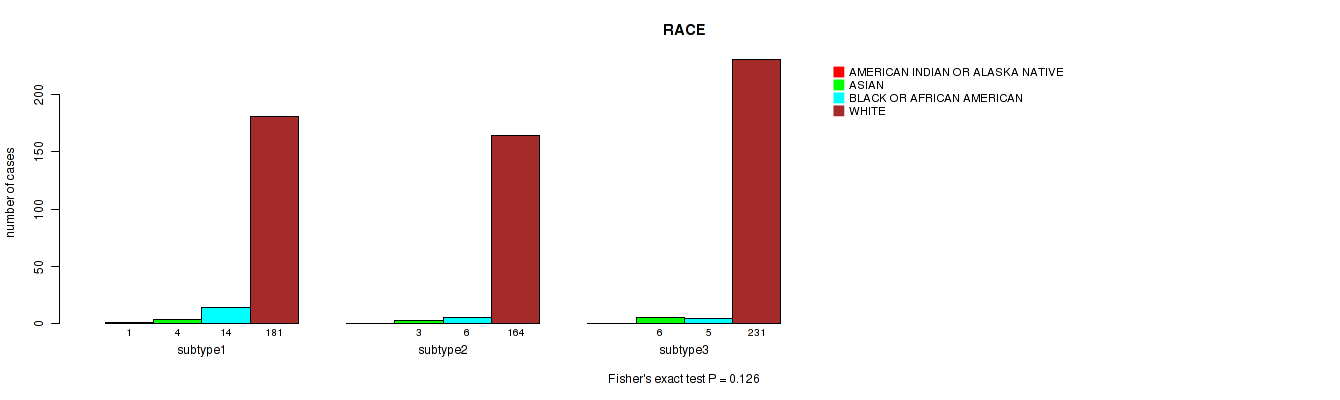
P value = 1e-05 (Fisher's exact test), Q value = 3.5e-05
Table S74. Clustering Approach #8: 'RNAseq cHierClus subtypes' versus Clinical Feature #7: 'RADIATIONS_RADIATION_REGIMENINDICATION'
| nPatients | NO | YES |
|---|---|---|
| ALL | 194 | 433 |
| subtype1 | 103 | 99 |
| subtype2 | 51 | 125 |
| subtype3 | 40 | 209 |
Figure S66. Get High-res Image Clustering Approach #8: 'RNAseq cHierClus subtypes' versus Clinical Feature #7: 'RADIATIONS_RADIATION_REGIMENINDICATION'

P value = 0.126 (Fisher's exact test), Q value = 0.24
Table S75. Clustering Approach #8: 'RNAseq cHierClus subtypes' versus Clinical Feature #8: 'RACE'
| nPatients | AMERICAN INDIAN OR ALASKA NATIVE | ASIAN | BLACK OR AFRICAN AMERICAN | WHITE |
|---|---|---|---|---|
| ALL | 1 | 13 | 25 | 576 |
| subtype1 | 1 | 4 | 14 | 181 |
| subtype2 | 0 | 3 | 6 | 164 |
| subtype3 | 0 | 6 | 5 | 231 |
Figure S67. Get High-res Image Clustering Approach #8: 'RNAseq cHierClus subtypes' versus Clinical Feature #8: 'RACE'
P value = 0.818 (Fisher's exact test), Q value = 0.95
Table S76. Clustering Approach #8: 'RNAseq cHierClus subtypes' versus Clinical Feature #9: 'ETHNICITY'
| nPatients | HISPANIC OR LATINO | NOT HISPANIC OR LATINO |
|---|---|---|
| ALL | 21 | 547 |
| subtype1 | 5 | 169 |
| subtype2 | 7 | 157 |
| subtype3 | 9 | 221 |
Figure S68. Get High-res Image Clustering Approach #8: 'RNAseq cHierClus subtypes' versus Clinical Feature #9: 'ETHNICITY'
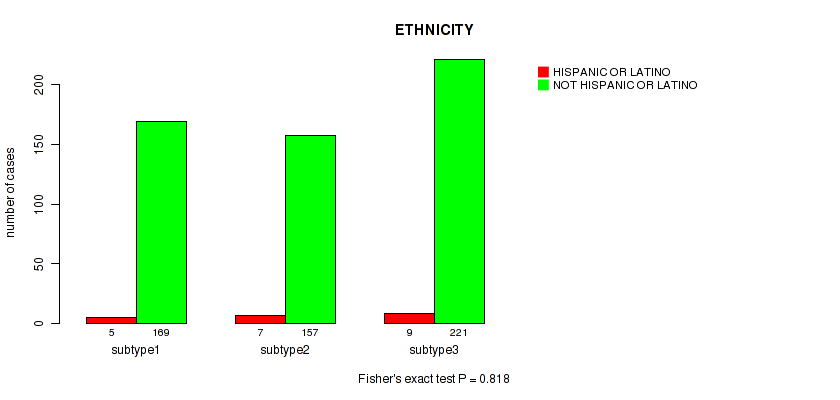
Table S77. Description of clustering approach #9: 'MIRSEQ CNMF'
| Cluster Labels | 1 | 2 | 3 | 4 |
|---|---|---|---|---|
| Number of samples | 124 | 103 | 172 | 72 |
P value = 0.042 (logrank test), Q value = 0.094
Table S78. Clustering Approach #9: 'MIRSEQ CNMF' versus Clinical Feature #1: 'Time to Death'
| nPatients | nDeath | Duration Range (Median), Month | |
|---|---|---|---|
| ALL | 469 | 93 | 0.0 - 211.2 (18.7) |
| subtype1 | 123 | 23 | 0.0 - 122.5 (18.6) |
| subtype2 | 103 | 32 | 0.1 - 211.2 (19.6) |
| subtype3 | 171 | 26 | 0.1 - 156.2 (17.4) |
| subtype4 | 72 | 12 | 0.1 - 182.3 (20.8) |
Figure S69. Get High-res Image Clustering Approach #9: 'MIRSEQ CNMF' versus Clinical Feature #1: 'Time to Death'

P value = 0.652 (Kruskal-Wallis (anova)), Q value = 0.82
Table S79. Clustering Approach #9: 'MIRSEQ CNMF' versus Clinical Feature #2: 'YEARS_TO_BIRTH'
| nPatients | Mean (Std.Dev) | |
|---|---|---|
| ALL | 470 | 43.0 (13.5) |
| subtype1 | 124 | 42.0 (13.5) |
| subtype2 | 103 | 42.8 (13.2) |
| subtype3 | 171 | 43.4 (13.8) |
| subtype4 | 72 | 44.2 (13.2) |
Figure S70. Get High-res Image Clustering Approach #9: 'MIRSEQ CNMF' versus Clinical Feature #2: 'YEARS_TO_BIRTH'

P value = 0.707 (Fisher's exact test), Q value = 0.84
Table S80. Clustering Approach #9: 'MIRSEQ CNMF' versus Clinical Feature #4: 'GENDER'
| nPatients | FEMALE | MALE |
|---|---|---|
| ALL | 208 | 263 |
| subtype1 | 51 | 73 |
| subtype2 | 43 | 60 |
| subtype3 | 81 | 91 |
| subtype4 | 33 | 39 |
Figure S71. Get High-res Image Clustering Approach #9: 'MIRSEQ CNMF' versus Clinical Feature #4: 'GENDER'

P value = 0.0232 (Kruskal-Wallis (anova)), Q value = 0.057
Table S81. Clustering Approach #9: 'MIRSEQ CNMF' versus Clinical Feature #5: 'KARNOFSKY_PERFORMANCE_SCORE'
| nPatients | Mean (Std.Dev) | |
|---|---|---|
| ALL | 268 | 87.7 (12.0) |
| subtype1 | 70 | 89.9 (10.4) |
| subtype2 | 66 | 84.7 (12.6) |
| subtype3 | 93 | 87.5 (12.4) |
| subtype4 | 39 | 89.5 (12.1) |
Figure S72. Get High-res Image Clustering Approach #9: 'MIRSEQ CNMF' versus Clinical Feature #5: 'KARNOFSKY_PERFORMANCE_SCORE'

P value = 1e-05 (Fisher's exact test), Q value = 3.5e-05
Table S82. Clustering Approach #9: 'MIRSEQ CNMF' versus Clinical Feature #6: 'HISTOLOGICAL_TYPE'
| nPatients | ASTROCYTOMA | OLIGOASTROCYTOMA | OLIGODENDROGLIOMA |
|---|---|---|---|
| ALL | 175 | 116 | 180 |
| subtype1 | 61 | 33 | 30 |
| subtype2 | 62 | 22 | 19 |
| subtype3 | 48 | 46 | 78 |
| subtype4 | 4 | 15 | 53 |
Figure S73. Get High-res Image Clustering Approach #9: 'MIRSEQ CNMF' versus Clinical Feature #6: 'HISTOLOGICAL_TYPE'

P value = 0.316 (Fisher's exact test), Q value = 0.49
Table S83. Clustering Approach #9: 'MIRSEQ CNMF' versus Clinical Feature #7: 'RADIATIONS_RADIATION_REGIMENINDICATION'
| nPatients | NO | YES |
|---|---|---|
| ALL | 91 | 380 |
| subtype1 | 26 | 98 |
| subtype2 | 25 | 78 |
| subtype3 | 30 | 142 |
| subtype4 | 10 | 62 |
Figure S74. Get High-res Image Clustering Approach #9: 'MIRSEQ CNMF' versus Clinical Feature #7: 'RADIATIONS_RADIATION_REGIMENINDICATION'

P value = 0.106 (Fisher's exact test), Q value = 0.21
Table S84. Clustering Approach #9: 'MIRSEQ CNMF' versus Clinical Feature #8: 'RACE'
| nPatients | AMERICAN INDIAN OR ALASKA NATIVE | ASIAN | BLACK OR AFRICAN AMERICAN | WHITE |
|---|---|---|---|---|
| ALL | 1 | 8 | 15 | 436 |
| subtype1 | 1 | 1 | 8 | 111 |
| subtype2 | 0 | 2 | 2 | 97 |
| subtype3 | 0 | 2 | 5 | 162 |
| subtype4 | 0 | 3 | 0 | 66 |
Figure S75. Get High-res Image Clustering Approach #9: 'MIRSEQ CNMF' versus Clinical Feature #8: 'RACE'

P value = 0.825 (Fisher's exact test), Q value = 0.95
Table S85. Clustering Approach #9: 'MIRSEQ CNMF' versus Clinical Feature #9: 'ETHNICITY'
| nPatients | HISPANIC OR LATINO | NOT HISPANIC OR LATINO |
|---|---|---|
| ALL | 18 | 418 |
| subtype1 | 5 | 110 |
| subtype2 | 4 | 90 |
| subtype3 | 8 | 156 |
| subtype4 | 1 | 62 |
Figure S76. Get High-res Image Clustering Approach #9: 'MIRSEQ CNMF' versus Clinical Feature #9: 'ETHNICITY'

Table S86. Description of clustering approach #10: 'MIRSEQ CHIERARCHICAL'
| Cluster Labels | 1 | 2 | 3 |
|---|---|---|---|
| Number of samples | 202 | 172 | 97 |
P value = 1.14e-11 (logrank test), Q value = 9.5e-11
Table S87. Clustering Approach #10: 'MIRSEQ CHIERARCHICAL' versus Clinical Feature #1: 'Time to Death'
| nPatients | nDeath | Duration Range (Median), Month | |
|---|---|---|---|
| ALL | 469 | 93 | 0.0 - 211.2 (18.7) |
| subtype1 | 201 | 34 | 0.0 - 182.3 (23.2) |
| subtype2 | 171 | 23 | 0.1 - 172.8 (18.9) |
| subtype3 | 97 | 36 | 0.1 - 211.2 (14.5) |
Figure S77. Get High-res Image Clustering Approach #10: 'MIRSEQ CHIERARCHICAL' versus Clinical Feature #1: 'Time to Death'

P value = 8.83e-08 (Kruskal-Wallis (anova)), Q value = 6e-07
Table S88. Clustering Approach #10: 'MIRSEQ CHIERARCHICAL' versus Clinical Feature #2: 'YEARS_TO_BIRTH'
| nPatients | Mean (Std.Dev) | |
|---|---|---|
| ALL | 470 | 43.0 (13.5) |
| subtype1 | 202 | 40.0 (11.7) |
| subtype2 | 171 | 42.7 (13.8) |
| subtype3 | 97 | 49.9 (14.0) |
Figure S78. Get High-res Image Clustering Approach #10: 'MIRSEQ CHIERARCHICAL' versus Clinical Feature #2: 'YEARS_TO_BIRTH'

P value = 0.231 (Fisher's exact test), Q value = 0.38
Table S89. Clustering Approach #10: 'MIRSEQ CHIERARCHICAL' versus Clinical Feature #4: 'GENDER'
| nPatients | FEMALE | MALE |
|---|---|---|
| ALL | 208 | 263 |
| subtype1 | 80 | 122 |
| subtype2 | 82 | 90 |
| subtype3 | 46 | 51 |
Figure S79. Get High-res Image Clustering Approach #10: 'MIRSEQ CHIERARCHICAL' versus Clinical Feature #4: 'GENDER'

P value = 0.000327 (Kruskal-Wallis (anova)), Q value = 0.00098
Table S90. Clustering Approach #10: 'MIRSEQ CHIERARCHICAL' versus Clinical Feature #5: 'KARNOFSKY_PERFORMANCE_SCORE'
| nPatients | Mean (Std.Dev) | |
|---|---|---|
| ALL | 268 | 87.7 (12.0) |
| subtype1 | 122 | 90.2 (10.3) |
| subtype2 | 92 | 87.4 (12.7) |
| subtype3 | 54 | 82.8 (12.9) |
Figure S80. Get High-res Image Clustering Approach #10: 'MIRSEQ CHIERARCHICAL' versus Clinical Feature #5: 'KARNOFSKY_PERFORMANCE_SCORE'

P value = 1e-05 (Fisher's exact test), Q value = 3.5e-05
Table S91. Clustering Approach #10: 'MIRSEQ CHIERARCHICAL' versus Clinical Feature #6: 'HISTOLOGICAL_TYPE'
| nPatients | ASTROCYTOMA | OLIGOASTROCYTOMA | OLIGODENDROGLIOMA |
|---|---|---|---|
| ALL | 175 | 116 | 180 |
| subtype1 | 68 | 60 | 74 |
| subtype2 | 43 | 40 | 89 |
| subtype3 | 64 | 16 | 17 |
Figure S81. Get High-res Image Clustering Approach #10: 'MIRSEQ CHIERARCHICAL' versus Clinical Feature #6: 'HISTOLOGICAL_TYPE'

P value = 0.411 (Fisher's exact test), Q value = 0.58
Table S92. Clustering Approach #10: 'MIRSEQ CHIERARCHICAL' versus Clinical Feature #7: 'RADIATIONS_RADIATION_REGIMENINDICATION'
| nPatients | NO | YES |
|---|---|---|
| ALL | 91 | 380 |
| subtype1 | 44 | 158 |
| subtype2 | 28 | 144 |
| subtype3 | 19 | 78 |
Figure S82. Get High-res Image Clustering Approach #10: 'MIRSEQ CHIERARCHICAL' versus Clinical Feature #7: 'RADIATIONS_RADIATION_REGIMENINDICATION'

P value = 0.559 (Fisher's exact test), Q value = 0.74
Table S93. Clustering Approach #10: 'MIRSEQ CHIERARCHICAL' versus Clinical Feature #8: 'RACE'
| nPatients | AMERICAN INDIAN OR ALASKA NATIVE | ASIAN | BLACK OR AFRICAN AMERICAN | WHITE |
|---|---|---|---|---|
| ALL | 1 | 8 | 15 | 436 |
| subtype1 | 0 | 3 | 5 | 189 |
| subtype2 | 0 | 3 | 5 | 159 |
| subtype3 | 1 | 2 | 5 | 88 |
Figure S83. Get High-res Image Clustering Approach #10: 'MIRSEQ CHIERARCHICAL' versus Clinical Feature #8: 'RACE'

P value = 1 (Fisher's exact test), Q value = 1
Table S94. Clustering Approach #10: 'MIRSEQ CHIERARCHICAL' versus Clinical Feature #9: 'ETHNICITY'
| nPatients | HISPANIC OR LATINO | NOT HISPANIC OR LATINO |
|---|---|---|
| ALL | 18 | 418 |
| subtype1 | 8 | 177 |
| subtype2 | 7 | 154 |
| subtype3 | 3 | 87 |
Figure S84. Get High-res Image Clustering Approach #10: 'MIRSEQ CHIERARCHICAL' versus Clinical Feature #9: 'ETHNICITY'

Table S95. Description of clustering approach #11: 'MIRseq Mature CNMF subtypes'
| Cluster Labels | 1 | 2 | 3 |
|---|---|---|---|
| Number of samples | 173 | 143 | 152 |
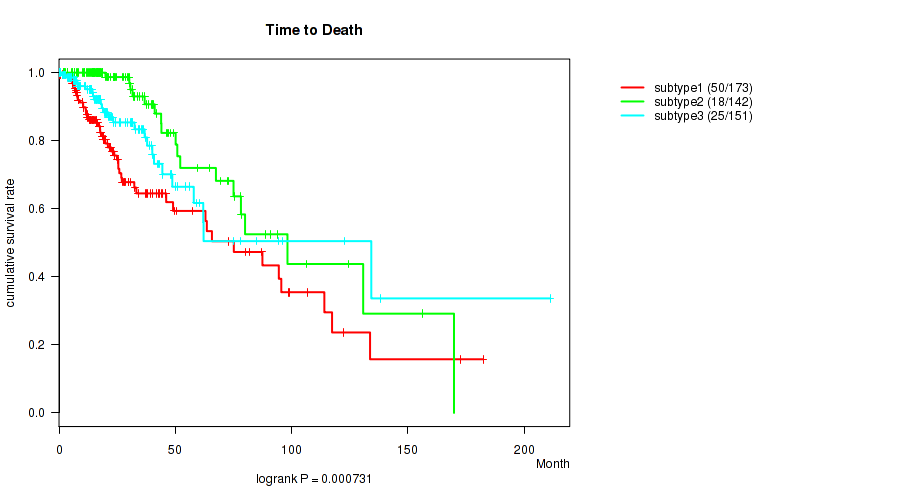
P value = 0.000731 (logrank test), Q value = 0.0021
Table S96. Clustering Approach #11: 'MIRseq Mature CNMF subtypes' versus Clinical Feature #1: 'Time to Death'
| nPatients | nDeath | Duration Range (Median), Month | |
|---|---|---|---|
| ALL | 466 | 93 | 0.0 - 211.2 (18.7) |
| subtype1 | 173 | 50 | 0.0 - 182.3 (17.6) |
| subtype2 | 142 | 18 | 0.1 - 169.8 (21.8) |
| subtype3 | 151 | 25 | 0.1 - 211.2 (17.9) |
Figure S85. Get High-res Image Clustering Approach #11: 'MIRseq Mature CNMF subtypes' versus Clinical Feature #1: 'Time to Death'
P value = 0.163 (Kruskal-Wallis (anova)), Q value = 0.29
Table S97. Clustering Approach #11: 'MIRseq Mature CNMF subtypes' versus Clinical Feature #2: 'YEARS_TO_BIRTH'
| nPatients | Mean (Std.Dev) | |
|---|---|---|
| ALL | 467 | 43.1 (13.5) |
| subtype1 | 173 | 44.1 (14.4) |
| subtype2 | 143 | 41.0 (11.8) |
| subtype3 | 151 | 43.9 (13.8) |
Figure S86. Get High-res Image Clustering Approach #11: 'MIRseq Mature CNMF subtypes' versus Clinical Feature #2: 'YEARS_TO_BIRTH'

P value = 0.0321 (Fisher's exact test), Q value = 0.075
Table S98. Clustering Approach #11: 'MIRseq Mature CNMF subtypes' versus Clinical Feature #4: 'GENDER'
| nPatients | FEMALE | MALE |
|---|---|---|
| ALL | 208 | 260 |
| subtype1 | 64 | 109 |
| subtype2 | 66 | 77 |
| subtype3 | 78 | 74 |
Figure S87. Get High-res Image Clustering Approach #11: 'MIRseq Mature CNMF subtypes' versus Clinical Feature #4: 'GENDER'

P value = 0.0535 (Kruskal-Wallis (anova)), Q value = 0.12
Table S99. Clustering Approach #11: 'MIRseq Mature CNMF subtypes' versus Clinical Feature #5: 'KARNOFSKY_PERFORMANCE_SCORE'
| nPatients | Mean (Std.Dev) | |
|---|---|---|
| ALL | 267 | 87.8 (12.0) |
| subtype1 | 89 | 87.9 (11.2) |
| subtype2 | 93 | 89.9 (10.9) |
| subtype3 | 85 | 85.4 (13.5) |
Figure S88. Get High-res Image Clustering Approach #11: 'MIRseq Mature CNMF subtypes' versus Clinical Feature #5: 'KARNOFSKY_PERFORMANCE_SCORE'

P value = 8e-05 (Fisher's exact test), Q value = 0.00027
Table S100. Clustering Approach #11: 'MIRseq Mature CNMF subtypes' versus Clinical Feature #6: 'HISTOLOGICAL_TYPE'
| nPatients | ASTROCYTOMA | OLIGOASTROCYTOMA | OLIGODENDROGLIOMA |
|---|---|---|---|
| ALL | 174 | 115 | 179 |
| subtype1 | 86 | 42 | 45 |
| subtype2 | 46 | 34 | 63 |
| subtype3 | 42 | 39 | 71 |
Figure S89. Get High-res Image Clustering Approach #11: 'MIRseq Mature CNMF subtypes' versus Clinical Feature #6: 'HISTOLOGICAL_TYPE'

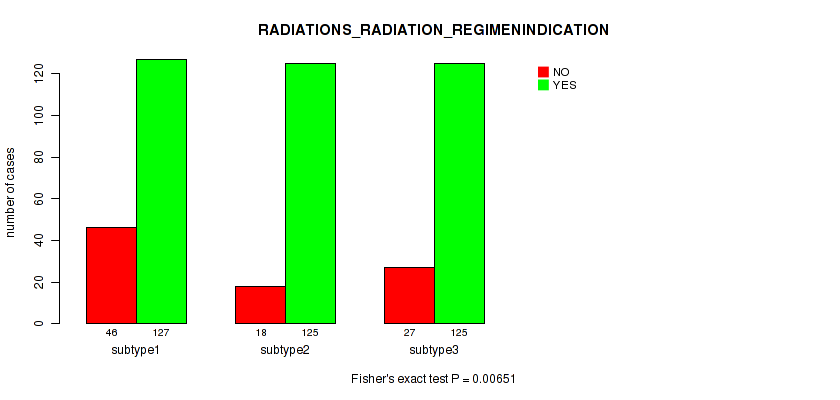
P value = 0.00651 (Fisher's exact test), Q value = 0.017
Table S101. Clustering Approach #11: 'MIRseq Mature CNMF subtypes' versus Clinical Feature #7: 'RADIATIONS_RADIATION_REGIMENINDICATION'
| nPatients | NO | YES |
|---|---|---|
| ALL | 91 | 377 |
| subtype1 | 46 | 127 |
| subtype2 | 18 | 125 |
| subtype3 | 27 | 125 |
Figure S90. Get High-res Image Clustering Approach #11: 'MIRseq Mature CNMF subtypes' versus Clinical Feature #7: 'RADIATIONS_RADIATION_REGIMENINDICATION'
P value = 0.739 (Fisher's exact test), Q value = 0.87
Table S102. Clustering Approach #11: 'MIRseq Mature CNMF subtypes' versus Clinical Feature #8: 'RACE'
| nPatients | AMERICAN INDIAN OR ALASKA NATIVE | ASIAN | BLACK OR AFRICAN AMERICAN | WHITE |
|---|---|---|---|---|
| ALL | 1 | 8 | 15 | 433 |
| subtype1 | 1 | 2 | 7 | 159 |
| subtype2 | 0 | 4 | 3 | 131 |
| subtype3 | 0 | 2 | 5 | 143 |
Figure S91. Get High-res Image Clustering Approach #11: 'MIRseq Mature CNMF subtypes' versus Clinical Feature #8: 'RACE'

P value = 0.408 (Fisher's exact test), Q value = 0.58
Table S103. Clustering Approach #11: 'MIRseq Mature CNMF subtypes' versus Clinical Feature #9: 'ETHNICITY'
| nPatients | HISPANIC OR LATINO | NOT HISPANIC OR LATINO |
|---|---|---|
| ALL | 18 | 415 |
| subtype1 | 5 | 155 |
| subtype2 | 8 | 120 |
| subtype3 | 5 | 140 |
Figure S92. Get High-res Image Clustering Approach #11: 'MIRseq Mature CNMF subtypes' versus Clinical Feature #9: 'ETHNICITY'

Table S104. Description of clustering approach #12: 'MIRseq Mature cHierClus subtypes'
| Cluster Labels | 1 | 2 | 3 | 4 |
|---|---|---|---|---|
| Number of samples | 83 | 125 | 178 | 82 |
P value = 0 (logrank test), Q value = 0
Table S105. Clustering Approach #12: 'MIRseq Mature cHierClus subtypes' versus Clinical Feature #1: 'Time to Death'
| nPatients | nDeath | Duration Range (Median), Month | |
|---|---|---|---|
| ALL | 466 | 93 | 0.0 - 211.2 (18.7) |
| subtype1 | 82 | 12 | 0.0 - 122.5 (22.1) |
| subtype2 | 125 | 16 | 0.1 - 172.8 (21.4) |
| subtype3 | 177 | 27 | 0.1 - 211.2 (19.6) |
| subtype4 | 82 | 38 | 0.1 - 133.7 (13.2) |
Figure S93. Get High-res Image Clustering Approach #12: 'MIRseq Mature cHierClus subtypes' versus Clinical Feature #1: 'Time to Death'

P value = 1.51e-11 (Kruskal-Wallis (anova)), Q value = 1.2e-10
Table S106. Clustering Approach #12: 'MIRseq Mature cHierClus subtypes' versus Clinical Feature #2: 'YEARS_TO_BIRTH'
| nPatients | Mean (Std.Dev) | |
|---|---|---|
| ALL | 467 | 43.1 (13.5) |
| subtype1 | 83 | 36.6 (11.4) |
| subtype2 | 125 | 42.7 (12.0) |
| subtype3 | 177 | 42.1 (13.0) |
| subtype4 | 82 | 52.2 (14.1) |
Figure S94. Get High-res Image Clustering Approach #12: 'MIRseq Mature cHierClus subtypes' versus Clinical Feature #2: 'YEARS_TO_BIRTH'

P value = 0.0626 (Fisher's exact test), Q value = 0.14
Table S107. Clustering Approach #12: 'MIRseq Mature cHierClus subtypes' versus Clinical Feature #4: 'GENDER'
| nPatients | FEMALE | MALE |
|---|---|---|
| ALL | 208 | 260 |
| subtype1 | 31 | 52 |
| subtype2 | 47 | 78 |
| subtype3 | 89 | 89 |
| subtype4 | 41 | 41 |
Figure S95. Get High-res Image Clustering Approach #12: 'MIRseq Mature cHierClus subtypes' versus Clinical Feature #4: 'GENDER'

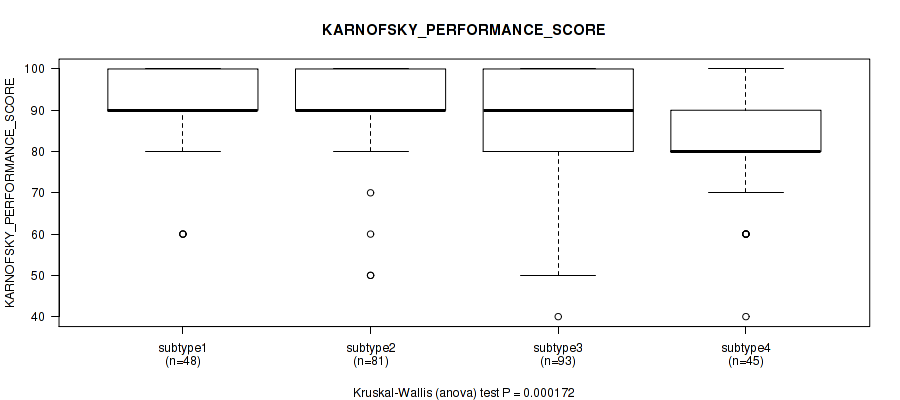
P value = 0.000172 (Kruskal-Wallis (anova)), Q value = 0.00055
Table S108. Clustering Approach #12: 'MIRseq Mature cHierClus subtypes' versus Clinical Feature #5: 'KARNOFSKY_PERFORMANCE_SCORE'
| nPatients | Mean (Std.Dev) | |
|---|---|---|
| ALL | 267 | 87.8 (12.0) |
| subtype1 | 48 | 90.4 (9.9) |
| subtype2 | 81 | 90.5 (10.2) |
| subtype3 | 93 | 87.0 (12.8) |
| subtype4 | 45 | 81.8 (13.0) |
Figure S96. Get High-res Image Clustering Approach #12: 'MIRseq Mature cHierClus subtypes' versus Clinical Feature #5: 'KARNOFSKY_PERFORMANCE_SCORE'
P value = 1e-05 (Fisher's exact test), Q value = 3.5e-05
Table S109. Clustering Approach #12: 'MIRseq Mature cHierClus subtypes' versus Clinical Feature #6: 'HISTOLOGICAL_TYPE'
| nPatients | ASTROCYTOMA | OLIGOASTROCYTOMA | OLIGODENDROGLIOMA |
|---|---|---|---|
| ALL | 174 | 115 | 179 |
| subtype1 | 45 | 24 | 14 |
| subtype2 | 33 | 33 | 59 |
| subtype3 | 40 | 47 | 91 |
| subtype4 | 56 | 11 | 15 |
Figure S97. Get High-res Image Clustering Approach #12: 'MIRseq Mature cHierClus subtypes' versus Clinical Feature #6: 'HISTOLOGICAL_TYPE'

P value = 0.702 (Fisher's exact test), Q value = 0.84
Table S110. Clustering Approach #12: 'MIRseq Mature cHierClus subtypes' versus Clinical Feature #7: 'RADIATIONS_RADIATION_REGIMENINDICATION'
| nPatients | NO | YES |
|---|---|---|
| ALL | 91 | 377 |
| subtype1 | 18 | 65 |
| subtype2 | 20 | 105 |
| subtype3 | 37 | 141 |
| subtype4 | 16 | 66 |
Figure S98. Get High-res Image Clustering Approach #12: 'MIRseq Mature cHierClus subtypes' versus Clinical Feature #7: 'RADIATIONS_RADIATION_REGIMENINDICATION'

P value = 0.3 (Fisher's exact test), Q value = 0.48
Table S111. Clustering Approach #12: 'MIRseq Mature cHierClus subtypes' versus Clinical Feature #8: 'RACE'
| nPatients | AMERICAN INDIAN OR ALASKA NATIVE | ASIAN | BLACK OR AFRICAN AMERICAN | WHITE |
|---|---|---|---|---|
| ALL | 1 | 8 | 15 | 433 |
| subtype1 | 0 | 0 | 2 | 79 |
| subtype2 | 0 | 4 | 3 | 116 |
| subtype3 | 0 | 2 | 5 | 166 |
| subtype4 | 1 | 2 | 5 | 72 |
Figure S99. Get High-res Image Clustering Approach #12: 'MIRseq Mature cHierClus subtypes' versus Clinical Feature #8: 'RACE'

P value = 0.526 (Fisher's exact test), Q value = 0.71
Table S112. Clustering Approach #12: 'MIRseq Mature cHierClus subtypes' versus Clinical Feature #9: 'ETHNICITY'
| nPatients | HISPANIC OR LATINO | NOT HISPANIC OR LATINO |
|---|---|---|
| ALL | 18 | 415 |
| subtype1 | 5 | 69 |
| subtype2 | 3 | 109 |
| subtype3 | 8 | 163 |
| subtype4 | 2 | 74 |
Figure S100. Get High-res Image Clustering Approach #12: 'MIRseq Mature cHierClus subtypes' versus Clinical Feature #9: 'ETHNICITY'

-
Cluster data file = /xchip/cga/gdac-prod/tcga-gdac/jobResults/GDAC_mergedClustering/GBMLGG-TP/15249296/GBMLGG-TP.mergedcluster.txt
-
Clinical data file = /xchip/cga/gdac-prod/tcga-gdac/jobResults/Append_Data/GBMLGG-TP/15078950/GBMLGG-TP.merged_data.txt
-
Number of patients = 1066
-
Number of clustering approaches = 12
-
Number of selected clinical features = 9
-
Exclude small clusters that include fewer than K patients, K = 3
consensus non-negative matrix factorization clustering approach (Brunet et al. 2004)
Resampling-based clustering method (Monti et al. 2003)
For survival clinical features, the Kaplan-Meier survival curves of tumors with and without gene mutations were plotted and the statistical significance P values were estimated by logrank test (Bland and Altman 2004) using the 'survdiff' function in R
For binary clinical features, two-tailed Fisher's exact tests (Fisher 1922) were used to estimate the P values using the 'fisher.test' function in R
For multiple hypothesis correction, Q value is the False Discovery Rate (FDR) analogue of the P value (Benjamini and Hochberg 1995), defined as the minimum FDR at which the test may be called significant. We used the 'Benjamini and Hochberg' method of 'p.adjust' function in R to convert P values into Q values.
In addition to the links below, the full results of the analysis summarized in this report can also be downloaded programmatically using firehose_get, or interactively from either the Broad GDAC website or TCGA Data Coordination Center Portal.