This pipeline computes the correlation between APOBRC groups and selected clinical features.
Testing the association between APOBEC groups identified by 2 different apobec score and 13 clinical features across 506 patients, 6 significant findings detected with Q value < 0.25.
-
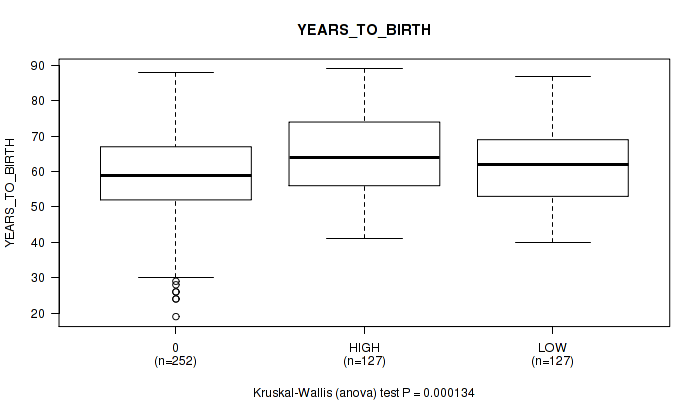
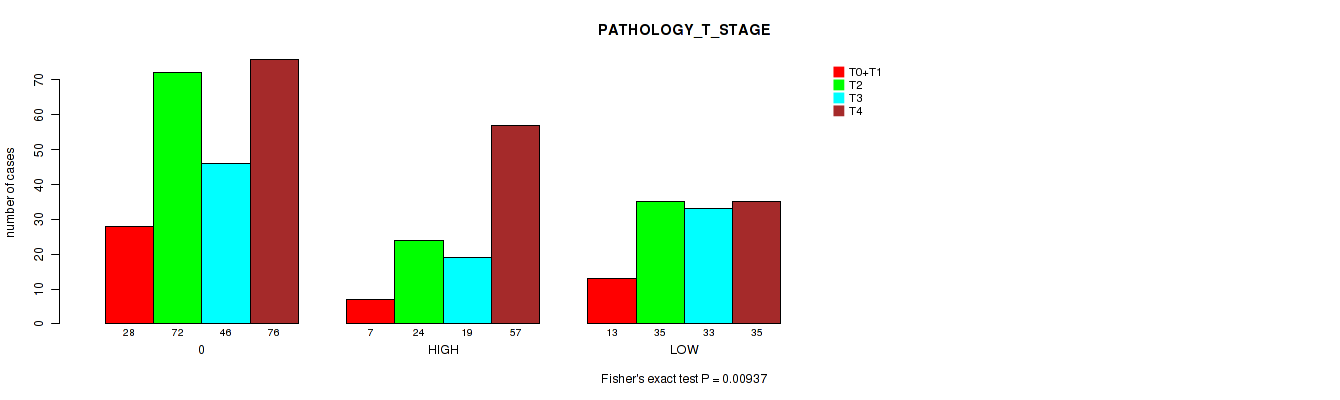
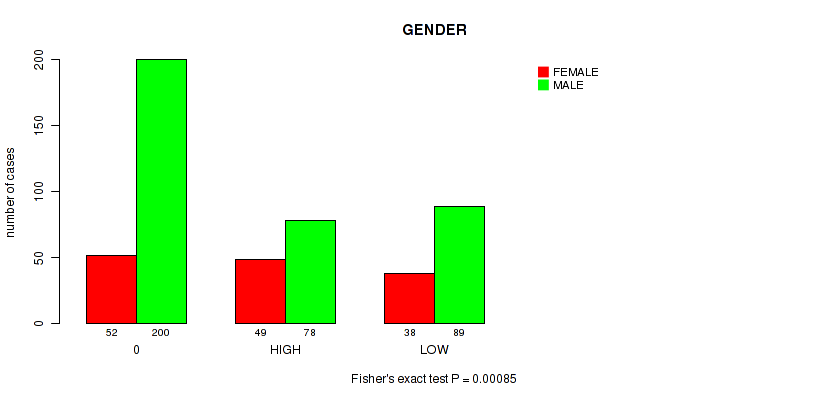
3 subtypes identified in current cancer cohort by 'APOBEC MUTLOAD MINESTIMATE'. These subtypes correlate to 'YEARS_TO_BIRTH', 'PATHOLOGY_T_STAGE', 'GENDER', and 'NUMBER_PACK_YEARS_SMOKED'.
-
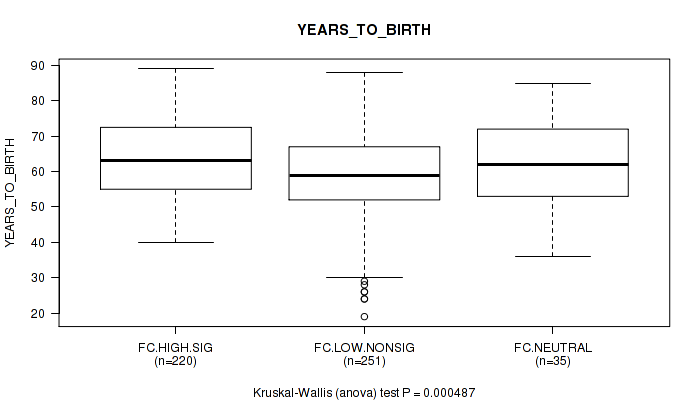
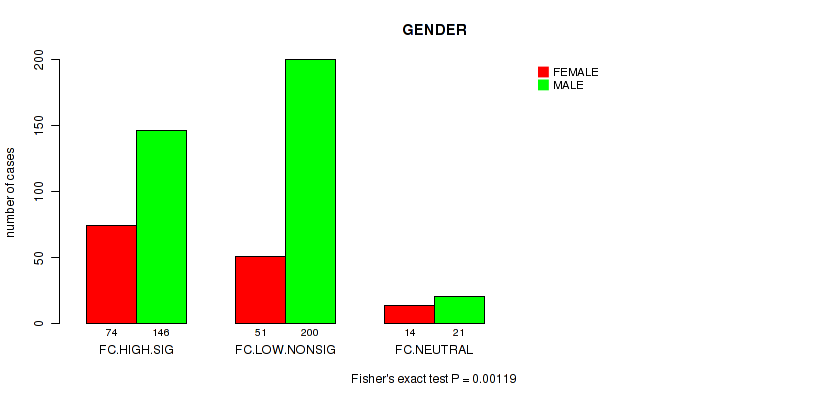
3 subtypes identified in current cancer cohort by 'APOBEC ENRICH'. These subtypes correlate to 'YEARS_TO_BIRTH' and 'GENDER'.
Table 1. Get Full Table Overview of the association between APOBEC groups by 2 different APOBEC scores and 13 clinical features. Shown in the table are P values (Q values). Thresholded by Q value < 0.25, 6 significant findings detected.
|
Clinical Features |
Statistical Tests |
APOBEC MUTLOAD MINESTIMATE |
APOBEC ENRICH |
| Time to Death | logrank test |
0.297 (0.482) |
0.276 (0.481) |
| YEARS TO BIRTH | Kruskal-Wallis (anova) |
0.000134 (0.00348) |
0.000487 (0.00633) |
| NEOPLASM DISEASESTAGE | Fisher's exact test |
0.147 (0.426) |
0.214 (0.467) |
| PATHOLOGY T STAGE | Fisher's exact test |
0.00937 (0.0487) |
0.278 (0.481) |
| PATHOLOGY N STAGE | Fisher's exact test |
0.462 (0.614) |
0.47 (0.614) |
| GENDER | Fisher's exact test |
0.00085 (0.00737) |
0.00119 (0.00773) |
| HISTOLOGICAL TYPE | Fisher's exact test |
0.844 (0.864) |
0.696 (0.787) |
| RADIATIONS RADIATION REGIMENINDICATION | Fisher's exact test |
0.416 (0.614) |
0.759 (0.822) |
| NUMBER PACK YEARS SMOKED | Kruskal-Wallis (anova) |
0.0195 (0.0846) |
0.107 (0.369) |
| YEAR OF TOBACCO SMOKING ONSET | Kruskal-Wallis (anova) |
0.273 (0.481) |
0.216 (0.467) |
| NUMBER OF LYMPH NODES | Kruskal-Wallis (anova) |
0.529 (0.625) |
0.114 (0.369) |
| RACE | Fisher's exact test |
0.207 (0.467) |
0.484 (0.614) |
| ETHNICITY | Fisher's exact test |
0.864 (0.864) |
0.496 (0.614) |
Table S1. Description of APOBEC group #1: 'APOBEC MUTLOAD MINESTIMATE'
| Cluster Labels | 0 | HIGH | LOW |
|---|---|---|---|
| Number of samples | 252 | 127 | 127 |
P value = 0.000134 (Kruskal-Wallis (anova)), Q value = 0.0035
Table S2. Clustering Approach #1: 'APOBEC MUTLOAD MINESTIMATE' versus Clinical Feature #2: 'YEARS_TO_BIRTH'
| nPatients | Mean (Std.Dev) | |
|---|---|---|
| ALL | 506 | 61.0 (12.0) |
| 0 | 252 | 58.5 (12.3) |
| HIGH | 127 | 64.6 (11.2) |
| LOW | 127 | 62.4 (11.2) |
Figure S1. Get High-res Image Clustering Approach #1: 'APOBEC MUTLOAD MINESTIMATE' versus Clinical Feature #2: 'YEARS_TO_BIRTH'
P value = 0.00937 (Fisher's exact test), Q value = 0.049
Table S3. Clustering Approach #1: 'APOBEC MUTLOAD MINESTIMATE' versus Clinical Feature #4: 'PATHOLOGY_T_STAGE'
| nPatients | T0+T1 | T2 | T3 | T4 |
|---|---|---|---|---|
| ALL | 48 | 131 | 98 | 168 |
| 0 | 28 | 72 | 46 | 76 |
| HIGH | 7 | 24 | 19 | 57 |
| LOW | 13 | 35 | 33 | 35 |
Figure S2. Get High-res Image Clustering Approach #1: 'APOBEC MUTLOAD MINESTIMATE' versus Clinical Feature #4: 'PATHOLOGY_T_STAGE'
P value = 0.00085 (Fisher's exact test), Q value = 0.0074
Table S4. Clustering Approach #1: 'APOBEC MUTLOAD MINESTIMATE' versus Clinical Feature #6: 'GENDER'
| nPatients | FEMALE | MALE |
|---|---|---|
| ALL | 139 | 367 |
| 0 | 52 | 200 |
| HIGH | 49 | 78 |
| LOW | 38 | 89 |
Figure S3. Get High-res Image Clustering Approach #1: 'APOBEC MUTLOAD MINESTIMATE' versus Clinical Feature #6: 'GENDER'
P value = 0.0195 (Kruskal-Wallis (anova)), Q value = 0.085
Table S5. Clustering Approach #1: 'APOBEC MUTLOAD MINESTIMATE' versus Clinical Feature #9: 'NUMBER_PACK_YEARS_SMOKED'
| nPatients | Mean (Std.Dev) | |
|---|---|---|
| ALL | 282 | 45.5 (35.6) |
| 0 | 153 | 44.7 (35.1) |
| HIGH | 58 | 39.7 (31.7) |
| LOW | 71 | 52.2 (39.0) |
Figure S4. Get High-res Image Clustering Approach #1: 'APOBEC MUTLOAD MINESTIMATE' versus Clinical Feature #9: 'NUMBER_PACK_YEARS_SMOKED'
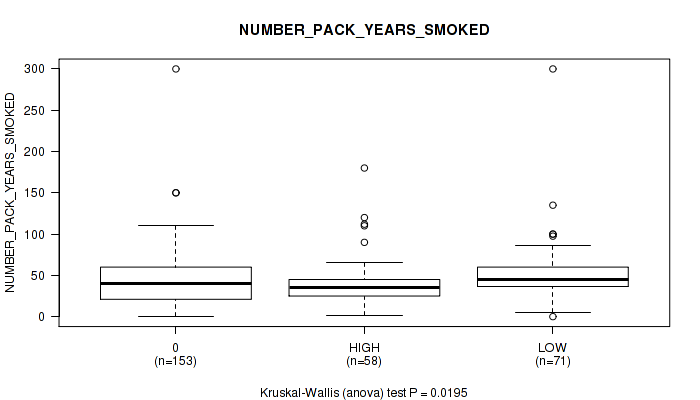
Table S6. Description of APOBEC group #2: 'APOBEC ENRICH'
| Cluster Labels | FC.HIGH.SIG | FC.LOW.NONSIG | FC.NEUTRAL |
|---|---|---|---|
| Number of samples | 220 | 251 | 35 |
P value = 0.000487 (Kruskal-Wallis (anova)), Q value = 0.0063
Table S7. Clustering Approach #2: 'APOBEC ENRICH' versus Clinical Feature #2: 'YEARS_TO_BIRTH'
| nPatients | Mean (Std.Dev) | |
|---|---|---|
| ALL | 506 | 61.0 (12.0) |
| FC.HIGH.SIG | 220 | 63.6 (11.2) |
| FC.LOW.NONSIG | 251 | 58.6 (12.3) |
| FC.NEUTRAL | 35 | 61.9 (12.0) |
Figure S5. Get High-res Image Clustering Approach #2: 'APOBEC ENRICH' versus Clinical Feature #2: 'YEARS_TO_BIRTH'
P value = 0.00119 (Fisher's exact test), Q value = 0.0077
Table S8. Clustering Approach #2: 'APOBEC ENRICH' versus Clinical Feature #6: 'GENDER'
| nPatients | FEMALE | MALE |
|---|---|---|
| ALL | 139 | 367 |
| FC.HIGH.SIG | 74 | 146 |
| FC.LOW.NONSIG | 51 | 200 |
| FC.NEUTRAL | 14 | 21 |
Figure S6. Get High-res Image Clustering Approach #2: 'APOBEC ENRICH' versus Clinical Feature #6: 'GENDER'
-
APOBEC groups file = /xchip/cga/gdac-prod/tcga-gdac/jobResults/APOBEC_Pipelines/HNSC-TP/15648694/APOBEC_clinical_corr_input_15648744/APOBEC_for_clinical.correlaion.input.categorical.txt
-
Clinical data file = /xchip/cga/gdac-prod/tcga-gdac/jobResults/Append_Data/HNSC-TP/15078978/HNSC-TP.merged_data.txt
-
Number of patients = 506
-
Number of selected clinical features = 13
APOBEC classification based on APOBEC_MutLoad_MinEstimate : a. APOBEC non group -- samples with zero value, b. APOBEC hig group -- samples above median value in non zero samples, c. APOBEC hig group -- samples below median value in non zero samples.
APOBEC classification based on APOBEC_enrich : a. No Enrichmment group -- all samples with BH_Fisher_p-value_tCw >=0.05, b. Small enrichment group -- samples with BH_Fisher_p-value_tCw = < 0.05 and APOBEC_enrich=<2, c. High enrichment gruop -- samples with BH_Fisher_p-value_tCw =< 0.05 and APOBEC_enrich>2.
For survival clinical features, the Kaplan-Meier survival curves of tumors with and without gene mutations were plotted and the statistical significance P values were estimated by logrank test (Bland and Altman 2004) using the 'survdiff' function in R
For binary clinical features, two-tailed Fisher's exact tests (Fisher 1922) were used to estimate the P values using the 'fisher.test' function in R
For multiple hypothesis correction, Q value is the False Discovery Rate (FDR) analogue of the P value (Benjamini and Hochberg 1995), defined as the minimum FDR at which the test may be called significant. We used the 'Benjamini and Hochberg' method of 'p.adjust' function in R to convert P values into Q values.
In addition to the links below, the full results of the analysis summarized in this report can also be downloaded programmatically using firehose_get, or interactively from either the Broad GDAC website or TCGA Data Coordination Center Portal.