This pipeline computes the correlation between significantly recurrent gene mutations and selected clinical features.
Testing the association between mutation status of 4 genes and 12 clinical features across 66 patients, 7 significant findings detected with Q value < 0.25.
-
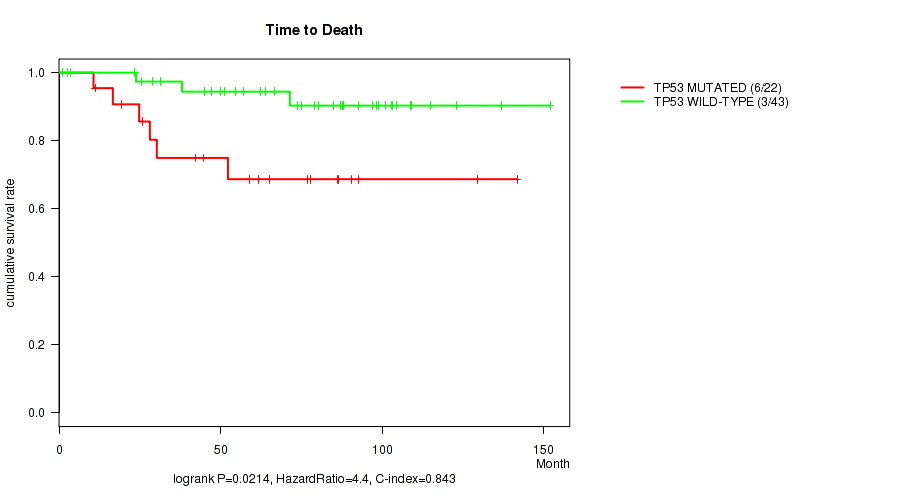
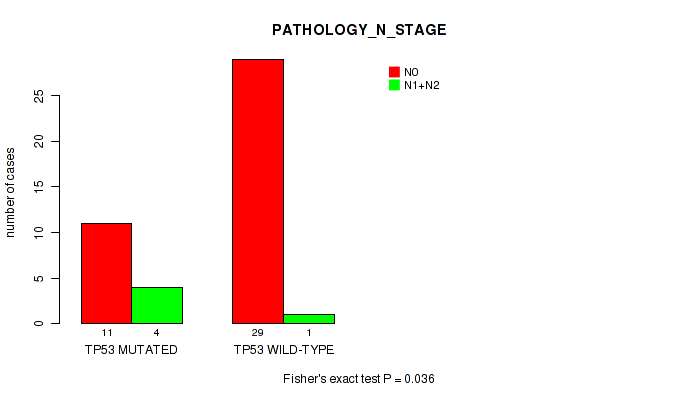
TP53 mutation correlated to 'Time to Death' and 'PATHOLOGY_N_STAGE'.
-
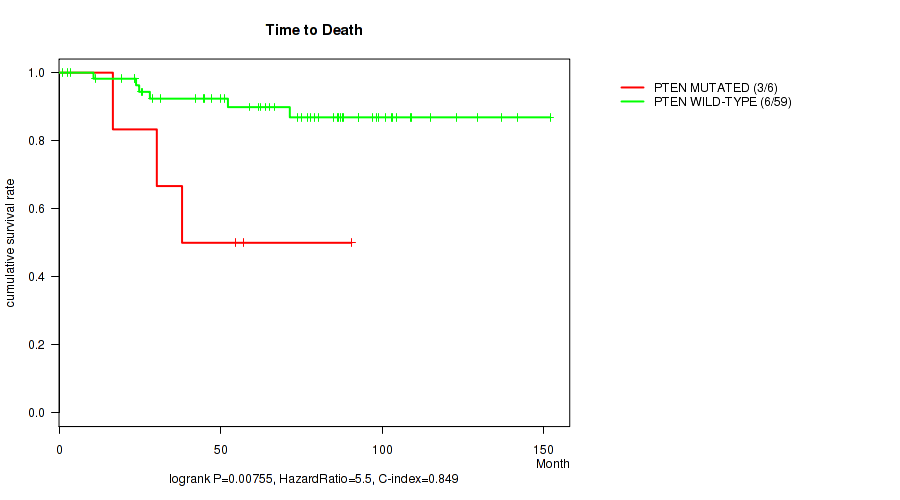
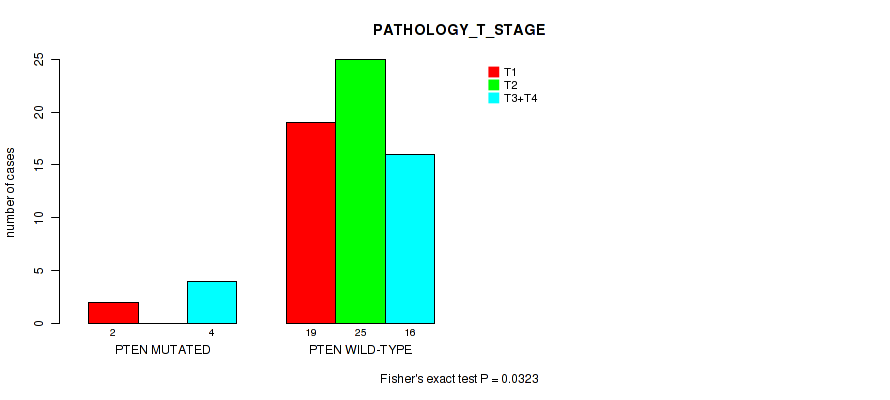
PTEN mutation correlated to 'Time to Death' and 'PATHOLOGY_T_STAGE'.
-
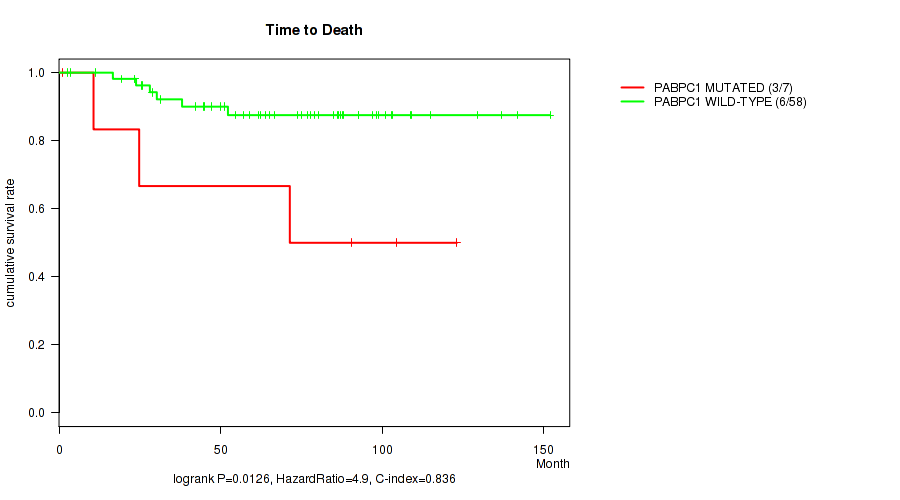
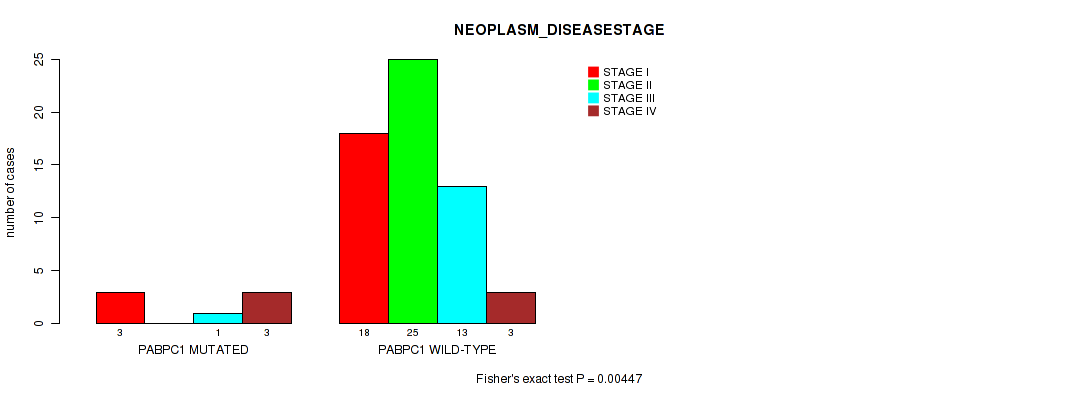
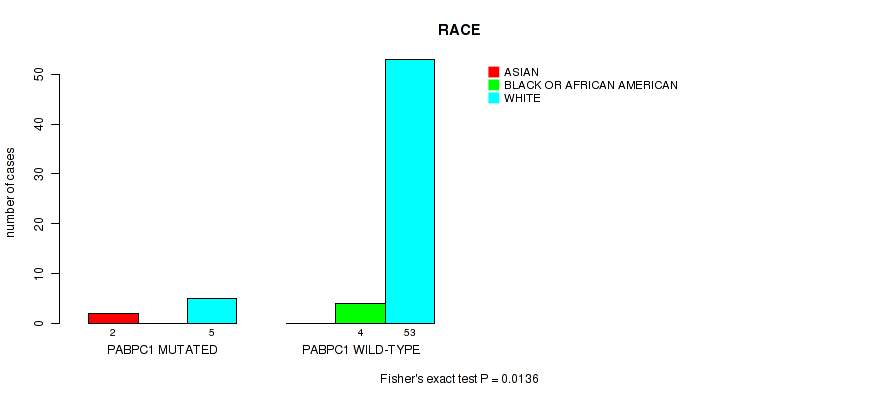
PABPC1 mutation correlated to 'Time to Death', 'NEOPLASM_DISEASESTAGE', and 'RACE'.
Table 1. Get Full Table Overview of the association between mutation status of 4 genes and 12 clinical features. Shown in the table are P values (Q values). Thresholded by Q value < 0.25, 7 significant findings detected.
|
Clinical Features |
Time to Death |
YEARS TO BIRTH |
NEOPLASM DISEASESTAGE |
PATHOLOGY T STAGE |
PATHOLOGY N STAGE |
PATHOLOGY M STAGE |
GENDER |
KARNOFSKY PERFORMANCE SCORE |
NUMBER PACK YEARS SMOKED |
YEAR OF TOBACCO SMOKING ONSET |
RACE | ETHNICITY | ||
| nMutated (%) | nWild-Type | logrank test | Wilcoxon-test | Fisher's exact test | Fisher's exact test | Fisher's exact test | Fisher's exact test | Fisher's exact test | Wilcoxon-test | Wilcoxon-test | Wilcoxon-test | Fisher's exact test | Fisher's exact test | |
| PABPC1 | 7 (11%) | 59 |
0.0126 (0.163) |
0.252 (0.711) |
0.00447 (0.163) |
0.0469 (0.271) |
0.0874 (0.381) |
1 (1.00) |
0.226 (0.677) |
0.0136 (0.163) |
1 (1.00) |
|||
| TP53 | 22 (33%) | 44 |
0.0214 (0.205) |
0.935 (1.00) |
0.306 (0.816) |
0.369 (0.932) |
0.036 (0.247) |
0.524 (1.00) |
1 (1.00) |
0.394 (0.946) |
0.885 (1.00) |
0.195 (0.677) |
1 (1.00) |
|
| PTEN | 6 (9%) | 60 |
0.00755 (0.163) |
0.422 (0.964) |
0.0508 (0.271) |
0.0323 (0.247) |
0.0874 (0.381) |
1 (1.00) |
0.217 (0.677) |
0.216 (0.677) |
0.213 (0.677) |
|||
| URGCP | 3 (5%) | 63 |
0.504 (1.00) |
0.841 (1.00) |
1 (1.00) |
1 (1.00) |
1 (1.00) |
1 (1.00) |
1 (1.00) |
1 (1.00) |
1 (1.00) |
P value = 0.0214 (logrank test), Q value = 0.21
Table S1. Gene #1: 'TP53 MUTATION STATUS' versus Clinical Feature #1: 'Time to Death'
| nPatients | nDeath | Duration Range (Median), Month | |
|---|---|---|---|
| ALL | 65 | 9 | 1.0 - 152.0 (65.2) |
| TP53 MUTATED | 22 | 6 | 10.7 - 141.7 (55.7) |
| TP53 WILD-TYPE | 43 | 3 | 1.0 - 152.0 (73.9) |
Figure S1. Get High-res Image Gene #1: 'TP53 MUTATION STATUS' versus Clinical Feature #1: 'Time to Death'
P value = 0.036 (Fisher's exact test), Q value = 0.25
Table S2. Gene #1: 'TP53 MUTATION STATUS' versus Clinical Feature #5: 'PATHOLOGY_N_STAGE'
| nPatients | N0 | N1+N2 |
|---|---|---|
| ALL | 40 | 5 |
| TP53 MUTATED | 11 | 4 |
| TP53 WILD-TYPE | 29 | 1 |
Figure S2. Get High-res Image Gene #1: 'TP53 MUTATION STATUS' versus Clinical Feature #5: 'PATHOLOGY_N_STAGE'
P value = 0.00755 (logrank test), Q value = 0.16
Table S3. Gene #2: 'PTEN MUTATION STATUS' versus Clinical Feature #1: 'Time to Death'
| nPatients | nDeath | Duration Range (Median), Month | |
|---|---|---|---|
| ALL | 65 | 9 | 1.0 - 152.0 (65.2) |
| PTEN MUTATED | 6 | 3 | 16.7 - 90.5 (46.4) |
| PTEN WILD-TYPE | 59 | 6 | 1.0 - 152.0 (71.4) |
Figure S3. Get High-res Image Gene #2: 'PTEN MUTATION STATUS' versus Clinical Feature #1: 'Time to Death'
P value = 0.0323 (Fisher's exact test), Q value = 0.25
Table S4. Gene #2: 'PTEN MUTATION STATUS' versus Clinical Feature #4: 'PATHOLOGY_T_STAGE'
| nPatients | T1 | T2 | T3+T4 |
|---|---|---|---|
| ALL | 21 | 25 | 20 |
| PTEN MUTATED | 2 | 0 | 4 |
| PTEN WILD-TYPE | 19 | 25 | 16 |
Figure S4. Get High-res Image Gene #2: 'PTEN MUTATION STATUS' versus Clinical Feature #4: 'PATHOLOGY_T_STAGE'
P value = 0.0126 (logrank test), Q value = 0.16
Table S5. Gene #3: 'PABPC1 MUTATION STATUS' versus Clinical Feature #1: 'Time to Death'
| nPatients | nDeath | Duration Range (Median), Month | |
|---|---|---|---|
| ALL | 65 | 9 | 1.0 - 152.0 (65.2) |
| PABPC1 MUTATED | 7 | 3 | 1.0 - 123.1 (71.4) |
| PABPC1 WILD-TYPE | 58 | 6 | 2.5 - 152.0 (64.6) |
Figure S5. Get High-res Image Gene #3: 'PABPC1 MUTATION STATUS' versus Clinical Feature #1: 'Time to Death'
P value = 0.00447 (Fisher's exact test), Q value = 0.16
Table S6. Gene #3: 'PABPC1 MUTATION STATUS' versus Clinical Feature #3: 'NEOPLASM_DISEASESTAGE'
| nPatients | STAGE I | STAGE II | STAGE III | STAGE IV |
|---|---|---|---|---|
| ALL | 21 | 25 | 14 | 6 |
| PABPC1 MUTATED | 3 | 0 | 1 | 3 |
| PABPC1 WILD-TYPE | 18 | 25 | 13 | 3 |
Figure S6. Get High-res Image Gene #3: 'PABPC1 MUTATION STATUS' versus Clinical Feature #3: 'NEOPLASM_DISEASESTAGE'
P value = 0.0136 (Fisher's exact test), Q value = 0.16
Table S7. Gene #3: 'PABPC1 MUTATION STATUS' versus Clinical Feature #11: 'RACE'
| nPatients | ASIAN | BLACK OR AFRICAN AMERICAN | WHITE |
|---|---|---|---|
| ALL | 2 | 4 | 58 |
| PABPC1 MUTATED | 2 | 0 | 5 |
| PABPC1 WILD-TYPE | 0 | 4 | 53 |
Figure S7. Get High-res Image Gene #3: 'PABPC1 MUTATION STATUS' versus Clinical Feature #11: 'RACE'
-
Mutation data file = sample_sig_gene_table.txt from Mutsig_2CV pipeline
-
Processed Mutation data file = /xchip/cga/gdac-prod/tcga-gdac/jobResults/GDAC_Correlate_Genomic_Events_Preprocess/KICH-TP/15174156/transformed.cor.cli.txt
-
Clinical data file = /xchip/cga/gdac-prod/tcga-gdac/jobResults/Append_Data/KICH-TP/15080874/KICH-TP.merged_data.txt
-
Number of patients = 66
-
Number of significantly mutated genes = 4
-
Number of selected clinical features = 12
-
Exclude genes that fewer than K tumors have mutations, K = 3
For survival clinical features, the Kaplan-Meier survival curves of tumors with and without gene mutations were plotted and the statistical significance P values were estimated by logrank test (Bland and Altman 2004) using the 'survdiff' function in R
For binary or multi-class clinical features (nominal or ordinal), two-tailed Fisher's exact tests (Fisher 1922) were used to estimate the P values using the 'fisher.test' function in R
For multiple hypothesis correction, Q value is the False Discovery Rate (FDR) analogue of the P value (Benjamini and Hochberg 1995), defined as the minimum FDR at which the test may be called significant. We used the 'Benjamini and Hochberg' method of 'p.adjust' function in R to convert P values into Q values.
In addition to the links below, the full results of the analysis summarized in this report can also be downloaded programmatically using firehose_get, or interactively from either the Broad GDAC website or TCGA Data Coordination Center Portal.