This pipeline computes the correlation between significantly recurrent gene mutations and selected clinical features.
Testing the association between mutation status of 25 genes and 5 clinical features across 195 patients, 6 significant findings detected with Q value < 0.25.
-
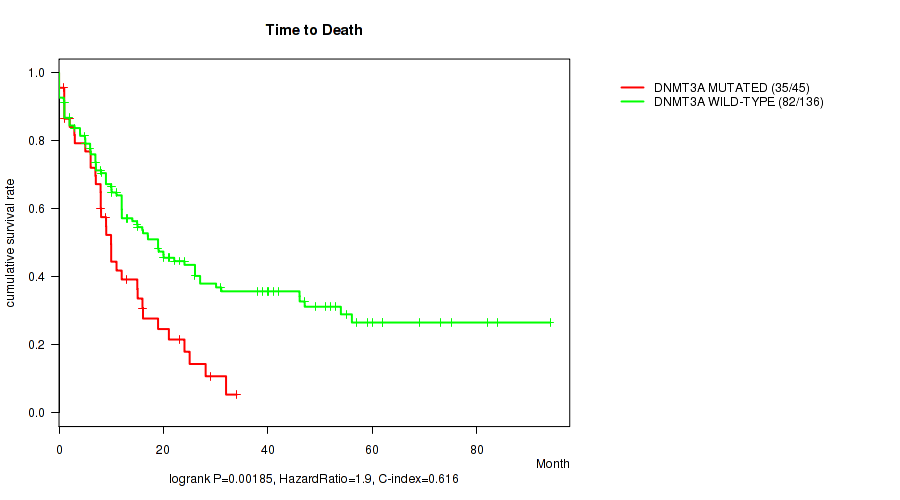
DNMT3A mutation correlated to 'Time to Death'.
-
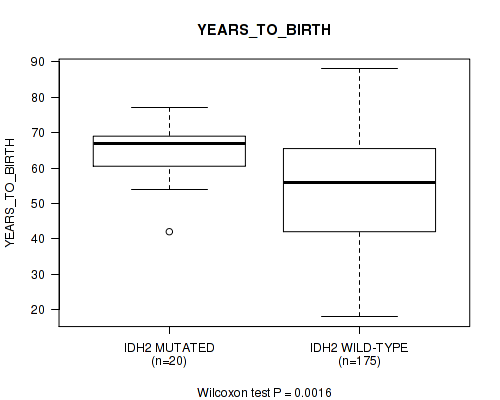
IDH2 mutation correlated to 'YEARS_TO_BIRTH'.
-
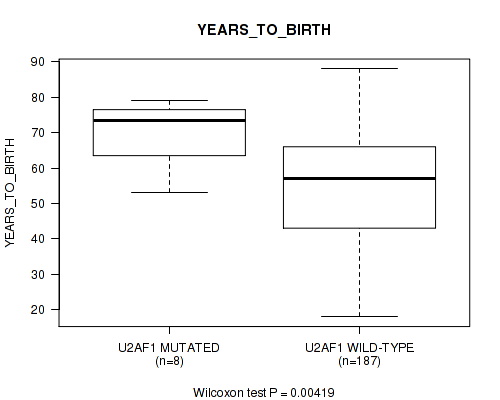
U2AF1 mutation correlated to 'YEARS_TO_BIRTH'.
-
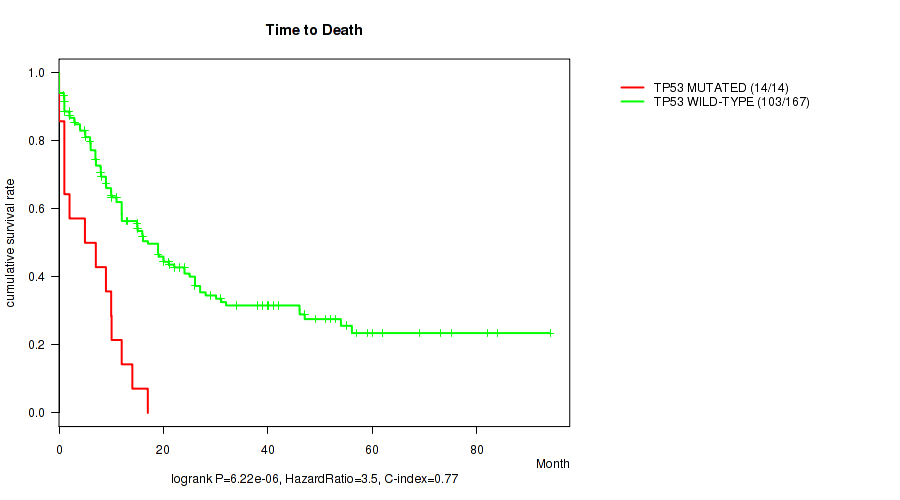
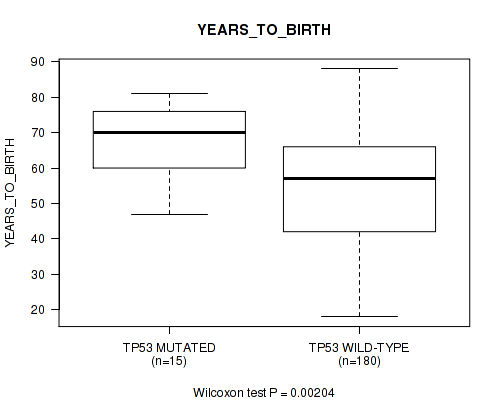
TP53 mutation correlated to 'Time to Death' and 'YEARS_TO_BIRTH'.
-
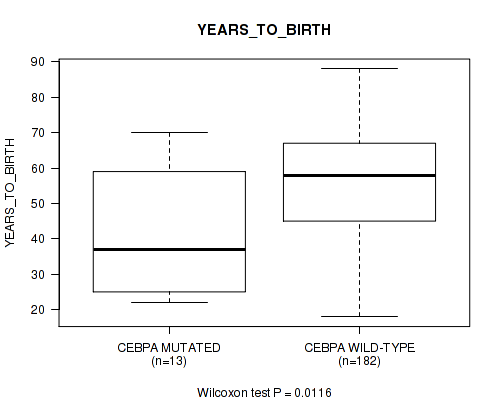
CEBPA mutation correlated to 'YEARS_TO_BIRTH'.
Table 1. Get Full Table Overview of the association between mutation status of 25 genes and 5 clinical features. Shown in the table are P values (Q values). Thresholded by Q value < 0.25, 6 significant findings detected.
|
Clinical Features |
Time to Death |
YEARS TO BIRTH |
GENDER | RACE | ETHNICITY | ||
| nMutated (%) | nWild-Type | logrank test | Wilcoxon-test | Fisher's exact test | Fisher's exact test | Fisher's exact test | |
| TP53 | 15 (8%) | 180 |
6.22e-06 (0.000778) |
0.00204 (0.0638) |
0.177 (0.761) |
1 (1.00) |
1 (1.00) |
| DNMT3A | 49 (25%) | 146 |
0.00185 (0.0638) |
0.266 (0.844) |
0.188 (0.785) |
0.389 (0.952) |
0.161 (0.75) |
| IDH2 | 20 (10%) | 175 |
0.724 (1.00) |
0.0016 (0.0638) |
0.815 (1.00) |
0.355 (0.888) |
0.282 (0.844) |
| U2AF1 | 8 (4%) | 187 |
0.496 (1.00) |
0.00419 (0.105) |
0.0695 (0.595) |
1 (1.00) |
1 (1.00) |
| CEBPA | 13 (7%) | 182 |
0.737 (1.00) |
0.0116 (0.242) |
0.58 (1.00) |
1 (1.00) |
1 (1.00) |
| FLT3 | 53 (27%) | 142 |
0.135 (0.75) |
0.328 (0.844) |
0.52 (1.00) |
0.0713 (0.595) |
0.562 (1.00) |
| NPM1 | 52 (27%) | 143 |
0.044 (0.527) |
0.774 (1.00) |
0.145 (0.75) |
0.231 (0.827) |
0.564 (1.00) |
| IDH1 | 18 (9%) | 177 |
0.609 (1.00) |
0.322 (0.844) |
0.466 (1.00) |
0.7 (1.00) |
1 (1.00) |
| RUNX1 | 18 (9%) | 177 |
0.0714 (0.595) |
0.0168 (0.288) |
0.622 (1.00) |
1 (1.00) |
1 (1.00) |
| TET2 | 17 (9%) | 178 |
0.805 (1.00) |
0.128 (0.75) |
0.319 (0.844) |
1 (1.00) |
1 (1.00) |
| NRAS | 15 (8%) | 180 |
0.637 (1.00) |
0.257 (0.844) |
1 (1.00) |
0.674 (1.00) |
1 (1.00) |
| WT1 | 12 (6%) | 183 |
0.55 (1.00) |
0.168 (0.75) |
0.774 (1.00) |
1 (1.00) |
0.163 (0.75) |
| PHF6 | 6 (3%) | 189 |
0.998 (1.00) |
0.158 (0.75) |
0.0309 (0.429) |
1 (1.00) |
1 (1.00) |
| KRAS | 8 (4%) | 187 |
0.319 (0.844) |
0.101 (0.745) |
0.149 (0.75) |
1 (1.00) |
0.12 (0.75) |
| SMC3 | 7 (4%) | 188 |
0.129 (0.75) |
0.782 (1.00) |
0.707 (1.00) |
1 (1.00) |
1 (1.00) |
| KIT | 8 (4%) | 187 |
0.468 (1.00) |
0.68 (1.00) |
0.477 (1.00) |
1 (1.00) |
1 (1.00) |
| RAD21 | 5 (3%) | 190 |
0.869 (1.00) |
0.231 (0.827) |
1 (1.00) |
0.0184 (0.288) |
1 (1.00) |
| EZH2 | 3 (2%) | 192 |
0.214 (0.825) |
1 (1.00) |
1 (1.00) |
1 (1.00) |
|
| STAG2 | 6 (3%) | 189 |
0.331 (0.844) |
0.214 (0.825) |
0.42 (1.00) |
0.128 (0.75) |
1 (1.00) |
| PTPN11 | 9 (5%) | 186 |
0.582 (1.00) |
0.294 (0.844) |
1 (1.00) |
0.571 (1.00) |
1 (1.00) |
| ASXL1 | 5 (3%) | 190 |
0.281 (0.844) |
0.0653 (0.595) |
0.666 (1.00) |
1 (1.00) |
0.0765 (0.598) |
| SUZ12 | 3 (2%) | 192 |
0.897 (1.00) |
0.947 (1.00) |
0.249 (0.844) |
1 (1.00) |
|
| PHACTR1 | 3 (2%) | 192 |
0.316 (0.844) |
0.963 (1.00) |
0.599 (1.00) |
1 (1.00) |
0.0464 (0.527) |
| SMC1A | 6 (3%) | 189 |
0.321 (0.844) |
0.265 (0.844) |
0.218 (0.825) |
0.43 (1.00) |
1 (1.00) |
| KDM6A | 3 (2%) | 192 |
0.793 (1.00) |
0.893 (1.00) |
1 (1.00) |
1 (1.00) |
1 (1.00) |
P value = 0.00185 (logrank test), Q value = 0.064
Table S1. Gene #3: 'DNMT3A MUTATION STATUS' versus Clinical Feature #1: 'Time to Death'
| nPatients | nDeath | Duration Range (Median), Month | |
|---|---|---|---|
| ALL | 181 | 117 | 0.0 - 94.1 (12.0) |
| DNMT3A MUTATED | 45 | 35 | 0.0 - 34.0 (9.0) |
| DNMT3A WILD-TYPE | 136 | 82 | 0.0 - 94.1 (12.5) |
Figure S1. Get High-res Image Gene #3: 'DNMT3A MUTATION STATUS' versus Clinical Feature #1: 'Time to Death'
P value = 0.0016 (Wilcoxon-test), Q value = 0.064
Table S2. Gene #4: 'IDH2 MUTATION STATUS' versus Clinical Feature #2: 'YEARS_TO_BIRTH'
| nPatients | Mean (Std.Dev) | |
|---|---|---|
| ALL | 195 | 54.9 (16.1) |
| IDH2 MUTATED | 20 | 64.9 (8.0) |
| IDH2 WILD-TYPE | 175 | 53.8 (16.5) |
Figure S2. Get High-res Image Gene #4: 'IDH2 MUTATION STATUS' versus Clinical Feature #2: 'YEARS_TO_BIRTH'
P value = 0.00419 (Wilcoxon-test), Q value = 0.1
Table S3. Gene #10: 'U2AF1 MUTATION STATUS' versus Clinical Feature #2: 'YEARS_TO_BIRTH'
| nPatients | Mean (Std.Dev) | |
|---|---|---|
| ALL | 195 | 54.9 (16.1) |
| U2AF1 MUTATED | 8 | 69.9 (9.0) |
| U2AF1 WILD-TYPE | 187 | 54.3 (16.1) |
Figure S3. Get High-res Image Gene #10: 'U2AF1 MUTATION STATUS' versus Clinical Feature #2: 'YEARS_TO_BIRTH'
P value = 6.22e-06 (logrank test), Q value = 0.00078
Table S4. Gene #11: 'TP53 MUTATION STATUS' versus Clinical Feature #1: 'Time to Death'
| nPatients | nDeath | Duration Range (Median), Month | |
|---|---|---|---|
| ALL | 181 | 117 | 0.0 - 94.1 (12.0) |
| TP53 MUTATED | 14 | 14 | 0.0 - 17.0 (6.0) |
| TP53 WILD-TYPE | 167 | 103 | 0.0 - 94.1 (12.0) |
Figure S4. Get High-res Image Gene #11: 'TP53 MUTATION STATUS' versus Clinical Feature #1: 'Time to Death'
P value = 0.00204 (Wilcoxon-test), Q value = 0.064
Table S5. Gene #11: 'TP53 MUTATION STATUS' versus Clinical Feature #2: 'YEARS_TO_BIRTH'
| nPatients | Mean (Std.Dev) | |
|---|---|---|
| ALL | 195 | 54.9 (16.1) |
| TP53 MUTATED | 15 | 66.9 (10.7) |
| TP53 WILD-TYPE | 180 | 53.9 (16.1) |
Figure S5. Get High-res Image Gene #11: 'TP53 MUTATION STATUS' versus Clinical Feature #2: 'YEARS_TO_BIRTH'
P value = 0.0116 (Wilcoxon-test), Q value = 0.24
Table S6. Gene #12: 'CEBPA MUTATION STATUS' versus Clinical Feature #2: 'YEARS_TO_BIRTH'
| nPatients | Mean (Std.Dev) | |
|---|---|---|
| ALL | 195 | 54.9 (16.1) |
| CEBPA MUTATED | 13 | 42.7 (17.6) |
| CEBPA WILD-TYPE | 182 | 55.8 (15.7) |
Figure S6. Get High-res Image Gene #12: 'CEBPA MUTATION STATUS' versus Clinical Feature #2: 'YEARS_TO_BIRTH'
-
Mutation data file = sample_sig_gene_table.txt from Mutsig_2CV pipeline
-
Processed Mutation data file = /xchip/cga/gdac-prod/tcga-gdac/jobResults/GDAC_Correlate_Genomic_Events_Preprocess/LAML-TB/15166008/transformed.cor.cli.txt
-
Clinical data file = /xchip/cga/gdac-prod/tcga-gdac/jobResults/Append_Data/LAML-TB/15082450/LAML-TB.merged_data.txt
-
Number of patients = 195
-
Number of significantly mutated genes = 25
-
Number of selected clinical features = 5
-
Exclude genes that fewer than K tumors have mutations, K = 3
For survival clinical features, the Kaplan-Meier survival curves of tumors with and without gene mutations were plotted and the statistical significance P values were estimated by logrank test (Bland and Altman 2004) using the 'survdiff' function in R
For binary or multi-class clinical features (nominal or ordinal), two-tailed Fisher's exact tests (Fisher 1922) were used to estimate the P values using the 'fisher.test' function in R
For multiple hypothesis correction, Q value is the False Discovery Rate (FDR) analogue of the P value (Benjamini and Hochberg 1995), defined as the minimum FDR at which the test may be called significant. We used the 'Benjamini and Hochberg' method of 'p.adjust' function in R to convert P values into Q values.
In addition to the links below, the full results of the analysis summarized in this report can also be downloaded programmatically using firehose_get, or interactively from either the Broad GDAC website or TCGA Data Coordination Center Portal.