This report serves to describe the mutational landscape and properties of a given individual set, as well as rank genes and genesets according to mutational significance. MutSig v2.0 was used to generate the results found in this report.
-
Working with individual set: LGG-TP
-
Number of patients in set: 513
The input for this pipeline is a set of individuals with the following files associated for each:
-
An annotated .maf file describing the mutations called for the respective individual, and their properties.
-
A .wig file that contains information about the coverage of the sample.
-
MAF used for this analysis:LGG-TP.final_analysis_set.maf
-
Blacklist used for this analysis: pancan_mutation_blacklist.v14.hg19.txt
-
Significantly mutated genes (q ≤ 0.1): 64
-
Mutations seen in COSMIC: 947
-
Significantly mutated genes in COSMIC territory: 17
-
Significantly mutated genesets: 103
-
Significantly mutated genesets: (excluding sig. mutated genes):0
-
Read 513 MAFs of type "Broad"
-
Total number of mutations in input MAFs: 45095
-
After removing 17 mutations outside chr1-24: 45078
-
After removing 2804 blacklisted mutations: 42274
-
After removing 2020 noncoding mutations: 40254
-
Number of mutations before filtering: 40254
-
After removing 2013 mutations outside gene set: 38241
-
After removing 177 mutations outside category set: 38064
-
After removing 2 "impossible" mutations in
-
gene-patient-category bins of zero coverage: 35872
Table 1. Get Full Table Table representing breakdown of mutations by type.
| type | count |
|---|---|
| Frame_Shift_Del | 1167 |
| Frame_Shift_Ins | 366 |
| In_Frame_Del | 508 |
| In_Frame_Ins | 28 |
| Missense_Mutation | 23995 |
| Nonsense_Mutation | 1464 |
| Nonstop_Mutation | 22 |
| Silent | 8981 |
| Splice_Site | 1368 |
| Translation_Start_Site | 165 |
| Total | 38064 |
Table 2. Get Full Table A breakdown of mutation rates per category discovered for this individual set.
| category | n | N | rate | rate_per_mb | relative_rate | exp_ns_s_ratio |
|---|---|---|---|---|---|---|
| *CpG->T | 8103 | 834182675 | 9.7e-06 | 9.7 | 5 | 2.1 |
| *Cp(A/C/T)->T | 4940 | 6833838767 | 7.2e-07 | 0.72 | 0.37 | 1.7 |
| A->G | 3600 | 7376116495 | 4.9e-07 | 0.49 | 0.25 | 2.3 |
| transver | 7505 | 15044137937 | 5e-07 | 0.5 | 0.26 | 5 |
| indel+null | 4778 | 15044137937 | 3.2e-07 | 0.32 | 0.16 | NaN |
| double_null | 156 | 15044137937 | 1e-08 | 0.01 | 0.0054 | NaN |
| Total | 29082 | 15044137937 | 1.9e-06 | 1.9 | 1 | 3.5 |
The x axis represents the samples. The y axis represents the exons, one row per exon, and they are sorted by average coverage across samples. For exons with exactly the same average coverage, they are sorted next by the %GC of the exon. (The secondary sort is especially useful for the zero-coverage exons at the bottom). If the figure is unpopulated, then full coverage is assumed (e.g. MutSig CV doesn't use WIGs and assumes full coverage).
Figure 1.
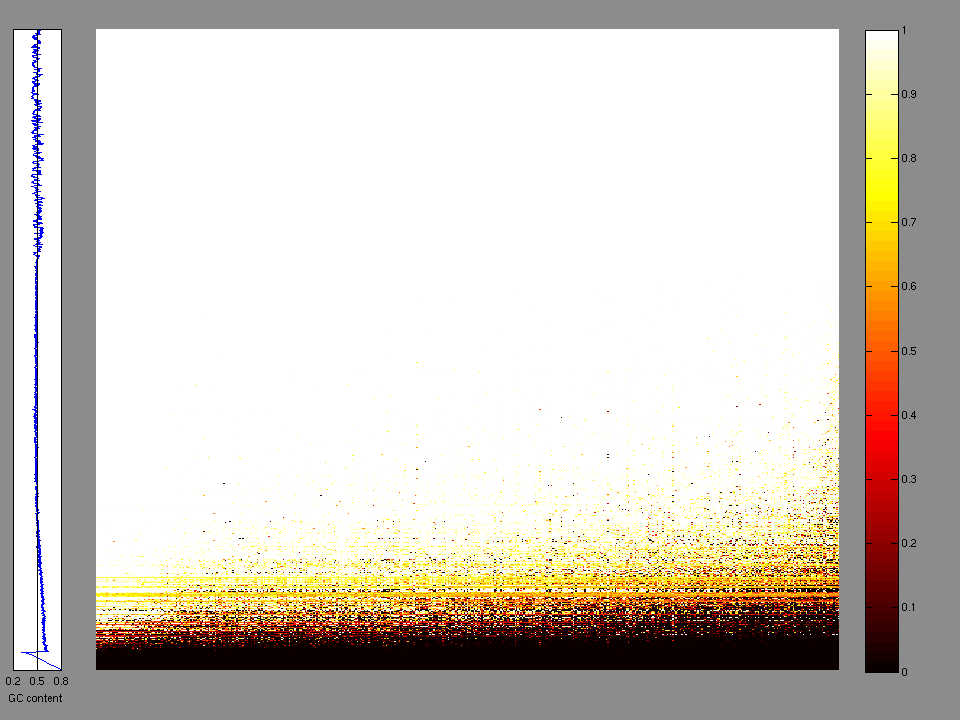
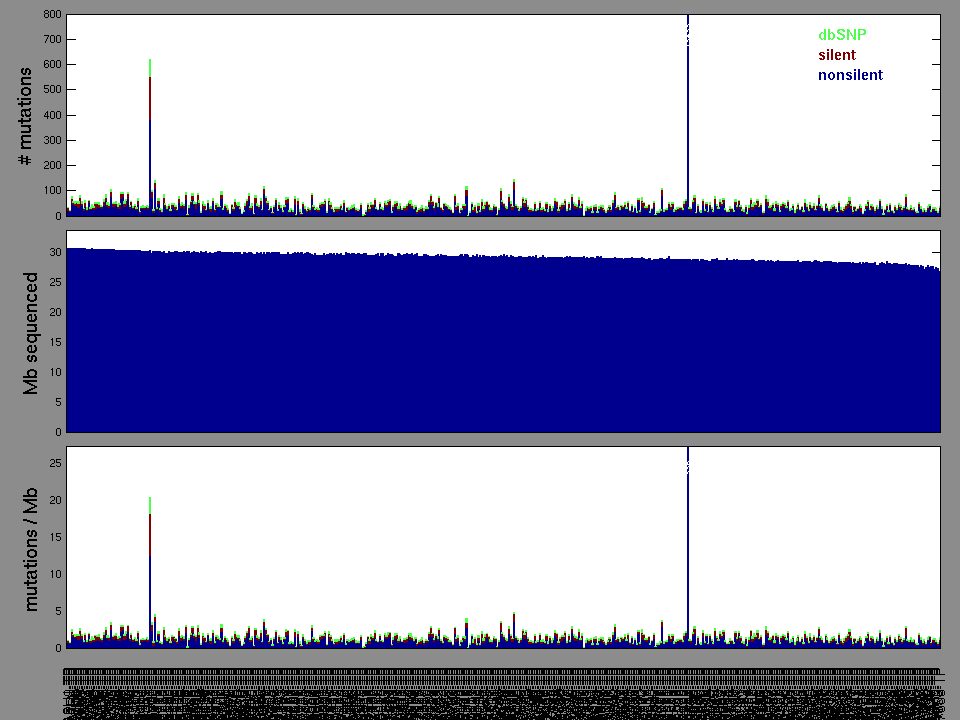
Figure 2. Patients counts and rates file used to generate this plot: LGG-TP.patients.counts_and_rates.txt
The mutation spectrum is depicted in the lego plots below in which the 96 possible mutation types are subdivided into six large blocks, color-coded to reflect the base substitution type. Each large block is further subdivided into the 16 possible pairs of 5' and 3' neighbors, as listed in the 4x4 trinucleotide context legend. The height of each block corresponds to the mutation frequency for that kind of mutation (counts of mutations normalized by the base coverage in a given bin). The shape of the spectrum is a signature for dominant mutational mechanisms in different tumor types.
Figure 3. Get High-res Image SNV Mutation rate lego plot for entire set. Each bin is normalized by base coverage for that bin. Colors represent the six SNV types on the upper right. The three-base context for each mutation is labeled in the 4x4 legend on the lower right. The fractional breakdown of SNV counts is shown in the pie chart on the upper left. If this figure is blank, not enough information was provided in the MAF to generate it.
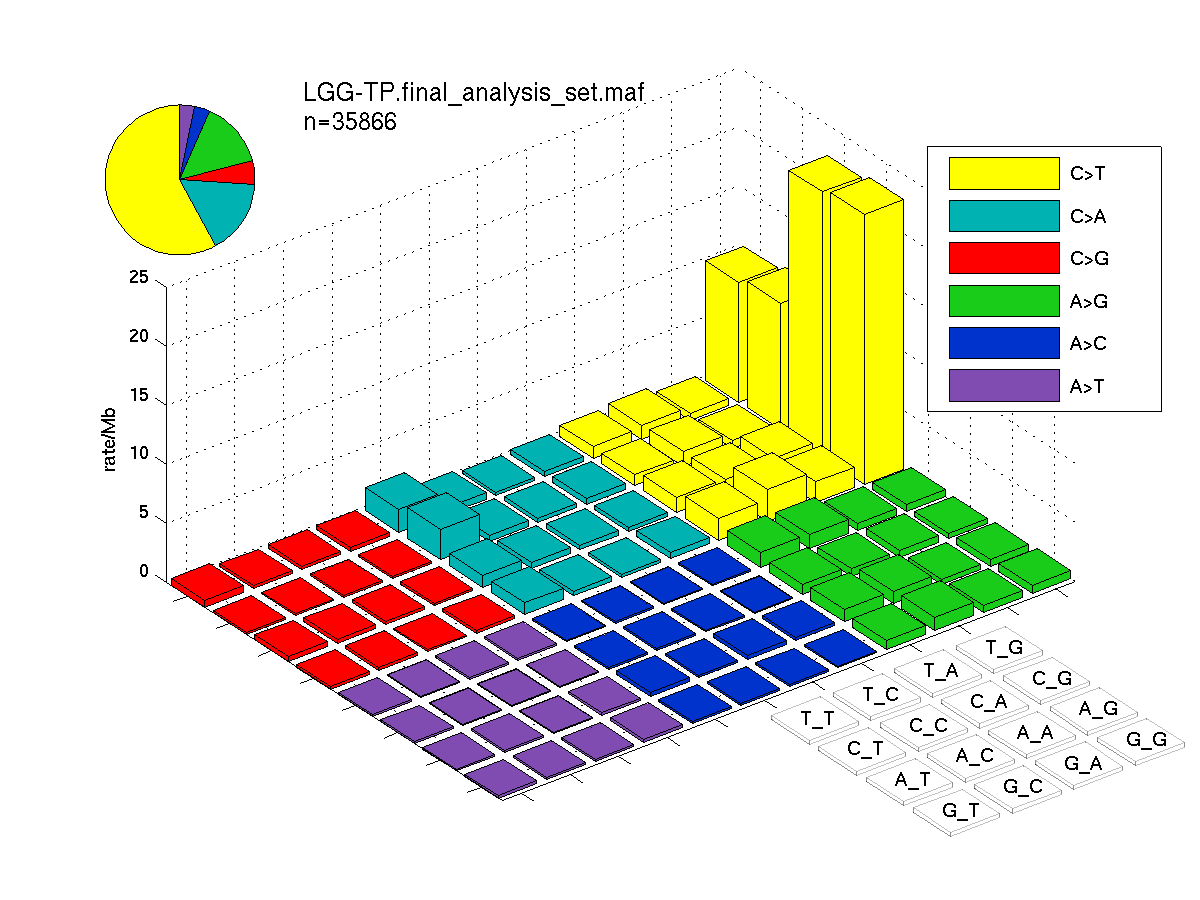
Figure 4. Get High-res Image SNV Mutation rate lego plots for 4 slices of mutation allele fraction (0<=AF<0.1, 0.1<=AF<0.25, 0.25<=AF<0.5, & 0.5<=AF) . The color code and three-base context legends are the same as the previous figure. If this figure is blank, not enough information was provided in the MAF to generate it.
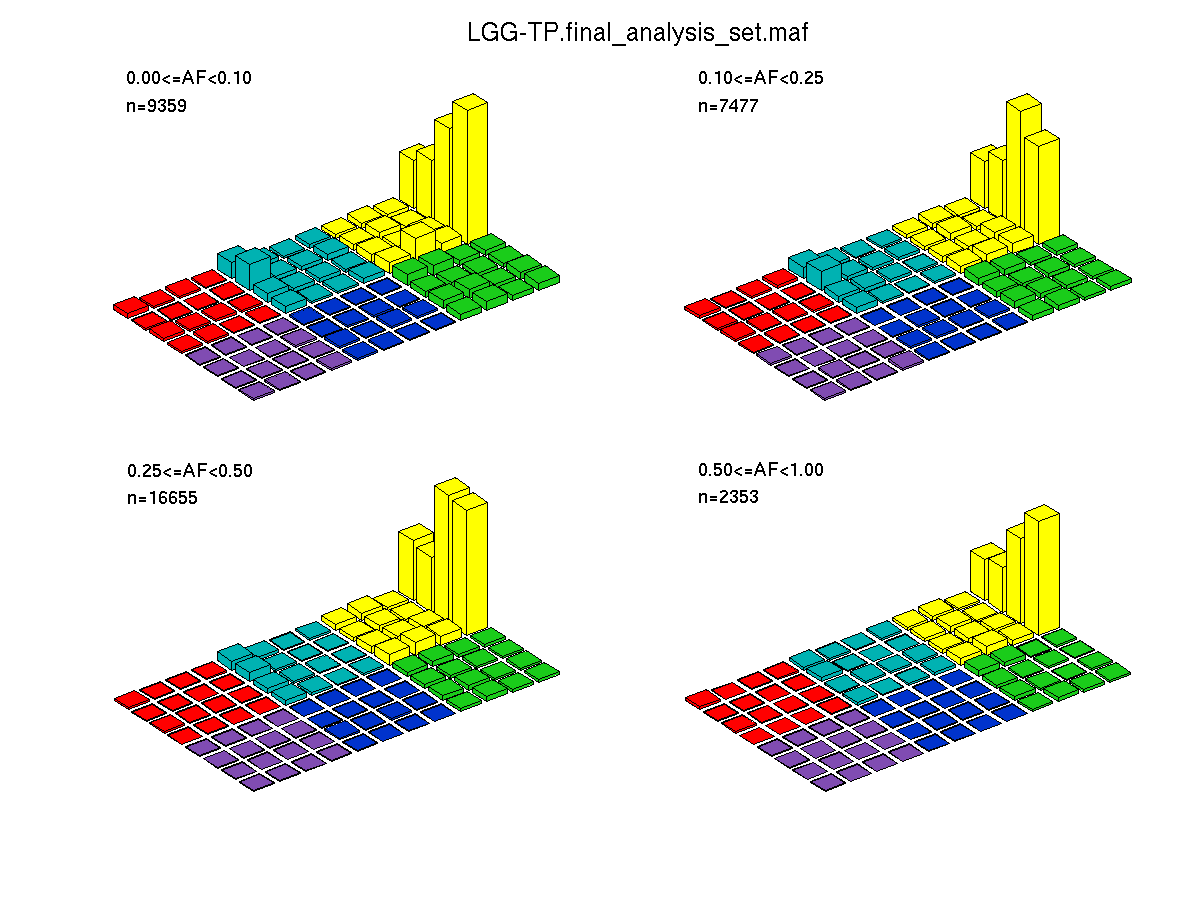
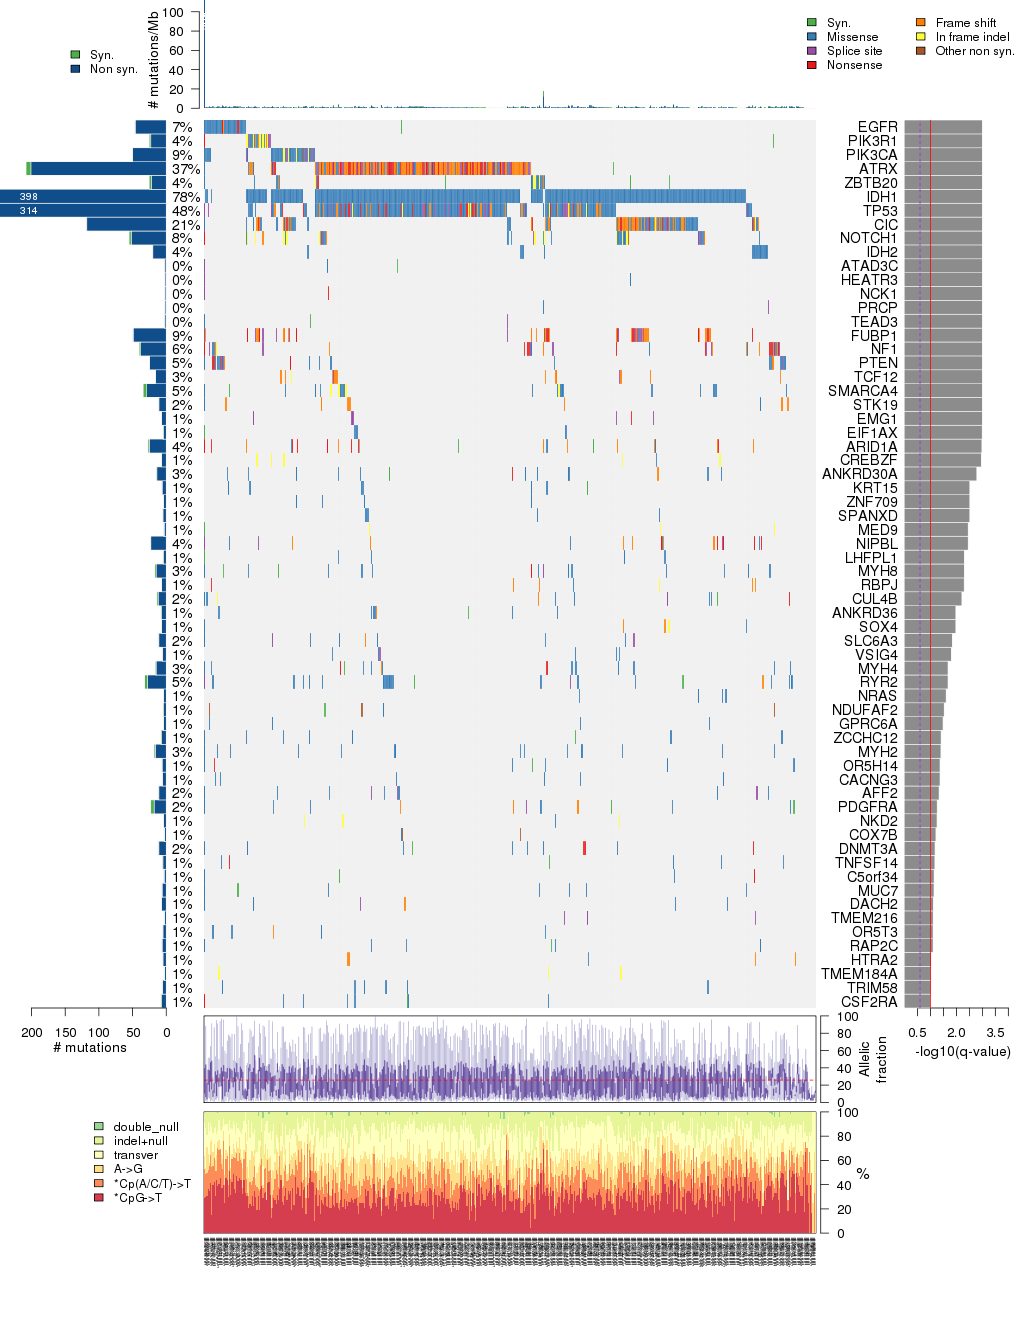
Figure 5. Get High-res Image The matrix in the center of the figure represents individual mutations in patient samples, color-coded by type of mutation, for the significantly mutated genes. The rate of synonymous and non-synonymous mutations is displayed at the top of the matrix. The barplot on the left of the matrix shows the number of mutations in each gene. The percentages represent the fraction of tumors with at least one mutation in the specified gene. The barplot to the right of the matrix displays the q-values for the most significantly mutated genes. The purple boxplots below the matrix (only displayed if required columns are present in the provided MAF) represent the distributions of allelic fractions observed in each sample. The plot at the bottom represents the base substitution distribution of individual samples, using the same categories that were used to calculate significance.
Column Descriptions:
-
N = number of sequenced bases in this gene across the individual set
-
n = number of (nonsilent) mutations in this gene across the individual set
-
npat = number of patients (individuals) with at least one nonsilent mutation
-
nsite = number of unique sites having a non-silent mutation
-
nsil = number of silent mutations in this gene across the individual set
-
n1 = number of nonsilent mutations of type: *CpG->T
-
n2 = number of nonsilent mutations of type: *Cp(A/C/T)->T
-
n3 = number of nonsilent mutations of type: A->G
-
n4 = number of nonsilent mutations of type: transver
-
n5 = number of nonsilent mutations of type: indel+null
-
n6 = number of nonsilent mutations of type: double_null
-
p_classic = p-value for the observed amount of nonsilent mutations being elevated in this gene
-
p_ns_s = p-value for the observed nonsilent/silent ratio being elevated in this gene
-
p_cons = p-value for enrichment of mutations at evolutionarily most-conserved sites in gene
-
p_joint = p-value for clustering + conservation
-
p = p-value (overall)
-
q = q-value, False Discovery Rate (Benjamini-Hochberg procedure)
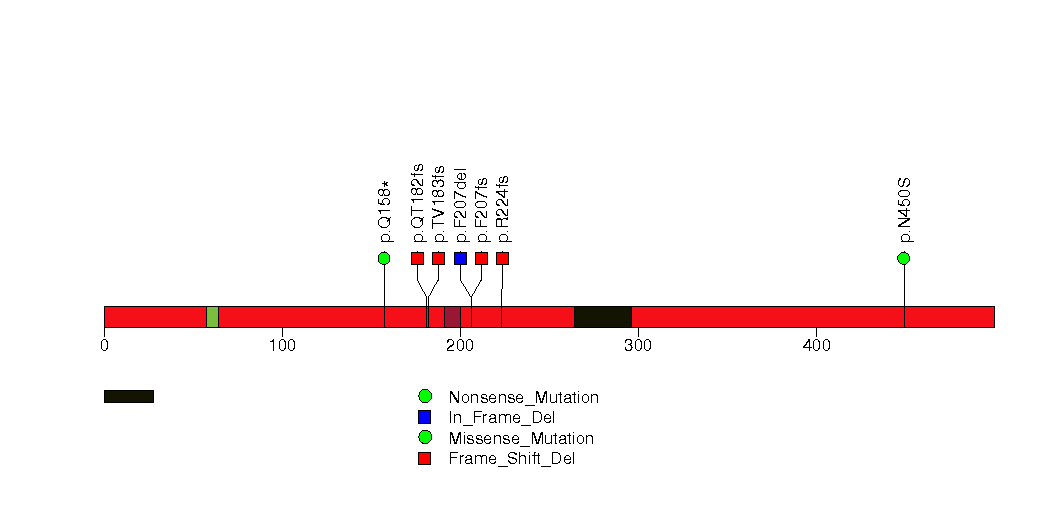
Table 3. Get Full Table A Ranked List of Significantly Mutated Genes. Number of significant genes found: 64. Number of genes displayed: 35. Click on a gene name to display its stick figure depicting the distribution of mutations and mutation types across the chosen gene (this feature may not be available for all significant genes).
| rank | gene | description | N | n | npat | nsite | nsil | n1 | n2 | n3 | n4 | n5 | n6 | p_classic | p_ns_s | p_clust | p_cons | p_joint | p | q |
|---|---|---|---|---|---|---|---|---|---|---|---|---|---|---|---|---|---|---|---|---|
| 1 | EGFR | epidermal growth factor receptor (erythroblastic leukemia viral (v-erb-b) oncogene homolog, avian) | 2021570 | 46 | 35 | 29 | 1 | 7 | 15 | 2 | 19 | 3 | 0 | <1.00e-15 | 1.64e-06 | 0.0008 | 0.0033 | 0.000036 | <0.000 | <0.000 |
| 2 | PIK3R1 | phosphoinositide-3-kinase, regulatory subunit 1 (alpha) | 1212453 | 23 | 22 | 17 | 2 | 1 | 2 | 4 | 0 | 15 | 1 | 3.22e-15 | 0.354 | 9.6e-06 | 0.87 | 0.000037 | 0.000 | 0.000 |
| 3 | PIK3CA | phosphoinositide-3-kinase, catalytic, alpha polypeptide | 1683168 | 50 | 45 | 29 | 0 | 1 | 13 | 16 | 9 | 11 | 0 | 3.22e-15 | 5.12e-07 | 0.0089 | 0.0072 | 0.0017 | 2.22e-16 | 1.21e-12 |
| 4 | ATRX | alpha thalassemia/mental retardation syndrome X-linked (RAD54 homolog, S. cerevisiae) | 3849661 | 201 | 191 | 174 | 7 | 2 | 4 | 17 | 9 | 158 | 11 | 2.78e-15 | 1.92e-05 | 0.005 | 0.26 | 0.0066 | 6.66e-16 | 1.21e-12 |
| 5 | ZBTB20 | zinc finger and BTB domain containing 20 | 1043909 | 22 | 21 | 19 | 3 | 4 | 1 | 6 | 4 | 7 | 0 | 2.09e-13 | 0.137 | 0.00066 | 0.025 | 0.00013 | 9.99e-16 | 1.21e-12 |
| 6 | IDH1 | isocitrate dehydrogenase 1 (NADP+), soluble | 650235 | 398 | 398 | 2 | 0 | 378 | 0 | 0 | 20 | 0 | 0 | 1.22e-15 | <1.00e-15 | 0 | 1 | 0 | <1.00e-15 | <1.21e-12 |
| 7 | TP53 | tumor protein p53 | 630319 | 312 | 248 | 141 | 2 | 107 | 30 | 47 | 63 | 58 | 7 | <1.00e-15 | <1.00e-15 | 0 | 0 | 0 | <1.00e-15 | <1.21e-12 |
| 8 | CIC | capicua homolog (Drosophila) | 2157807 | 118 | 108 | 83 | 1 | 41 | 5 | 6 | 14 | 46 | 6 | 1.33e-15 | 7.97e-12 | 0 | 0.032 | 0 | <1.00e-15 | <1.21e-12 |
| 9 | NOTCH1 | Notch homolog 1, translocation-associated (Drosophila) | 3106806 | 52 | 42 | 40 | 3 | 4 | 8 | 2 | 11 | 24 | 3 | 1.22e-15 | 0.00226 | 0 | 0.068 | 0 | <1.00e-15 | <1.21e-12 |
| 10 | IDH2 | isocitrate dehydrogenase 2 (NADP+), mitochondrial | 597213 | 20 | 20 | 3 | 0 | 0 | 12 | 2 | 6 | 0 | 0 | 6.88e-15 | 0.000138 | 0 | 1 | 0 | <1.00e-15 | <1.21e-12 |
| 11 | ATAD3C | ATPase family, AAA domain containing 3C | 522969 | 2 | 2 | 2 | 1 | 0 | 0 | 0 | 1 | 1 | 0 | 0.207 | 0.808 | 0.96 | 0 | 0 | <1.00e-15 | <1.21e-12 |
| 12 | HEATR3 | HEAT repeat containing 3 | 909034 | 2 | 2 | 2 | 0 | 1 | 0 | 0 | 0 | 1 | 0 | 0.244 | 0.340 | 0.43 | 0 | 0 | <1.00e-15 | <1.21e-12 |
| 13 | NCK1 | NCK adaptor protein 1 | 587634 | 2 | 2 | 2 | 0 | 0 | 0 | 0 | 0 | 2 | 0 | 0.162 | 0.592 | 1 | 0 | 0 | <1.00e-15 | <1.21e-12 |
| 14 | PRCP | prolylcarboxypeptidase (angiotensinase C) | 811876 | 2 | 2 | 2 | 0 | 1 | 0 | 0 | 0 | 1 | 0 | 0.190 | 0.491 | 0.66 | 0 | 0 | <1.00e-15 | <1.21e-12 |
| 15 | TEAD3 | TEA domain family member 3 | 606431 | 2 | 2 | 2 | 1 | 0 | 1 | 0 | 0 | 1 | 0 | 0.239 | 0.670 | 0.052 | 0 | 0 | <1.00e-15 | <1.21e-12 |
| 16 | FUBP1 | far upstream element (FUSE) binding protein 1 | 1015005 | 49 | 48 | 44 | 1 | 0 | 0 | 1 | 1 | 45 | 2 | <1.00e-15 | 0.0396 | 0.22 | 0.99 | 0.37 | <1.35e-14 | <1.53e-11 |
| 17 | NF1 | neurofibromin 1 (neurofibromatosis, von Recklinghausen disease, Watson disease) | 4433370 | 38 | 33 | 37 | 2 | 0 | 4 | 2 | 5 | 16 | 11 | 4.66e-15 | 0.0174 | 0.16 | 0.83 | 0.28 | 4.60e-14 | 4.90e-11 |
| 18 | PTEN | phosphatase and tensin homolog (mutated in multiple advanced cancers 1) | 614037 | 25 | 25 | 23 | 0 | 1 | 4 | 4 | 7 | 9 | 0 | 6.66e-15 | 0.00421 | 0.67 | 0.62 | 1 | 2.24e-13 | 2.25e-10 |
| 19 | TCF12 | transcription factor 12 (HTF4, helix-loop-helix transcription factors 4) | 1162876 | 16 | 15 | 15 | 0 | 0 | 0 | 0 | 0 | 16 | 0 | 7.89e-13 | 0.748 | 0.12 | 0.13 | 0.1 | 2.53e-12 | 2.41e-09 |
| 20 | SMARCA4 | SWI/SNF related, matrix associated, actin dependent regulator of chromatin, subfamily a, member 4 | 2304232 | 29 | 26 | 26 | 5 | 7 | 3 | 4 | 9 | 6 | 0 | 2.28e-09 | 0.147 | 0.00044 | 0.24 | 0.0015 | 9.36e-11 | 8.47e-08 |
| 21 | STK19 | serine/threonine kinase 19 | 556290 | 11 | 10 | 4 | 0 | 0 | 0 | 2 | 1 | 8 | 0 | 6.20e-09 | 0.417 | 0.00027 | 0.65 | 0.00062 | 1.05e-10 | 9.08e-08 |
| 22 | EMG1 | EMG1 nucleolar protein homolog (S. cerevisiae) | 350099 | 7 | 7 | 3 | 0 | 0 | 0 | 0 | 0 | 7 | 0 | 6.85e-08 | 0.838 | 0.00037 | 0.99 | 0.001 | 1.73e-09 | 1.42e-06 |
| 23 | EIF1AX | eukaryotic translation initiation factor 1A, X-linked | 225875 | 4 | 4 | 3 | 1 | 1 | 1 | 1 | 1 | 0 | 0 | 2.54e-05 | 0.546 | 0.00031 | 0.038 | 0.000037 | 2.03e-08 | 1.60e-05 |
| 24 | ARID1A | AT rich interactive domain 1A (SWI-like) | 2980984 | 25 | 20 | 25 | 2 | 1 | 2 | 0 | 5 | 16 | 1 | 3.47e-09 | 0.0870 | 0.62 | 0.77 | 1 | 7.11e-08 | 5.37e-05 |
| 25 | CREBZF | CREB/ATF bZIP transcription factor | 534938 | 7 | 7 | 2 | 0 | 0 | 0 | 0 | 1 | 6 | 0 | 3.03e-05 | 0.799 | 0.0001 | 0.23 | 0.00019 | 1.12e-07 | 8.14e-05 |
| 26 | ANKRD30A | ankyrin repeat domain 30A | 1913017 | 14 | 13 | 14 | 1 | 5 | 1 | 2 | 4 | 2 | 0 | 5.43e-08 | 0.0488 | 0.98 | 0.89 | 1 | 9.62e-07 | 0.000670 |
| 27 | KRT15 | keratin 15 | 719460 | 6 | 6 | 5 | 1 | 6 | 0 | 0 | 0 | 0 | 0 | 0.000211 | 0.325 | 0.00042 | 0.79 | 0.0009 | 3.12e-06 | 0.00209 |
| 28 | ZNF709 | zinc finger protein 709 | 994832 | 4 | 4 | 1 | 0 | 0 | 4 | 0 | 0 | 0 | 0 | 0.00559 | 0.312 | 8e-07 | 0.98 | 0.000036 | 3.29e-06 | 0.00209 |
| 29 | SPANXD | SPANX family, member D | 152977 | 5 | 5 | 5 | 0 | 1 | 1 | 1 | 2 | 0 | 0 | 5.37e-07 | 0.197 | 0.21 | 0.22 | 0.38 | 3.35e-06 | 0.00209 |
| 30 | MED9 | mediator complex subunit 9 | 223034 | 3 | 3 | 1 | 1 | 0 | 0 | 0 | 0 | 3 | 0 | 0.000979 | 1.000 | 0.000094 | 0.28 | 0.00026 | 4.18e-06 | 0.00250 |
| 31 | NIPBL | Nipped-B homolog (Drosophila) | 4360490 | 23 | 18 | 23 | 0 | 0 | 4 | 0 | 5 | 13 | 1 | 3.72e-07 | 0.0244 | 0.49 | 0.68 | 0.71 | 4.28e-06 | 0.00250 |
| 32 | LHFPL1 | lipoma HMGIC fusion partner-like 1 | 346093 | 4 | 4 | 3 | 1 | 3 | 0 | 0 | 1 | 0 | 0 | 0.000365 | 0.767 | 0.00057 | 0.14 | 0.0012 | 7.03e-06 | 0.00388 |
| 33 | MYH8 | myosin, heavy chain 8, skeletal muscle, perinatal | 3057171 | 15 | 14 | 15 | 2 | 6 | 2 | 0 | 5 | 2 | 0 | 0.000243 | 0.103 | 0.19 | 0.00074 | 0.0019 | 7.07e-06 | 0.00388 |
| 34 | RBPJ | recombination signal binding protein for immunoglobulin kappa J region | 789071 | 7 | 7 | 6 | 0 | 0 | 0 | 1 | 0 | 6 | 0 | 3.72e-05 | 0.471 | 0.0079 | 0.67 | 0.013 | 7.49e-06 | 0.00399 |
| 35 | CUL4B | cullin 4B | 1358008 | 12 | 10 | 12 | 2 | 0 | 1 | 3 | 4 | 4 | 0 | 5.24e-06 | 0.378 | 0.067 | 0.36 | 0.13 | 1.00e-05 | 0.00519 |
Figure S1. This figure depicts the distribution of mutations and mutation types across the EGFR significant gene.
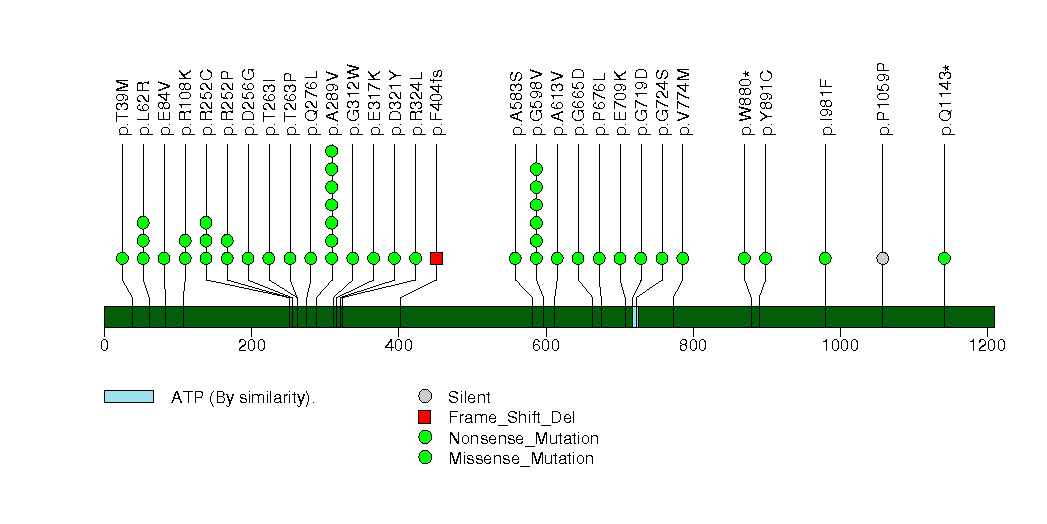
Figure S2. This figure depicts the distribution of mutations and mutation types across the PIK3R1 significant gene.
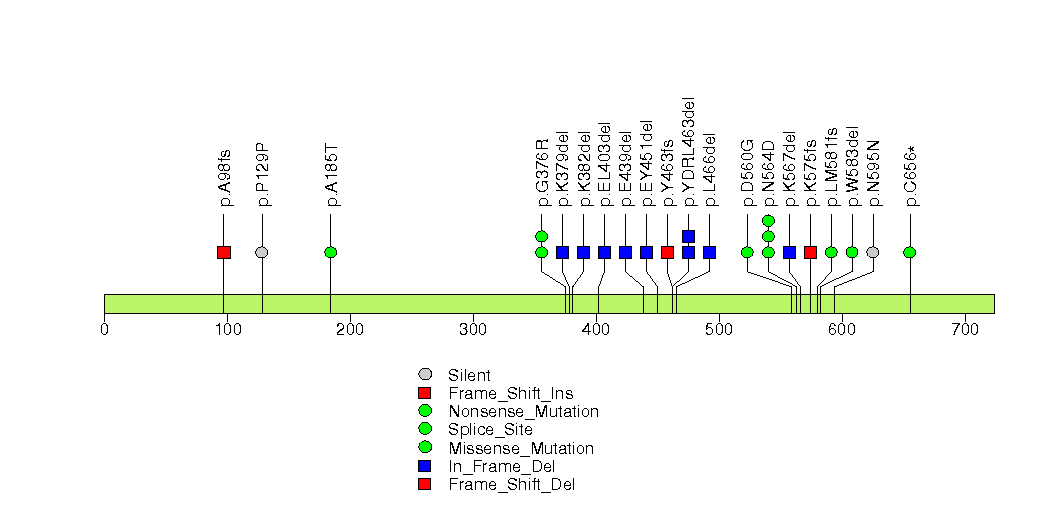
Figure S3. This figure depicts the distribution of mutations and mutation types across the PIK3CA significant gene.
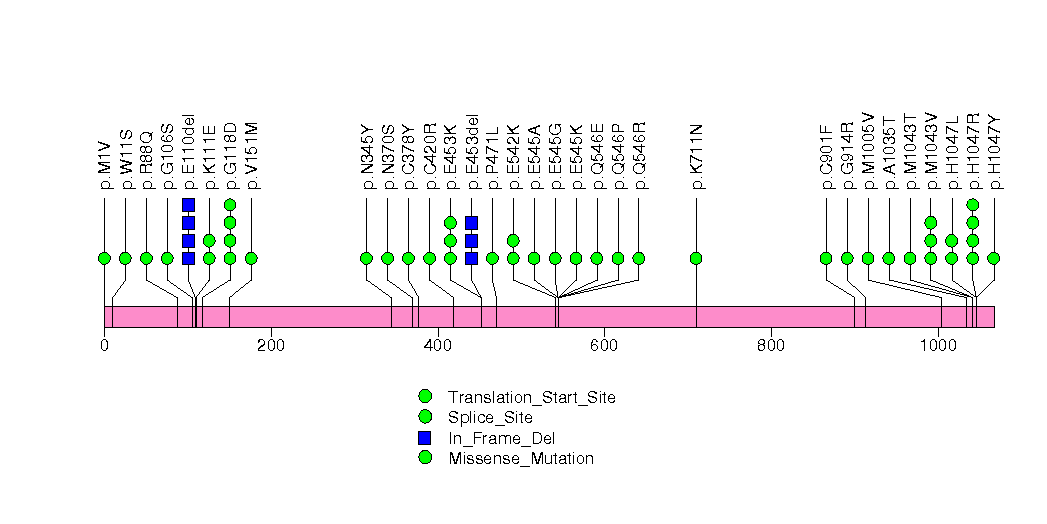
Figure S4. This figure depicts the distribution of mutations and mutation types across the ATRX significant gene.
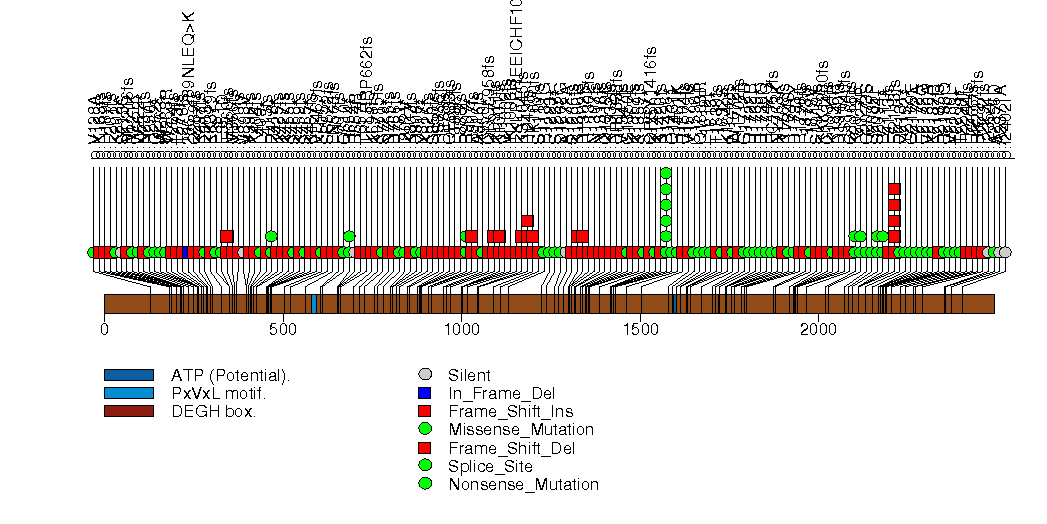
Figure S5. This figure depicts the distribution of mutations and mutation types across the ZBTB20 significant gene.
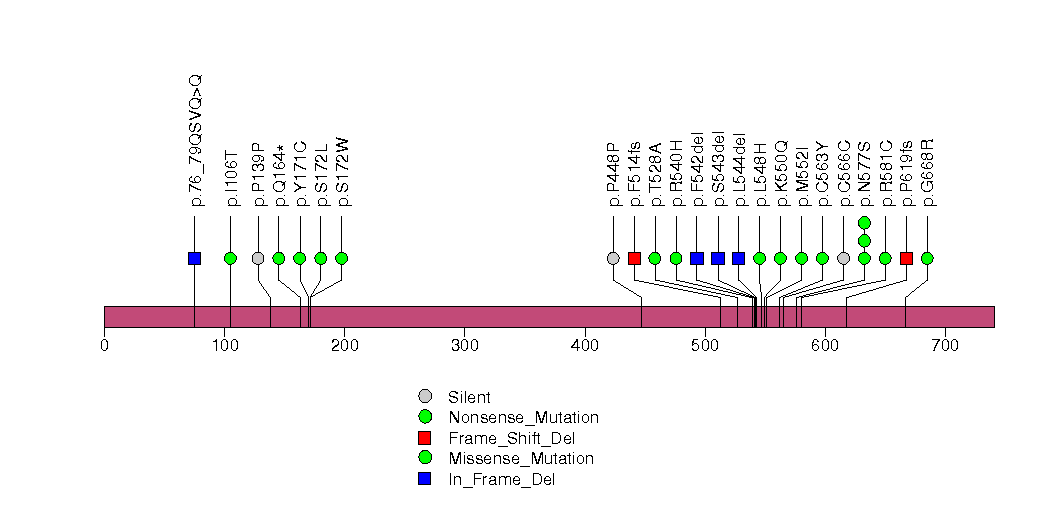
Figure S6. This figure depicts the distribution of mutations and mutation types across the IDH1 significant gene.
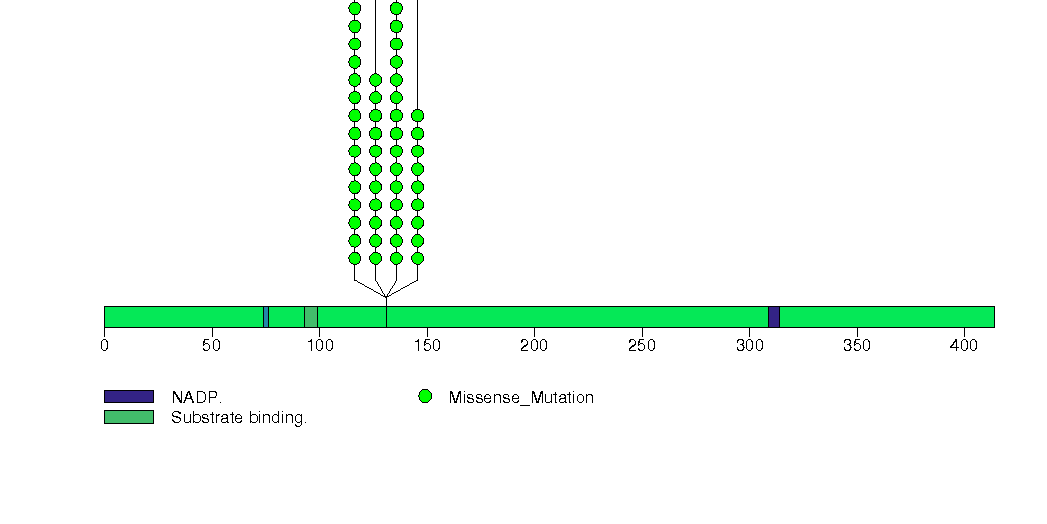
Figure S7. This figure depicts the distribution of mutations and mutation types across the TP53 significant gene.
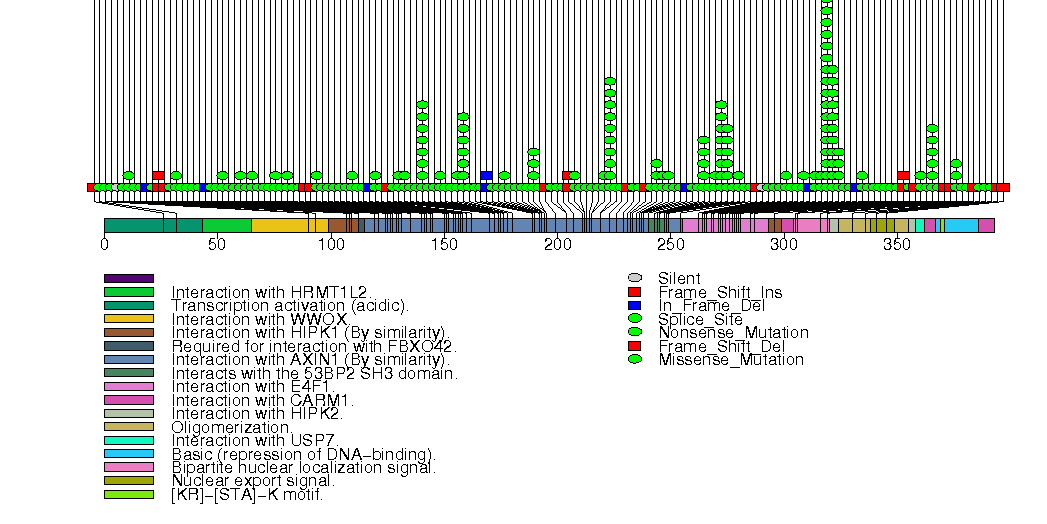
Figure S8. This figure depicts the distribution of mutations and mutation types across the CIC significant gene.
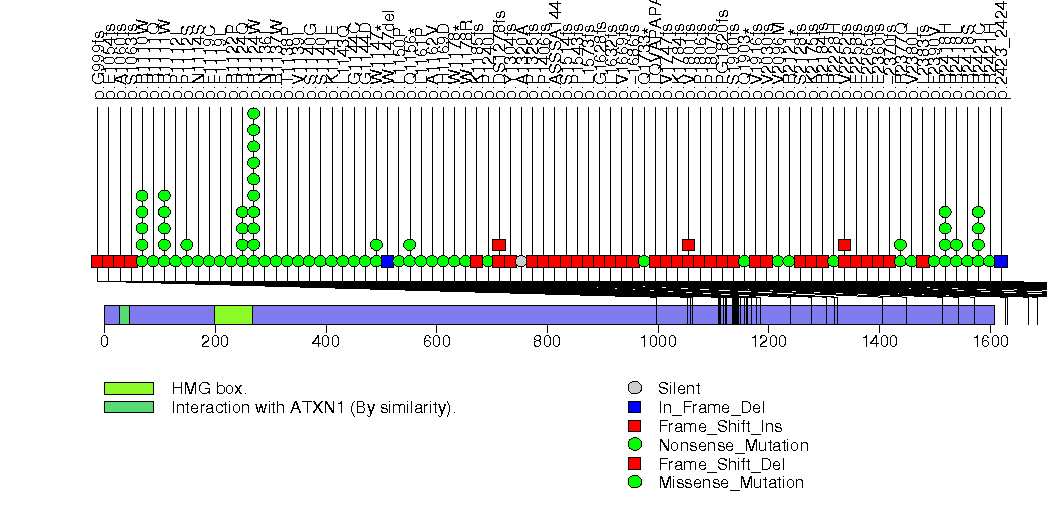
Figure S9. This figure depicts the distribution of mutations and mutation types across the NOTCH1 significant gene.
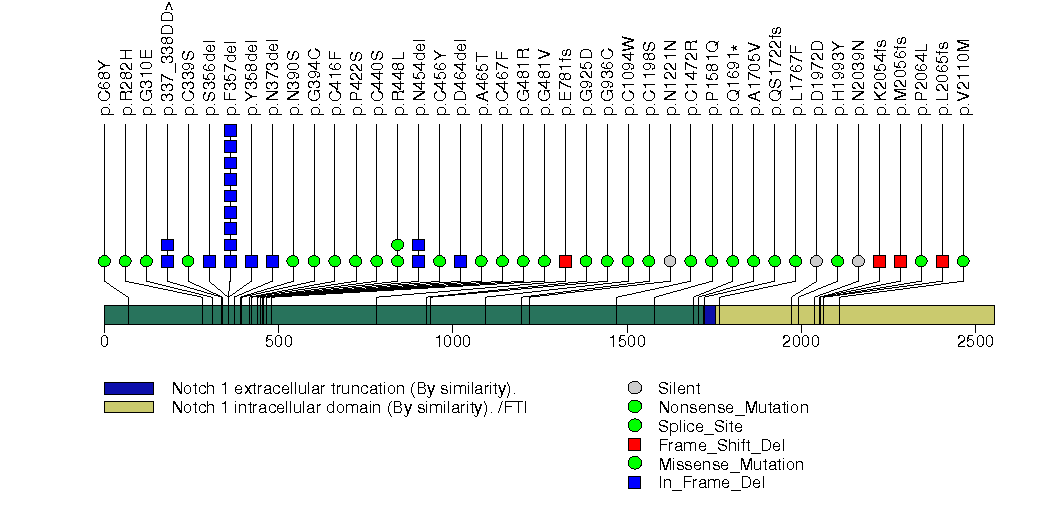
Figure S10. This figure depicts the distribution of mutations and mutation types across the IDH2 significant gene.
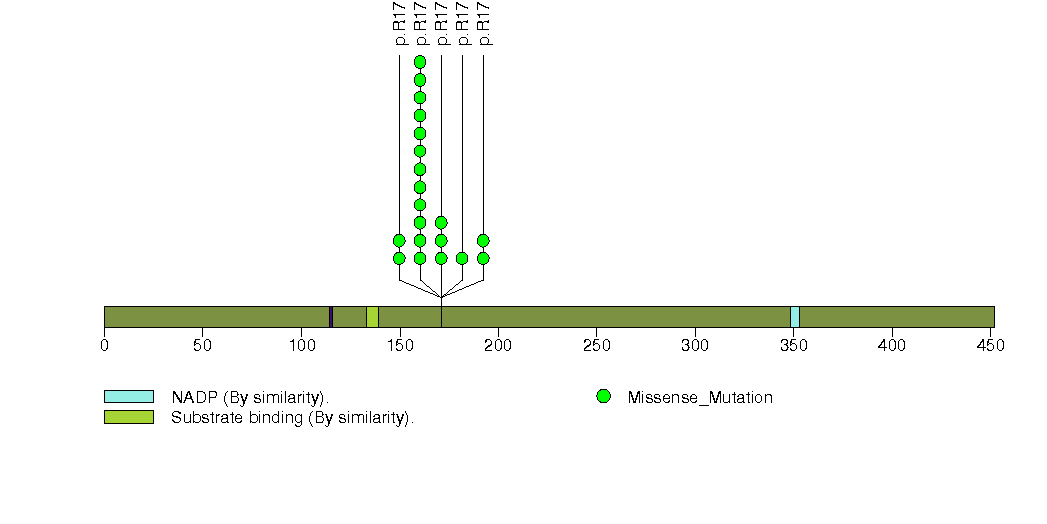
Figure S11. This figure depicts the distribution of mutations and mutation types across the ATAD3C significant gene.
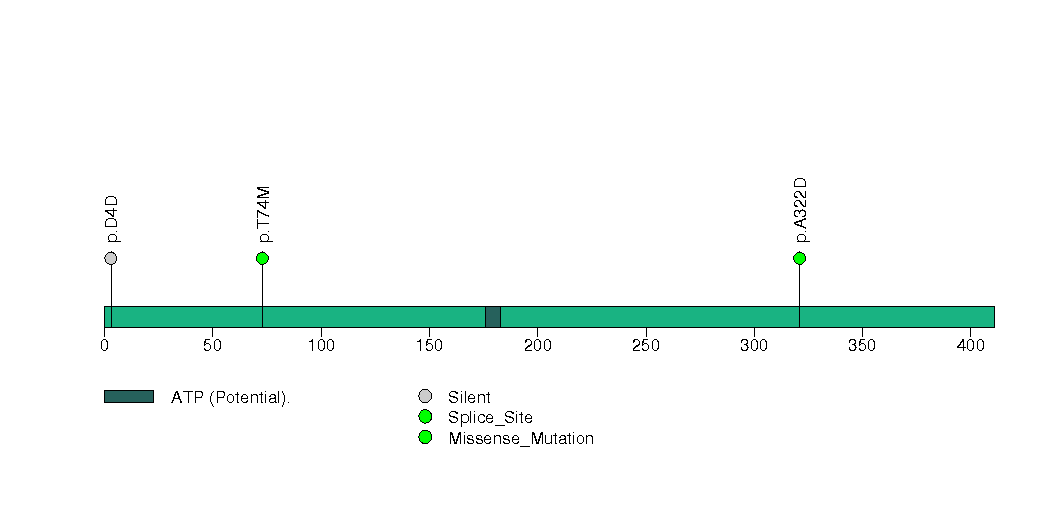
Figure S12. This figure depicts the distribution of mutations and mutation types across the HEATR3 significant gene.
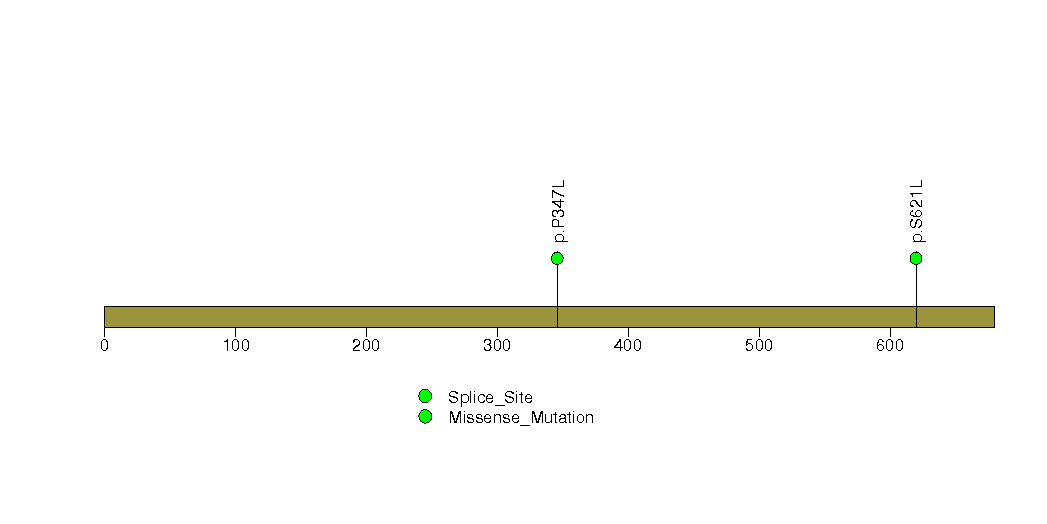
Figure S13. This figure depicts the distribution of mutations and mutation types across the NCK1 significant gene.
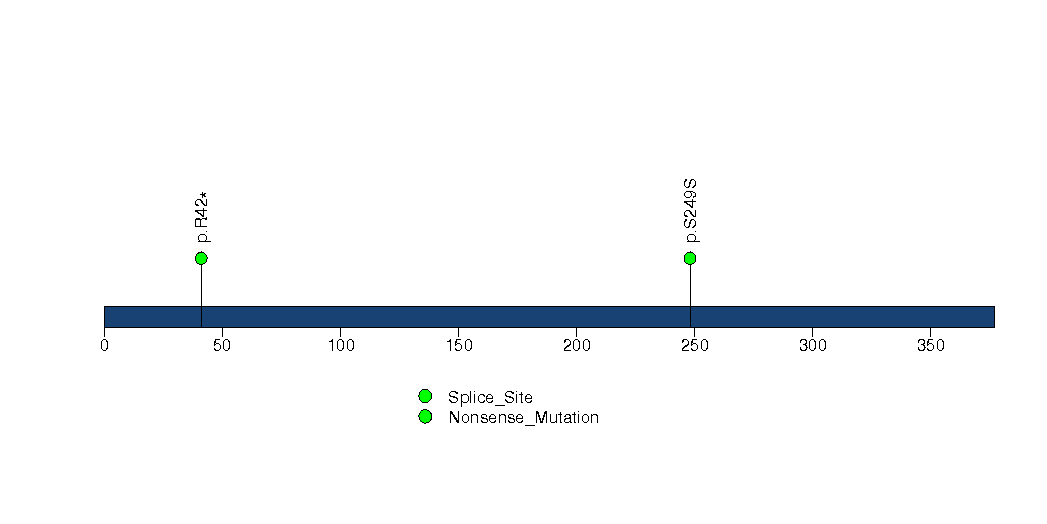
Figure S14. This figure depicts the distribution of mutations and mutation types across the PRCP significant gene.
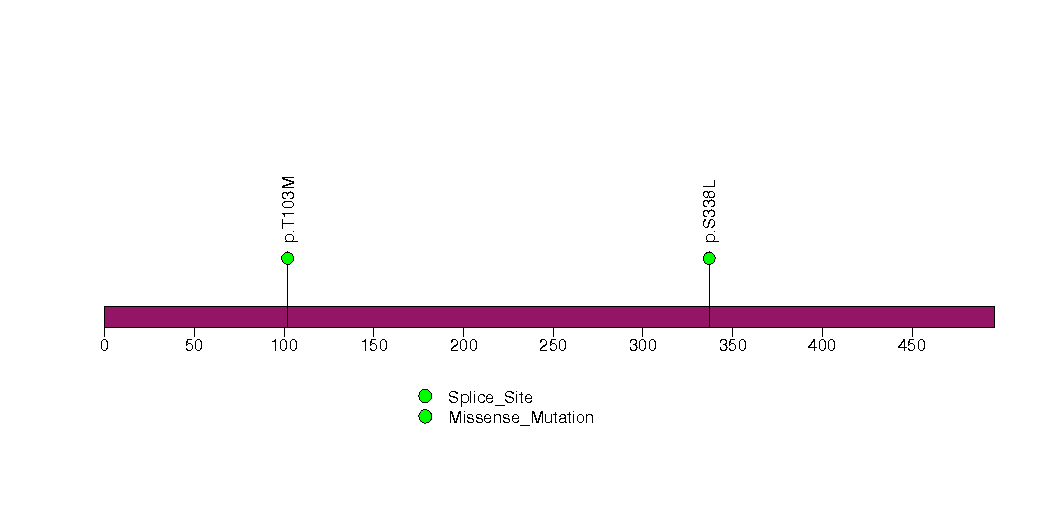
Figure S15. This figure depicts the distribution of mutations and mutation types across the TEAD3 significant gene.
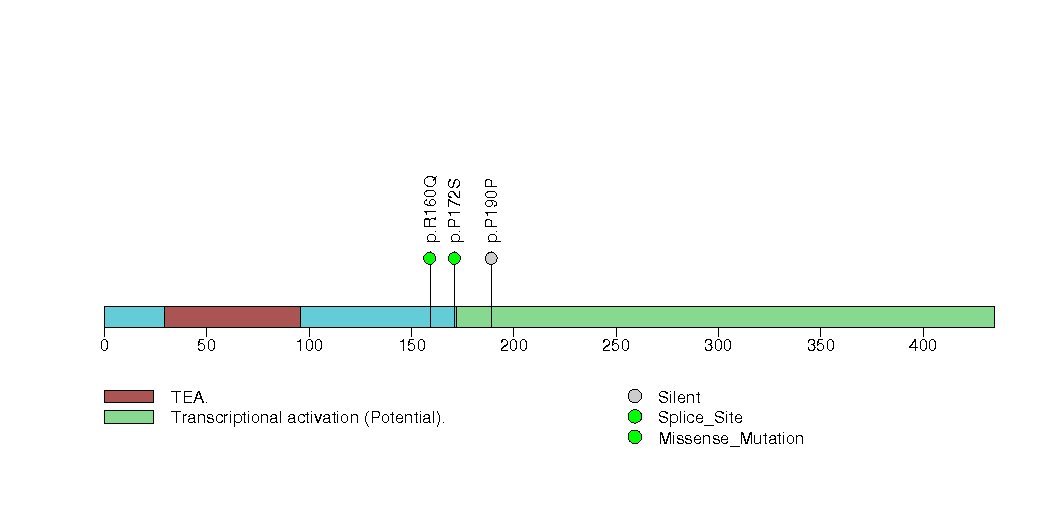
Figure S16. This figure depicts the distribution of mutations and mutation types across the FUBP1 significant gene.
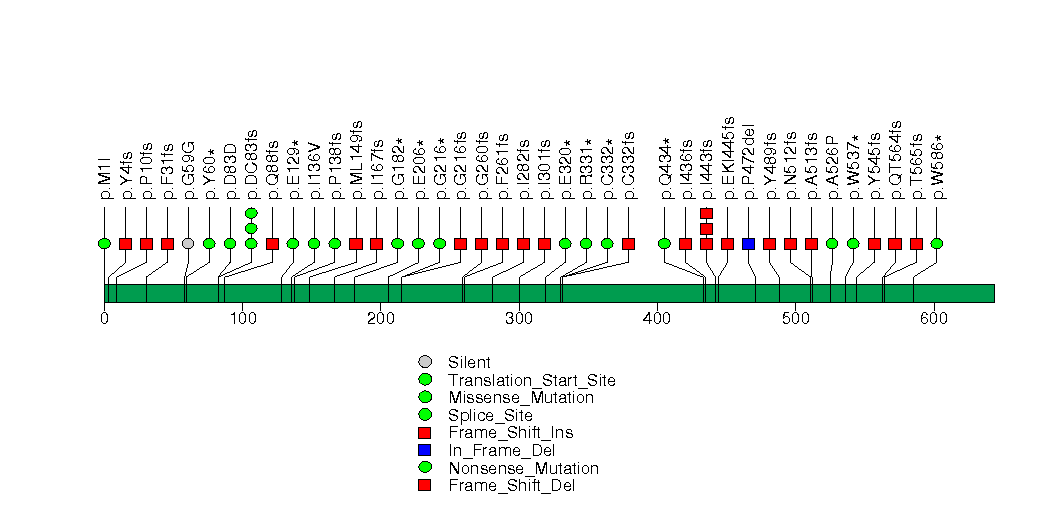
Figure S17. This figure depicts the distribution of mutations and mutation types across the NF1 significant gene.
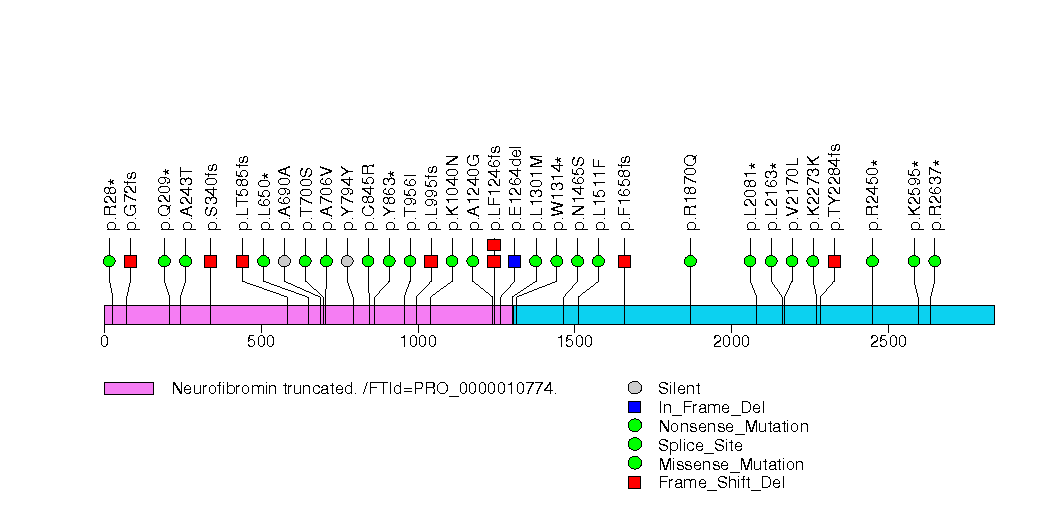
Figure S18. This figure depicts the distribution of mutations and mutation types across the PTEN significant gene.
Figure S19. This figure depicts the distribution of mutations and mutation types across the TCF12 significant gene.
Figure S20. This figure depicts the distribution of mutations and mutation types across the SMARCA4 significant gene.
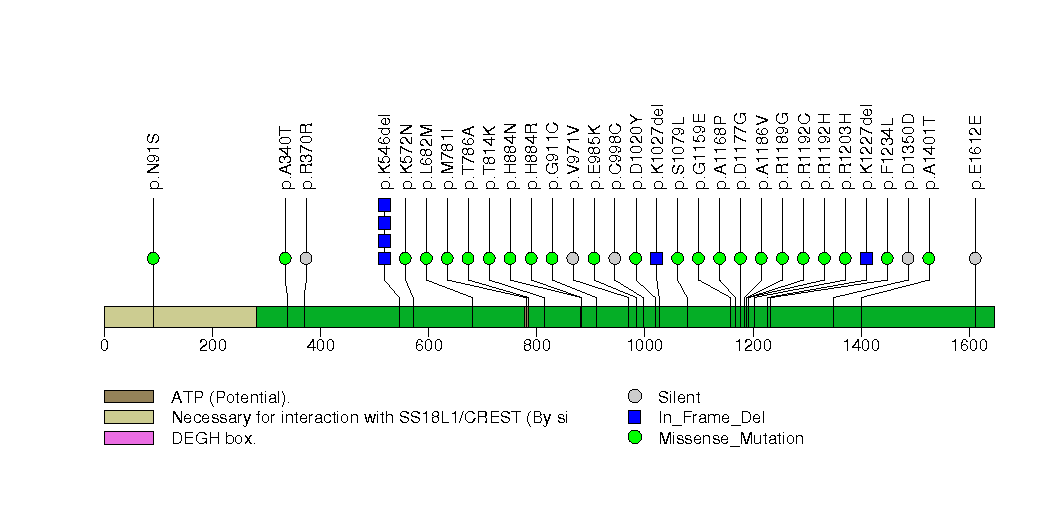
Figure S21. This figure depicts the distribution of mutations and mutation types across the STK19 significant gene.
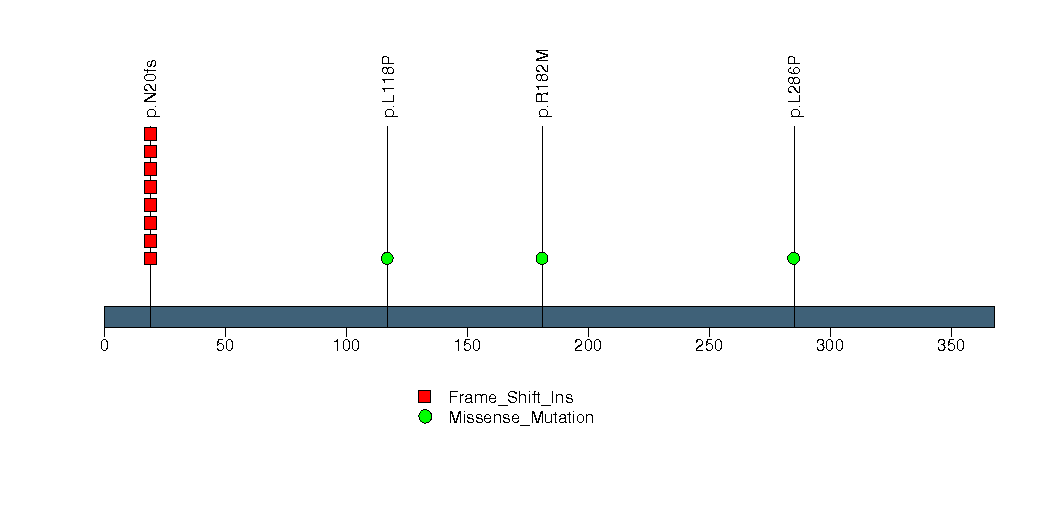
Figure S22. This figure depicts the distribution of mutations and mutation types across the EMG1 significant gene.
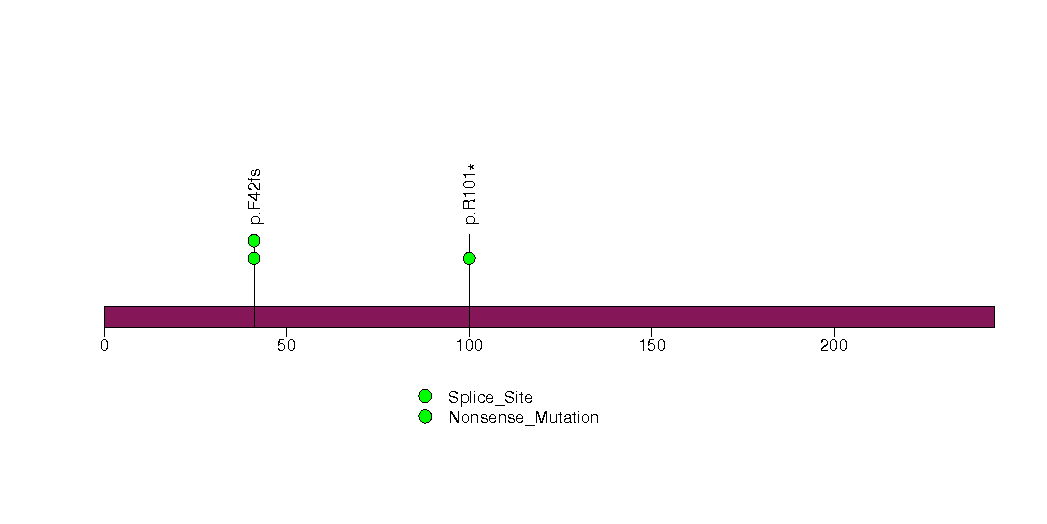
Figure S23. This figure depicts the distribution of mutations and mutation types across the EIF1AX significant gene.
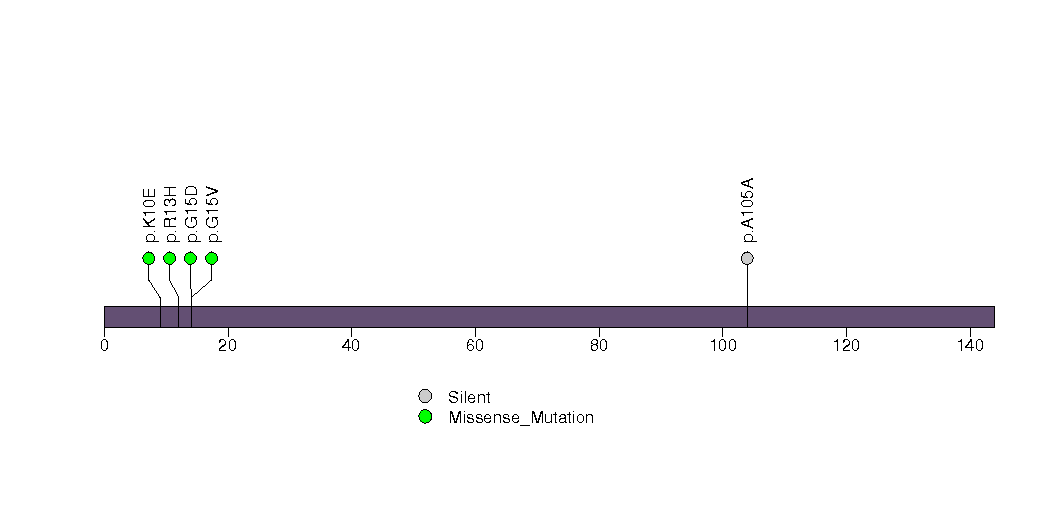
Figure S24. This figure depicts the distribution of mutations and mutation types across the ARID1A significant gene.
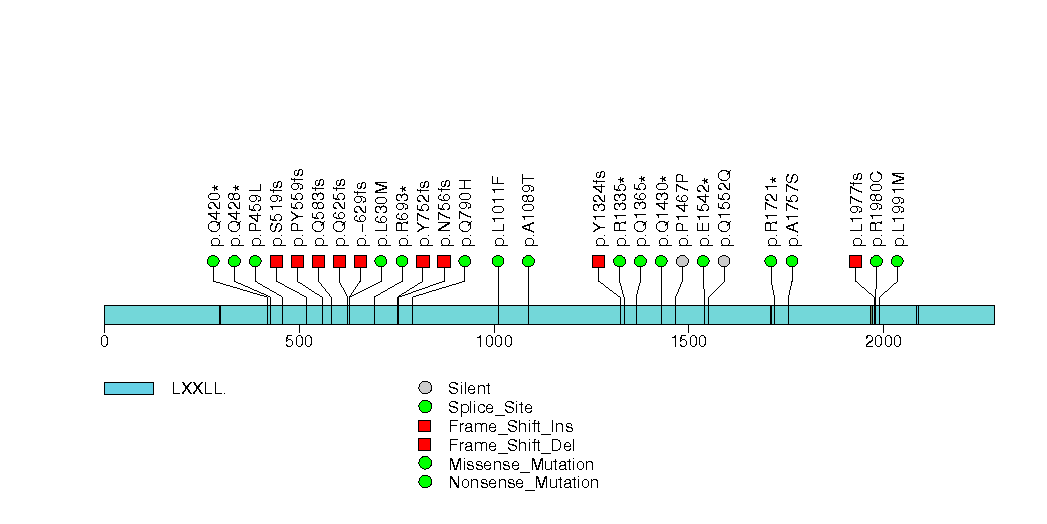
Figure S25. This figure depicts the distribution of mutations and mutation types across the CREBZF significant gene.
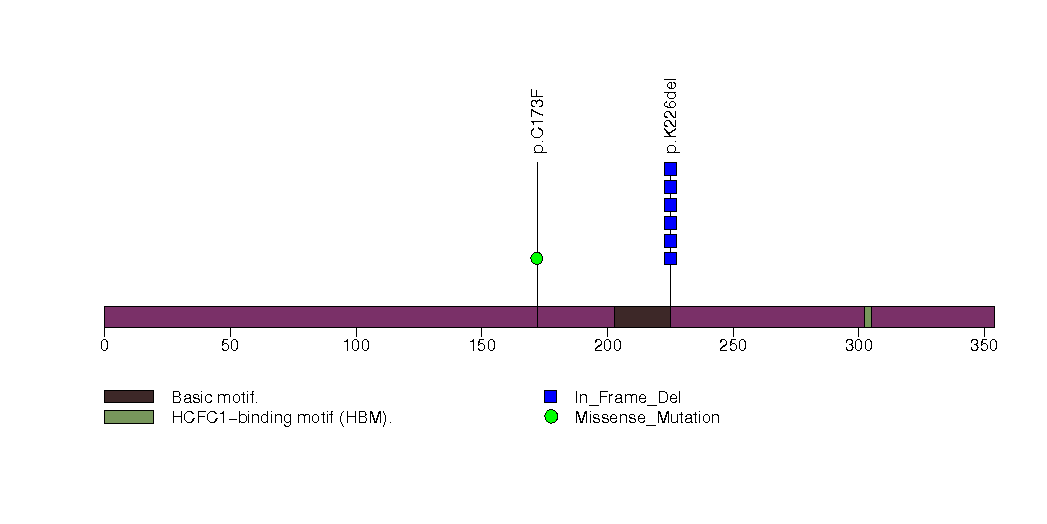
Figure S26. This figure depicts the distribution of mutations and mutation types across the ANKRD30A significant gene.
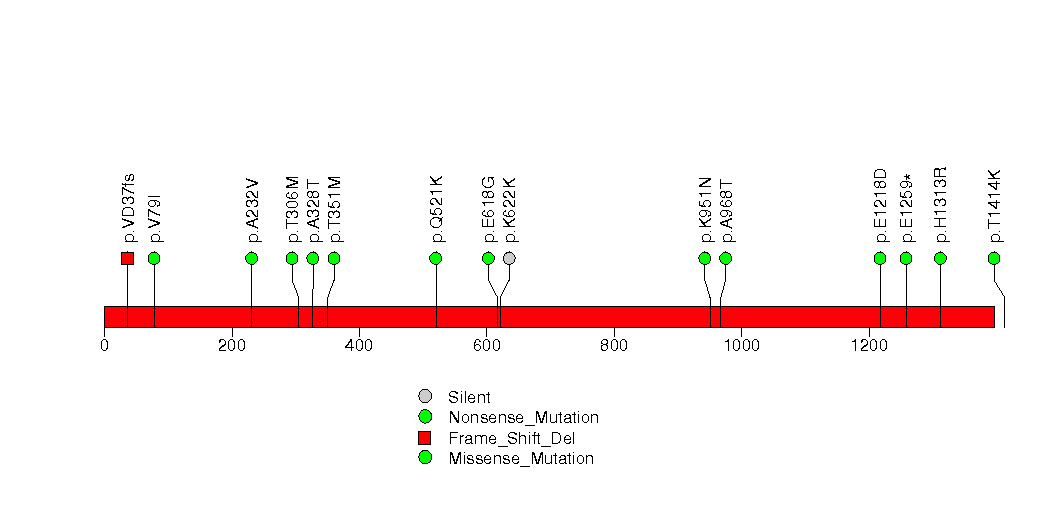
Figure S27. This figure depicts the distribution of mutations and mutation types across the KRT15 significant gene.
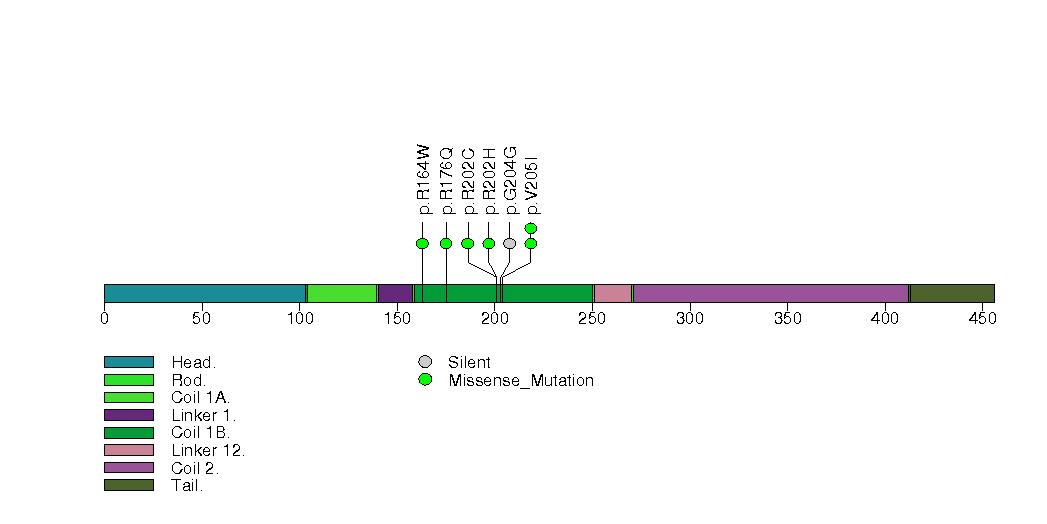
Figure S28. This figure depicts the distribution of mutations and mutation types across the ZNF709 significant gene.
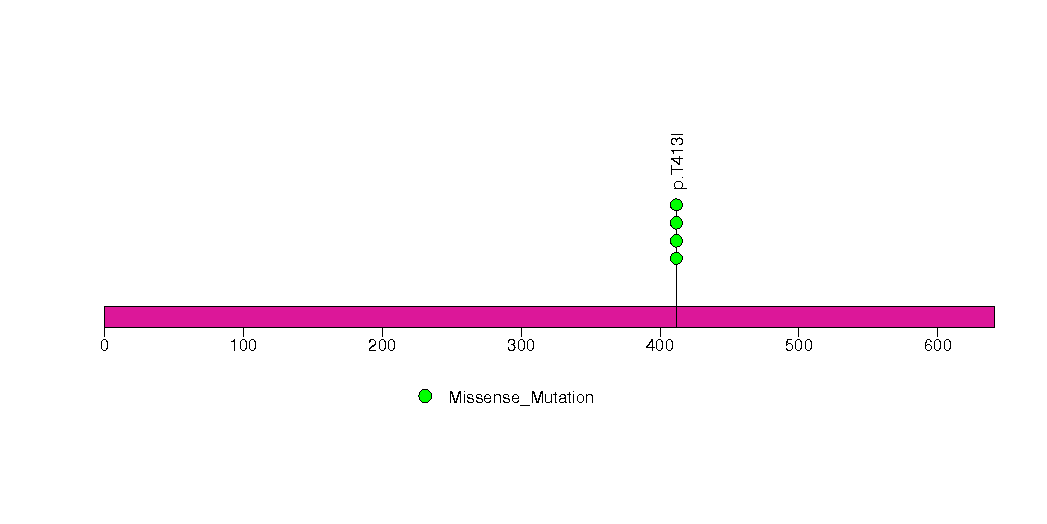
Figure S29. This figure depicts the distribution of mutations and mutation types across the MED9 significant gene.
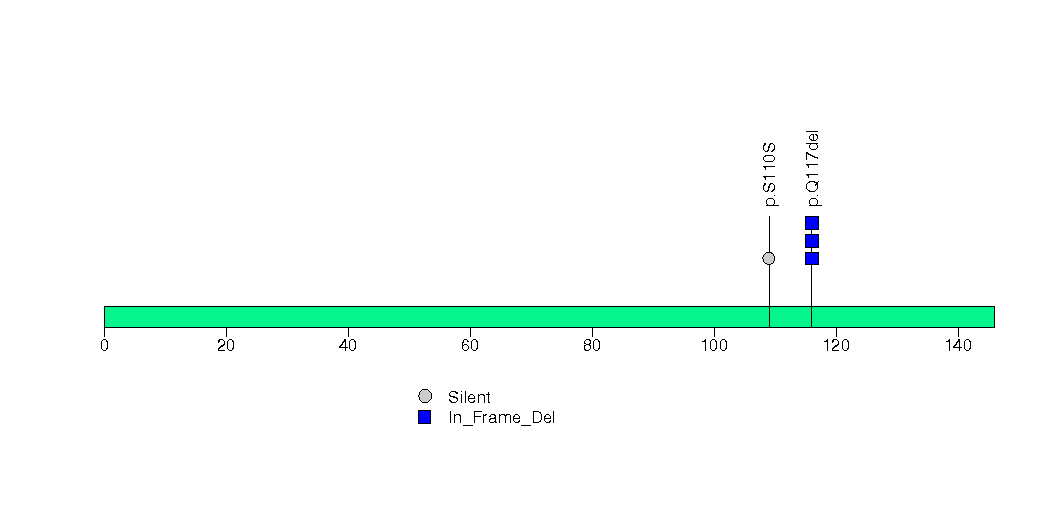
Figure S30. This figure depicts the distribution of mutations and mutation types across the NIPBL significant gene.
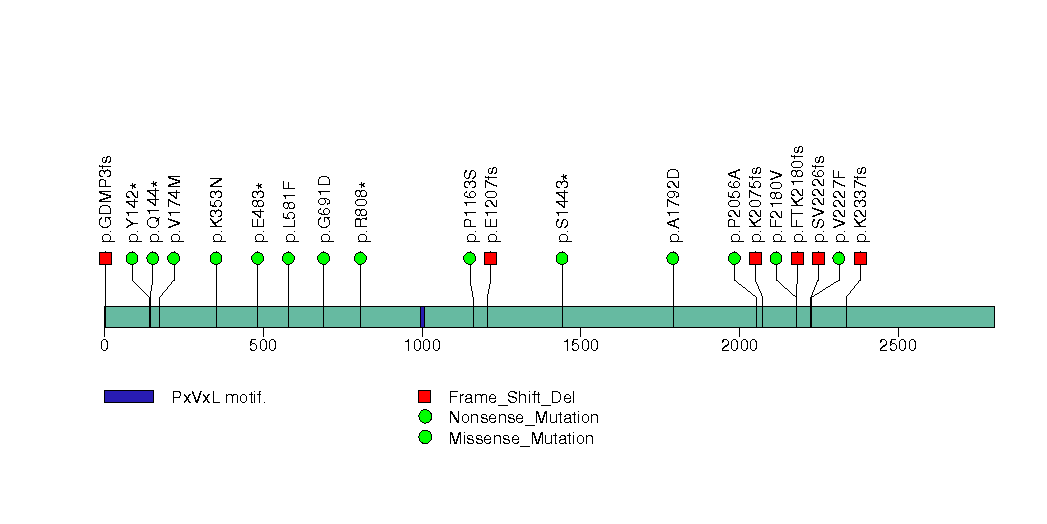
Figure S31. This figure depicts the distribution of mutations and mutation types across the LHFPL1 significant gene.
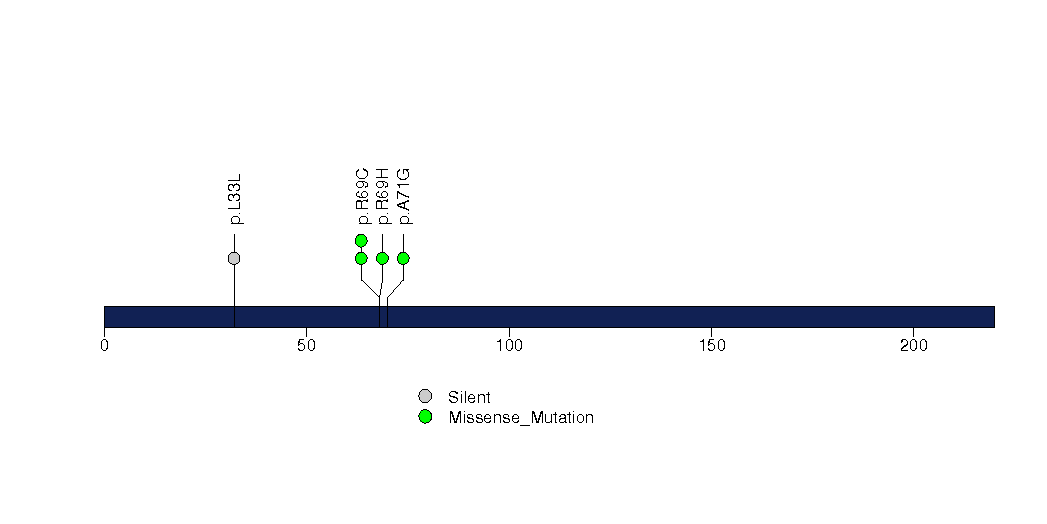
Figure S32. This figure depicts the distribution of mutations and mutation types across the MYH8 significant gene.
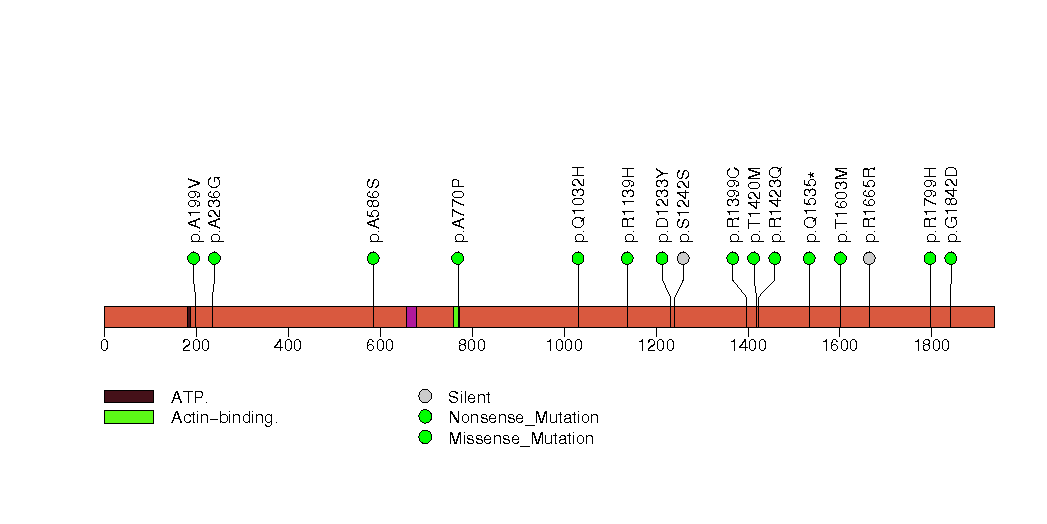
Figure S33. This figure depicts the distribution of mutations and mutation types across the RBPJ significant gene.
In this analysis, COSMIC is used as a filter to increase power by restricting the territory of each gene. Cosmic version: v48.
Table 4. Get Full Table Significantly mutated genes (COSMIC territory only). To access the database please go to: COSMIC. Number of significant genes found: 17. Number of genes displayed: 10
| rank | gene | description | n | cos | n_cos | N_cos | cos_ev | p | q |
|---|---|---|---|---|---|---|---|---|---|
| 1 | TP53 | tumor protein p53 | 312 | 356 | 301 | 182628 | 103672 | 0 | 0 |
| 2 | PIK3CA | phosphoinositide-3-kinase, catalytic, alpha polypeptide | 50 | 220 | 43 | 112860 | 10264 | 0 | 0 |
| 3 | EGFR | epidermal growth factor receptor (erythroblastic leukemia viral (v-erb-b) oncogene homolog, avian) | 46 | 293 | 31 | 150309 | 437 | 0 | 0 |
| 4 | PTEN | phosphatase and tensin homolog (mutated in multiple advanced cancers 1) | 25 | 767 | 24 | 393471 | 693 | 0 | 0 |
| 5 | IDH1 | isocitrate dehydrogenase 1 (NADP+), soluble | 398 | 5 | 398 | 2565 | 593816 | 2.5e-14 | 1.9e-11 |
| 6 | FUBP1 | far upstream element (FUSE) binding protein 1 | 49 | 4 | 5 | 2052 | 2 | 2.8e-14 | 1.9e-11 |
| 7 | IDH2 | isocitrate dehydrogenase 2 (NADP+), mitochondrial | 20 | 6 | 20 | 3078 | 1660 | 3e-14 | 1.9e-11 |
| 8 | SMARCA4 | SWI/SNF related, matrix associated, actin dependent regulator of chromatin, subfamily a, member 4 | 29 | 30 | 7 | 15390 | 4 | 1.5e-13 | 8e-11 |
| 9 | PIK3R1 | phosphoinositide-3-kinase, regulatory subunit 1 (alpha) | 23 | 33 | 13 | 16929 | 22 | 1.6e-13 | 8e-11 |
| 10 | NOTCH1 | Notch homolog 1, translocation-associated (Drosophila) | 52 | 292 | 12 | 149796 | 26 | 1.1e-12 | 4.9e-10 |
Note:
n - number of (nonsilent) mutations in this gene across the individual set.
cos = number of unique mutated sites in this gene in COSMIC
n_cos = overlap between n and cos.
N_cos = number of individuals times cos.
cos_ev = total evidence: number of reports in COSMIC for mutations seen in this gene.
p = p-value for seeing the observed amount of overlap in this gene)
q = q-value, False Discovery Rate (Benjamini-Hochberg procedure)
Table 5. Get Full Table A Ranked List of Significantly Mutated Genesets. (Source: MSigDB GSEA Cannonical Pathway Set).Number of significant genesets found: 103. Number of genesets displayed: 10
| rank | geneset | description | genes | N_genes | mut_tally | N | n | npat | nsite | nsil | n1 | n2 | n3 | n4 | n5 | n6 | p_ns_s | p | q |
|---|---|---|---|---|---|---|---|---|---|---|---|---|---|---|---|---|---|---|---|
| 1 | GLUTATHIONE_METABOLISM | ANPEP, G6PD, GCLC, GCLM, GGT1, GPX1, GPX2, GPX3, GPX4, GPX5, GSS, GSTA1, GSTA2, GSTA3, GSTA4, GSTM1, GSTM2, GSTM3, GSTM4, GSTM5, GSTO2, GSTP1, GSTT1, GSTT2, GSTZ1, IDH1, IDH2, MGST1, MGST2, MGST3, PGD | 30 | ANPEP(3), G6PD(2), GCLC(1), GGT1(2), GPX2(2), GPX4(1), GSS(1), GSTA1(1), GSTA2(1), GSTA3(1), GSTA4(1), GSTM4(1), GSTM5(1), GSTT1(1), GSTZ1(3), IDH1(398), IDH2(20), PGD(1) | 13770087 | 441 | 422 | 28 | 13 | 385 | 16 | 7 | 29 | 4 | 0 | <1.00e-15 | <1.00e-15 | <2.93e-14 | |
| 2 | HSA00720_REDUCTIVE_CARBOXYLATE_CYCLE | Genes involved in reductive carboxylate cycle (CO2 fixation) | ACLY, ACO1, ACO2, ACSS1, ACSS2, FH, IDH1, IDH2, LOC441996, MDH1, MDH2, SUCLA2 | 11 | ACLY(3), ACO1(5), ACO2(4), ACSS1(1), ACSS2(4), FH(1), IDH1(398), IDH2(20) | 10145121 | 436 | 421 | 23 | 1 | 384 | 16 | 4 | 29 | 3 | 0 | <1.00e-15 | <1.00e-15 | <2.93e-14 |
| 3 | HSA00020_CITRATE_CYCLE | Genes involved in citrate cycle (TCA cycle) | ACLY, ACO1, ACO2, CLYBL, CS, DLD, DLST, FH, IDH1, IDH2, IDH3A, IDH3B, IDH3G, LOC283398, LOC441996, MDH1, MDH2, OGDH, OGDHL, PC, PCK1, PCK2, SDHA, SDHB, SDHC, SDHD, SUCLA2, SUCLG1, SUCLG2 | 27 | ACLY(3), ACO1(5), ACO2(4), CLYBL(1), DLD(1), FH(1), IDH1(398), IDH2(20), IDH3B(1), OGDH(1), OGDHL(4), PC(2), PCK1(3), SDHA(4), SDHC(2), SUCLG2(1) | 22764387 | 451 | 420 | 37 | 9 | 388 | 18 | 9 | 32 | 4 | 0 | <1.00e-15 | <1.00e-15 | <2.93e-14 |
| 4 | CITRATE_CYCLE_TCA_CYCLE | ACO1, ACO2, CS, DLD, DLST, DLSTP, FH, IDH1, IDH2, IDH3A, IDH3B, IDH3G, MDH1, MDH2, PC, PCK1, SDHA, SDHA, SDHAL2, SDHB, SUCLA2, SUCLG1, SUCLG2 | 20 | ACO1(5), ACO2(4), DLD(1), FH(1), IDH1(398), IDH2(20), IDH3B(1), PC(2), PCK1(3), SDHA(4), SUCLG2(1) | 15706931 | 440 | 419 | 26 | 2 | 384 | 17 | 7 | 29 | 3 | 0 | <1.00e-15 | <1.00e-15 | <2.93e-14 | |
| 5 | REDUCTIVE_CARBOXYLATE_CYCLE_CO2_FIXATION | ACO1, ACO2, FH, IDH1, IDH2, MDH1, MDH2, SDHB, SUCLA2 | 9 | ACO1(5), ACO2(4), FH(1), IDH1(398), IDH2(20) | 6791681 | 428 | 419 | 15 | 0 | 381 | 14 | 4 | 28 | 1 | 0 | <1.00e-15 | <1.00e-15 | <2.93e-14 | |
| 6 | HSA04210_APOPTOSIS | Genes involved in apoptosis | AIFM1, AKT1, AKT2, AKT3, APAF1, ATM, BAD, BAX, BCL2, BCL2L1, BID, BIRC2, BIRC3, BIRC4, CAPN1, CAPN2, CASP10, CASP3, CASP6, CASP7, CASP8, CASP9, CFLAR, CHP, CHUK, CSF2RB, CYCS, DFFA, DFFB, ENDOG, FADD, FAS, FASLG, IKBKB, IKBKG, IL1A, IL1B, IL1R1, IL1RAP, IL3, IL3RA, IRAK1, IRAK2, IRAK3, IRAK4, MAP3K14, MYD88, NFKB1, NFKB2, NFKBIA, NGFB, NTRK1, PIK3CA, PIK3CB, PIK3CD, PIK3CG, PIK3R1, PIK3R2, PIK3R3, PIK3R5, PPP3CA, PPP3CB, PPP3CC, PPP3R1, PPP3R2, PRKACA, PRKACB, PRKACG, PRKAR1A, PRKAR1B, PRKAR2A, PRKAR2B, RELA, RIPK1, TNF, TNFRSF10A, TNFRSF10B, TNFRSF10C, TNFRSF10D, TNFRSF1A, TNFSF10, TP53, TRADD, TRAF2 | 80 | AIFM1(4), AKT1(1), APAF1(3), ATM(8), BAX(1), BCL2(1), BIRC2(2), CASP10(1), CASP8(2), CFLAR(1), CSF2RB(2), CYCS(2), DFFA(2), FAS(1), FASLG(1), IKBKB(1), IL1B(2), IL1R1(2), IL1RAP(1), IL3(1), IL3RA(2), IRAK1(1), IRAK2(2), IRAK3(6), IRAK4(2), NFKB1(1), NFKB2(1), NFKBIA(2), NTRK1(3), PIK3CA(50), PIK3CB(3), PIK3CD(3), PIK3CG(5), PIK3R1(23), PIK3R2(1), PIK3R3(1), PIK3R5(1), PPP3CA(1), PPP3CB(1), PPP3CC(1), PPP3R2(1), PRKACG(1), PRKAR1A(2), RELA(1), RIPK1(3), TNF(1), TNFRSF10C(1), TNFRSF10D(1), TP53(312), TRADD(1), TRAF2(2) | 63687268 | 475 | 316 | 277 | 38 | 128 | 59 | 77 | 102 | 101 | 8 | <1.00e-15 | <1.00e-15 | <2.93e-14 |
| 7 | TELPATHWAY | Telomerase is a ribonucleotide protein that adds telomeric repeats to the 3' ends of chromosomes. | AKT1, BCL2, EGFR, G22P1, HSPCA, IGF1R, KRAS2, MYC, POLR2A, PPP2CA, PRKCA, RB1, TEP1, TERF1, TERT, TNKS, TP53, XRCC5 | 15 | AKT1(1), BCL2(1), EGFR(46), IGF1R(7), POLR2A(7), PPP2CA(4), PRKCA(5), RB1(6), TEP1(8), TERF1(1), TERT(2), TNKS(1), TP53(312), XRCC5(3) | 21504324 | 404 | 294 | 216 | 10 | 130 | 47 | 57 | 94 | 68 | 8 | <1.00e-15 | <1.00e-15 | <2.93e-14 |
| 8 | HSA04115_P53_SIGNALING_PATHWAY | Genes involved in p53 signaling pathway | APAF1, ATM, ATR, BAI1, BAX, BBC3, BID, CASP3, CASP8, CASP9, CCNB1, CCNB2, CCNB3, CCND1, CCND2, CCND3, CCNE1, CCNE2, CCNG1, CCNG2, CD82, CDC2, CDK2, CDK4, CDK6, CDKN1A, CDKN2A, CHEK1, CHEK2, CYCS, DDB2, EI24, FAS, GADD45A, GADD45B, GADD45G, GTSE1, IGF1, IGFBP3, LRDD, MDM2, MDM4, P53AIP1, PERP, PMAIP1, PPM1D, PTEN, RCHY1, RFWD2, RPRM, RRM2, RRM2B, SCOTIN, SERPINB5, SERPINE1, SESN1, SESN2, SESN3, SFN, SIAH1, STEAP3, THBS1, TNFRSF10B, TP53, TP53I3, TP73, TSC2, ZMAT3 | 64 | APAF1(3), ATM(8), ATR(6), BAI1(4), BAX(1), CASP8(2), CCNB1(2), CCNB2(1), CCNB3(4), CCND1(4), CCNE1(1), CCNE2(1), CCNG2(2), CDK2(1), CDK4(1), CDKN1A(1), CDKN2A(4), CHEK1(3), CHEK2(3), CYCS(2), DDB2(2), EI24(4), FAS(1), GTSE1(4), IGF1(1), MDM2(3), MDM4(1), PPM1D(3), PTEN(25), RCHY1(1), RFWD2(4), RRM2B(1), SERPINB5(2), SERPINE1(2), SESN1(1), SESN2(1), SESN3(1), SFN(2), SIAH1(3), STEAP3(2), THBS1(4), TP53(312), TP53I3(1), TSC2(3), ZMAT3(3) | 49759824 | 441 | 293 | 267 | 30 | 128 | 48 | 72 | 98 | 88 | 7 | <1.00e-15 | <1.00e-15 | <2.93e-14 |
| 9 | G1_TO_S_CELL_CYCLE_REACTOME | ATM, CCNA1, CCNB1, CCND1, CCND2, CCND3, CCNE1, CCNE2, CCNG2, CCNH, CDC25A, CDC45L, CDK2, CDK4, CDK7, CDKN1A, CDKN1B, CDKN1C, CDKN2A, CDKN2B, CDKN2C, CDKN2D, CREB3, CREB3L1, CREB3L3, CREB3L4, CREBL1, CREBL1, TNXB, E2F1, E2F2, E2F3, E2F4, E2F5, E2F6, FLJ14001, GADD45A, GBA2, MCM2, MCM3, MCM4, MCM5, MCM6, MCM7, MDM2, MNAT1, MYC, MYT1, NACA, NACA, FKSG17, ORC1L, ORC2L, ORC3L, ORC4L, ORC5L, ORC6L, PCNA, POLA2, POLE, POLE2, PRIM1, PRIM2A, RB1, RBL1, RPA1, RPA2, RPA3, TFDP1, TFDP2, TP53, WEE1 | 64 | ATM(8), CCNA1(2), CCNB1(2), CCND1(4), CCNE1(1), CCNE2(1), CCNG2(2), CCNH(2), CDC25A(1), CDK2(1), CDK4(1), CDKN1A(1), CDKN1B(3), CDKN2A(4), CDKN2C(3), CREB3(3), CREB3L1(1), CREB3L3(1), E2F1(1), E2F2(1), E2F3(1), E2F5(1), GBA2(1), MCM3(1), MCM4(3), MCM5(1), MCM6(3), MCM7(4), MDM2(3), MYT1(7), NACA(5), POLA2(1), POLE(8), PRIM1(1), RB1(6), RBL1(4), RPA1(3), TNXB(11), TP53(312), WEE1(1) | 58855578 | 420 | 277 | 249 | 35 | 126 | 39 | 62 | 90 | 96 | 7 | <1.00e-15 | <1.00e-15 | <2.93e-14 | |
| 10 | APOPTOSIS | APAF1, BAD, BAK1, BCL2L7P1, BAX, BCL2, BCL2L1, BCL2L11, BID, BIRC2, BIRC3, BIRC4, BIRC5, BNIP3L, CASP1, CASP10, CASP1, COPl, CASP2, CASP3, CASP4, CASP6, CASP7, CASP8, CASP9, CHUK, CYCS, DFFA, DFFB, FADD, FAS, FASLG, GZMB, HELLS, HRK, IKBKB, IKBKG, IRF1, IRF2, IRF3, IRF4, IRF5, IRF6, IRF7, JUN, LTA, MAP2K4, MAP3K1, MAPK10, MDM2, MYC, NFKB1, NFKBIA, NFKBIB, NFKBIE, PRF1, RELA, RIPK1, TNF, TNFRSF10B, TNFRSF1A, TNFRSF1B, TNFRSF21, TNFRSF25, TNFRSF25, PLEKHG5, TNFSF10, TP53, TP73, TRADD, TRAF1, TRAF2, TRAF3 | 66 | APAF1(3), BAK1(2), BAX(1), BCL2(1), BCL2L11(1), BIRC2(2), CASP1(4), CASP10(1), CASP2(1), CASP4(1), CASP8(2), CYCS(2), DFFA(2), FAS(1), FASLG(1), GZMB(1), HELLS(3), IKBKB(1), IRF1(4), IRF2(1), IRF3(3), IRF4(2), IRF5(1), IRF6(2), IRF7(3), MAP3K1(3), MAPK10(1), MDM2(3), NFKB1(1), NFKBIA(2), NFKBIE(1), PLEKHG5(3), PRF1(3), RELA(1), RIPK1(3), TNF(1), TNFRSF1B(2), TNFRSF21(2), TNFRSF25(1), TP53(312), TRADD(1), TRAF2(2), TRAF3(1) | 43592440 | 389 | 266 | 218 | 26 | 134 | 43 | 52 | 83 | 70 | 7 | <1.00e-15 | <1.00e-15 | <2.93e-14 |
Table 6. Get Full Table A Ranked List of Significantly Mutated Genesets (Excluding Significantly Mutated Genes). Number of significant genesets found: 0. Number of genesets displayed: 10
| rank | geneset | description | genes | N_genes | mut_tally | N | n | npat | nsite | nsil | n1 | n2 | n3 | n4 | n5 | n6 | p_ns_s | p | q |
|---|---|---|---|---|---|---|---|---|---|---|---|---|---|---|---|---|---|---|---|
| 1 | HSA00902_MONOTERPENOID_BIOSYNTHESIS | Genes involved in monoterpenoid biosynthesis | CYP2C19, CYP2C9 | 2 | CYP2C19(4), CYP2C9(3) | 1546684 | 7 | 7 | 7 | 0 | 3 | 2 | 0 | 1 | 1 | 0 | 0.13 | 0.0029 | 1 |
| 2 | SA_G1_AND_S_PHASES | Cdk2, 4, and 6 bind cyclin D in G1, while cdk2/cyclin E promotes the G1/S transition. | ARF1, ARF3, CCND1, CDK2, CDK4, CDKN1A, CDKN1B, CDKN2A, CFL1, E2F1, E2F2, MDM2, NXT1, PRB1, TP53 | 14 | ARF1(1), CCND1(4), CDK2(1), CDK4(1), CDKN1A(1), CDKN1B(3), CDKN2A(4), CFL1(1), E2F1(1), E2F2(1), MDM2(3), PRB1(1) | 5771295 | 22 | 17 | 22 | 3 | 5 | 1 | 4 | 4 | 8 | 0 | 0.087 | 0.0034 | 1 |
| 3 | SA_REG_CASCADE_OF_CYCLIN_EXPR | Expression of cyclins regulates progression through the cell cycle by activating cyclin-dependent kinases. | CCNA1, CCNA2, CCND1, CCNE1, CCNE2, CDK2, CDK4, CDKN1B, CDKN2A, E2F1, E2F2, E2F4, PRB1 | 13 | CCNA1(2), CCND1(4), CCNE1(1), CCNE2(1), CDK2(1), CDK4(1), CDKN1B(3), CDKN2A(4), E2F1(1), E2F2(1), PRB1(1) | 6796377 | 20 | 16 | 20 | 0 | 4 | 1 | 5 | 2 | 8 | 0 | 0.0026 | 0.0097 | 1 |
| 4 | RIBOFLAVIN_METABOLISM | ACP1, ACP2, ACP5, ACPP, ACPT, ENPP1, ENPP3, FLAD1, RFK, TYR | 10 | ACP1(1), ACPP(4), ENPP1(4), ENPP3(2), FLAD1(3), TYR(4) | 7393124 | 18 | 15 | 18 | 1 | 6 | 2 | 3 | 5 | 2 | 0 | 0.028 | 0.017 | 1 | |
| 5 | SKP2E2FPATHWAY | E2F-1, a transcription factor that promotes the G1/S transition, is repressed by Rb and activated by cdk2/cyclin E. | CCNA1, CCNE1, CDC34, CDK2, CUL1, E2F1, RB1, SKP1A, SKP2, TFDP1 | 9 | CCNA1(2), CCNE1(1), CDC34(2), CDK2(1), CUL1(1), E2F1(1), RB1(6), SKP2(3) | 6521310 | 17 | 14 | 17 | 1 | 2 | 3 | 4 | 1 | 7 | 0 | 0.068 | 0.023 | 1 |
| 6 | HSA00643_STYRENE_DEGRADATION | Genes involved in styrene degradation | FAH, GSTZ1, HGD | 3 | FAH(2), GSTZ1(3), HGD(5) | 1697424 | 10 | 6 | 10 | 2 | 4 | 0 | 1 | 2 | 3 | 0 | 0.31 | 0.031 | 1 |
| 7 | CELLCYCLEPATHWAY | Cyclins interact with cyclin-dependent kinases to form active kinase complexes that regulate progression through the cell cycle. | CCNA1, CCNB1, CCND1, CCND2, CCND3, CCNE1, CCNH, CDC2, CDC25A, CDK2, CDK4, CDK6, CDK7, CDKN1A, CDKN1B, CDKN2A, CDKN2B, CDKN2C, CDKN2D, E2F1, RB1, RBL1, TFDP1 | 22 | CCNA1(2), CCNB1(2), CCND1(4), CCNE1(1), CCNH(2), CDC25A(1), CDK2(1), CDK4(1), CDKN1A(1), CDKN1B(3), CDKN2A(4), CDKN2C(3), E2F1(1), RB1(6), RBL1(4) | 12244687 | 36 | 25 | 36 | 4 | 7 | 3 | 8 | 5 | 13 | 0 | 0.02 | 0.043 | 1 |
| 8 | FBW7PATHWAY | Cyclin E interacts with cell cycle checkpoint kinase cdk2 to allow transcription of genes required for S phase, including transcription of additional cyclin E. | CCNE1, CDC34, CDK2, CUL1, E2F1, FBXW7, RB1, SKP1A, TFDP1 | 8 | CCNE1(1), CDC34(2), CDK2(1), CUL1(1), E2F1(1), FBXW7(5), RB1(6) | 6310719 | 17 | 13 | 17 | 1 | 4 | 3 | 2 | 2 | 6 | 0 | 0.06 | 0.045 | 1 |
| 9 | P27PATHWAY | p27 blocks the G1/S transition by inhibiting the checkpoint kinase cdk2/cyclin E and is inhibited by cdk2-mediated ubiquitination. | CCNE1, CDK2, CDKN1B, CKS1B, CUL1, E2F1, NEDD8, RB1, RBX1, SKP1A, SKP2, TFDP1, UBE2M | 12 | CCNE1(1), CDK2(1), CDKN1B(3), CUL1(1), E2F1(1), RB1(6), RBX1(1), SKP2(3), UBE2M(1) | 6533825 | 18 | 15 | 18 | 2 | 1 | 4 | 4 | 1 | 8 | 0 | 0.14 | 0.045 | 1 |
| 10 | HSA00740_RIBOFLAVIN_METABOLISM | Genes involved in riboflavin metabolism | ACP1, ACP2, ACP5, ACP6, ACPP, ACPT, ENPP1, ENPP3, FLAD1, LHPP, MTMR1, MTMR2, MTMR6, PHPT1, RFK, TYR | 16 | ACP1(1), ACPP(4), ENPP1(4), ENPP3(2), FLAD1(3), MTMR1(4), MTMR2(3), MTMR6(1), TYR(4) | 11461538 | 26 | 20 | 26 | 2 | 6 | 4 | 5 | 7 | 4 | 0 | 0.018 | 0.05 | 1 |
In brief, we tabulate the number of mutations and the number of covered bases for each gene. The counts are broken down by mutation context category: four context categories that are discovered by MutSig, and one for indel and 'null' mutations, which include indels, nonsense mutations, splice-site mutations, and non-stop (read-through) mutations. For each gene, we calculate the probability of seeing the observed constellation of mutations, i.e. the product P1 x P2 x ... x Pm, or a more extreme one, given the background mutation rates calculated across the dataset. [1]
In addition to the links below, the full results of the analysis summarized in this report can also be downloaded programmatically using firehose_get, or interactively from either the Broad GDAC website or TCGA Data Coordination Center Portal.