This pipeline computes the correlation between APOBRC groups and selected clinical features.
Testing the association between APOBEC groups identified by 2 different apobec score and 15 clinical features across 480 patients, 6 significant findings detected with Q value < 0.25.
-
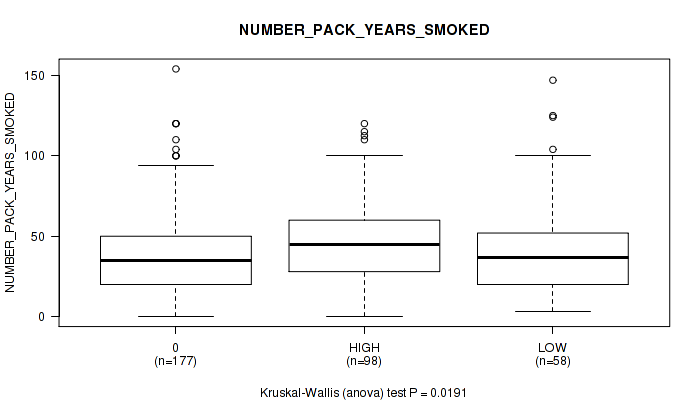
3 subtypes identified in current cancer cohort by 'APOBEC MUTLOAD MINESTIMATE'. These subtypes correlate to 'NUMBER_PACK_YEARS_SMOKED' and 'YEAR_OF_TOBACCO_SMOKING_ONSET'.
-
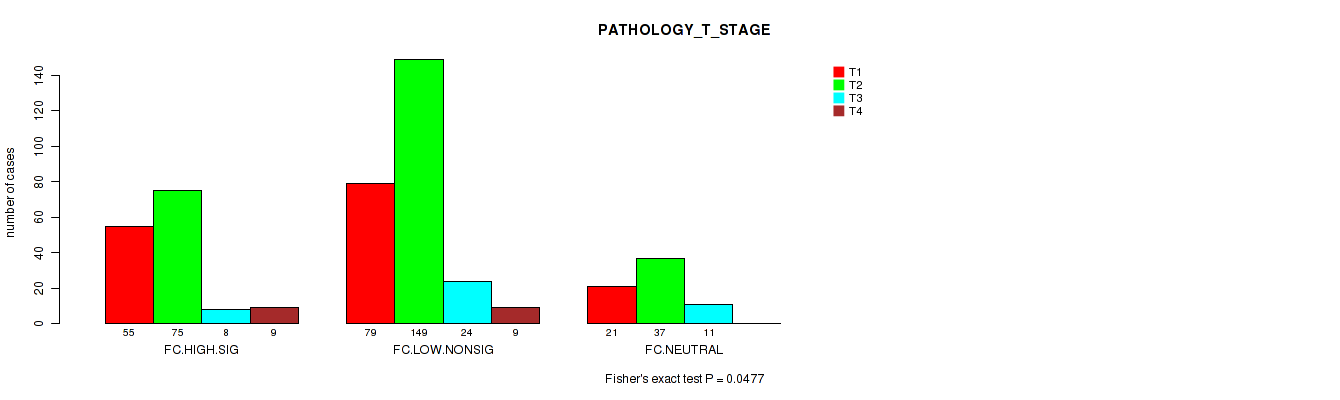
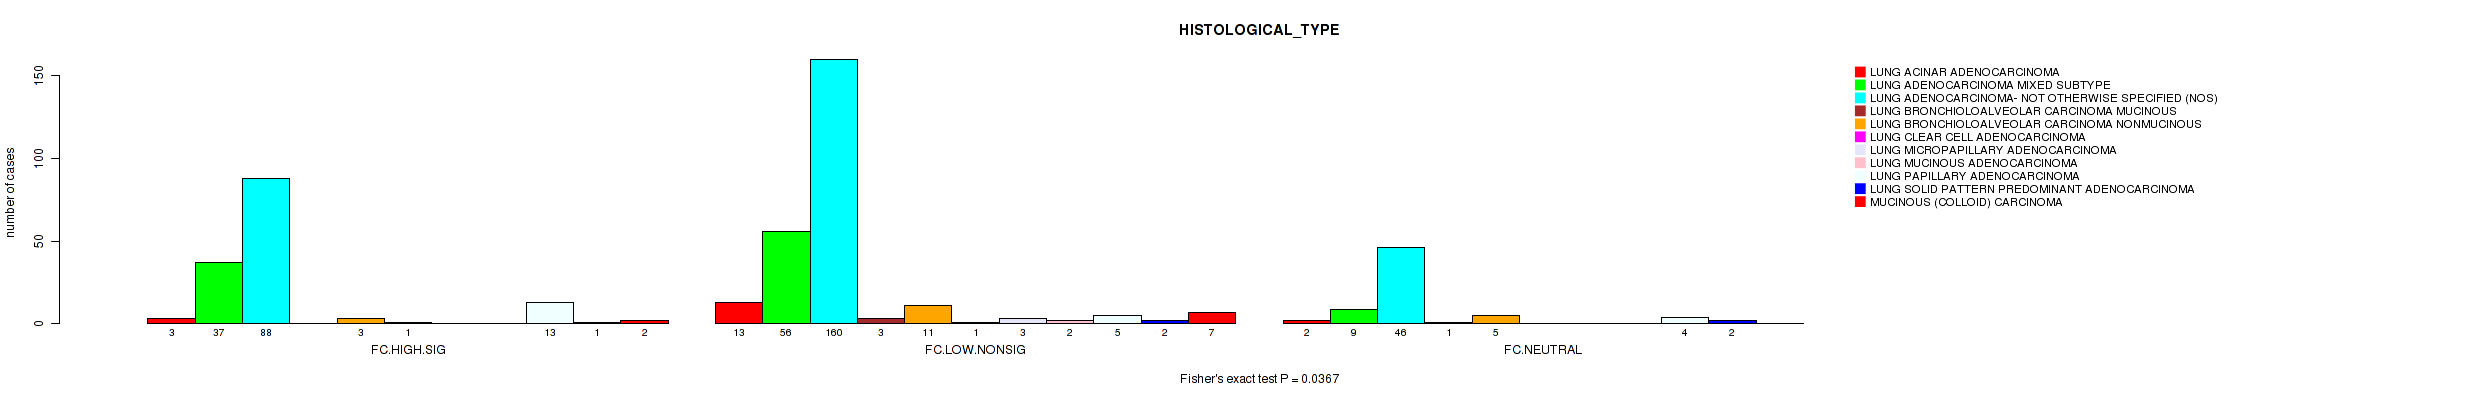
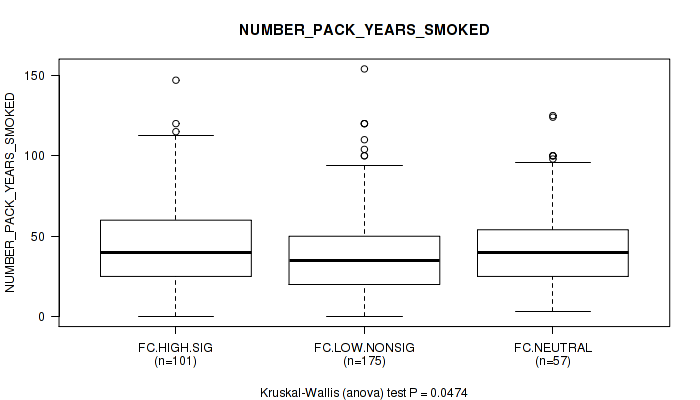
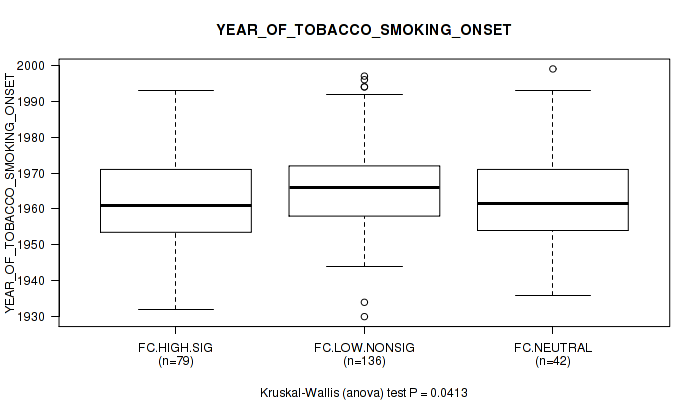
3 subtypes identified in current cancer cohort by 'APOBEC ENRICH'. These subtypes correlate to 'PATHOLOGY_T_STAGE', 'HISTOLOGICAL_TYPE', 'NUMBER_PACK_YEARS_SMOKED', and 'YEAR_OF_TOBACCO_SMOKING_ONSET'.
Table 1. Get Full Table Overview of the association between APOBEC groups by 2 different APOBEC scores and 15 clinical features. Shown in the table are P values (Q values). Thresholded by Q value < 0.25, 6 significant findings detected.
|
Clinical Features |
Statistical Tests |
APOBEC MUTLOAD MINESTIMATE |
APOBEC ENRICH |
| Time to Death | logrank test |
0.633 (0.863) |
0.843 (0.936) |
| YEARS TO BIRTH | Kruskal-Wallis (anova) |
0.165 (0.572) |
0.0745 (0.319) |
| NEOPLASM DISEASESTAGE | Fisher's exact test |
0.921 (0.987) |
0.596 (0.851) |
| PATHOLOGY T STAGE | Fisher's exact test |
0.277 (0.639) |
0.0477 (0.238) |
| PATHOLOGY N STAGE | Fisher's exact test |
0.804 (0.936) |
0.672 (0.876) |
| PATHOLOGY M STAGE | Fisher's exact test |
0.341 (0.658) |
0.219 (0.639) |
| GENDER | Fisher's exact test |
0.967 (1) |
0.836 (0.936) |
| KARNOFSKY PERFORMANCE SCORE | Kruskal-Wallis (anova) |
0.172 (0.572) |
0.267 (0.639) |
| HISTOLOGICAL TYPE | Fisher's exact test |
0.373 (0.658) |
0.0367 (0.238) |
| RADIATIONS RADIATION REGIMENINDICATION | Fisher's exact test |
1 (1.00) |
0.813 (0.936) |
| NUMBER PACK YEARS SMOKED | Kruskal-Wallis (anova) |
0.0191 (0.238) |
0.0474 (0.238) |
| YEAR OF TOBACCO SMOKING ONSET | Kruskal-Wallis (anova) |
0.0179 (0.238) |
0.0413 (0.238) |
| COMPLETENESS OF RESECTION | Fisher's exact test |
0.343 (0.658) |
0.418 (0.662) |
| RACE | Fisher's exact test |
0.419 (0.662) |
0.52 (0.78) |
| ETHNICITY | Fisher's exact test |
0.253 (0.639) |
0.364 (0.658) |
Table S1. Description of APOBEC group #1: 'APOBEC MUTLOAD MINESTIMATE'
| Cluster Labels | 0 | HIGH | LOW |
|---|---|---|---|
| Number of samples | 268 | 132 | 80 |
P value = 0.0191 (Kruskal-Wallis (anova)), Q value = 0.24
Table S2. Clustering Approach #1: 'APOBEC MUTLOAD MINESTIMATE' versus Clinical Feature #11: 'NUMBER_PACK_YEARS_SMOKED'
| nPatients | Mean (Std.Dev) | |
|---|---|---|
| ALL | 333 | 41.7 (27.5) |
| 0 | 177 | 38.3 (25.5) |
| HIGH | 98 | 46.7 (27.2) |
| LOW | 58 | 43.6 (32.7) |
Figure S1. Get High-res Image Clustering Approach #1: 'APOBEC MUTLOAD MINESTIMATE' versus Clinical Feature #11: 'NUMBER_PACK_YEARS_SMOKED'
P value = 0.0179 (Kruskal-Wallis (anova)), Q value = 0.24
Table S3. Clustering Approach #1: 'APOBEC MUTLOAD MINESTIMATE' versus Clinical Feature #12: 'YEAR_OF_TOBACCO_SMOKING_ONSET'
| nPatients | Mean (Std.Dev) | |
|---|---|---|
| ALL | 257 | 1964.4 (12.5) |
| 0 | 138 | 1966.0 (12.0) |
| HIGH | 79 | 1963.9 (13.2) |
| LOW | 40 | 1959.8 (11.4) |
Figure S2. Get High-res Image Clustering Approach #1: 'APOBEC MUTLOAD MINESTIMATE' versus Clinical Feature #12: 'YEAR_OF_TOBACCO_SMOKING_ONSET'
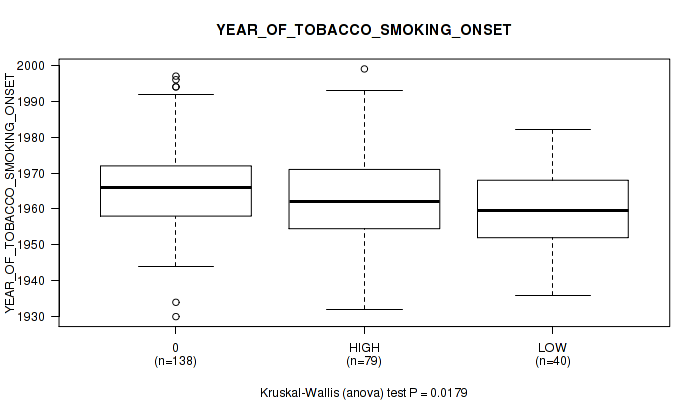
Table S4. Description of APOBEC group #2: 'APOBEC ENRICH'
| Cluster Labels | FC.HIGH.SIG | FC.LOW.NONSIG | FC.NEUTRAL |
|---|---|---|---|
| Number of samples | 148 | 263 | 69 |
P value = 0.0477 (Fisher's exact test), Q value = 0.24
Table S5. Clustering Approach #2: 'APOBEC ENRICH' versus Clinical Feature #4: 'PATHOLOGY_T_STAGE'
| nPatients | T1 | T2 | T3 | T4 |
|---|---|---|---|---|
| ALL | 155 | 261 | 43 | 18 |
| FC.HIGH.SIG | 55 | 75 | 8 | 9 |
| FC.LOW.NONSIG | 79 | 149 | 24 | 9 |
| FC.NEUTRAL | 21 | 37 | 11 | 0 |
Figure S3. Get High-res Image Clustering Approach #2: 'APOBEC ENRICH' versus Clinical Feature #4: 'PATHOLOGY_T_STAGE'
P value = 0.0367 (Fisher's exact test), Q value = 0.24
Table S6. Clustering Approach #2: 'APOBEC ENRICH' versus Clinical Feature #9: 'HISTOLOGICAL_TYPE'
| nPatients | LUNG ACINAR ADENOCARCINOMA | LUNG ADENOCARCINOMA MIXED SUBTYPE | LUNG ADENOCARCINOMA- NOT OTHERWISE SPECIFIED (NOS) | LUNG BRONCHIOLOALVEOLAR CARCINOMA MUCINOUS | LUNG BRONCHIOLOALVEOLAR CARCINOMA NONMUCINOUS | LUNG CLEAR CELL ADENOCARCINOMA | LUNG MICROPAPILLARY ADENOCARCINOMA | LUNG MUCINOUS ADENOCARCINOMA | LUNG PAPILLARY ADENOCARCINOMA | LUNG SOLID PATTERN PREDOMINANT ADENOCARCINOMA | MUCINOUS (COLLOID) CARCINOMA |
|---|---|---|---|---|---|---|---|---|---|---|---|
| ALL | 18 | 102 | 294 | 4 | 19 | 2 | 3 | 2 | 22 | 5 | 9 |
| FC.HIGH.SIG | 3 | 37 | 88 | 0 | 3 | 1 | 0 | 0 | 13 | 1 | 2 |
| FC.LOW.NONSIG | 13 | 56 | 160 | 3 | 11 | 1 | 3 | 2 | 5 | 2 | 7 |
| FC.NEUTRAL | 2 | 9 | 46 | 1 | 5 | 0 | 0 | 0 | 4 | 2 | 0 |
Figure S4. Get High-res Image Clustering Approach #2: 'APOBEC ENRICH' versus Clinical Feature #9: 'HISTOLOGICAL_TYPE'
P value = 0.0474 (Kruskal-Wallis (anova)), Q value = 0.24
Table S7. Clustering Approach #2: 'APOBEC ENRICH' versus Clinical Feature #11: 'NUMBER_PACK_YEARS_SMOKED'
| nPatients | Mean (Std.Dev) | |
|---|---|---|
| ALL | 333 | 41.7 (27.5) |
| FC.HIGH.SIG | 101 | 45.6 (29.6) |
| FC.LOW.NONSIG | 175 | 38.0 (25.2) |
| FC.NEUTRAL | 57 | 46.1 (29.4) |
Figure S5. Get High-res Image Clustering Approach #2: 'APOBEC ENRICH' versus Clinical Feature #11: 'NUMBER_PACK_YEARS_SMOKED'
P value = 0.0413 (Kruskal-Wallis (anova)), Q value = 0.24
Table S8. Clustering Approach #2: 'APOBEC ENRICH' versus Clinical Feature #12: 'YEAR_OF_TOBACCO_SMOKING_ONSET'
| nPatients | Mean (Std.Dev) | |
|---|---|---|
| ALL | 257 | 1964.4 (12.5) |
| FC.HIGH.SIG | 79 | 1962.5 (12.7) |
| FC.LOW.NONSIG | 136 | 1966.0 (12.1) |
| FC.NEUTRAL | 42 | 1962.6 (12.8) |
Figure S6. Get High-res Image Clustering Approach #2: 'APOBEC ENRICH' versus Clinical Feature #12: 'YEAR_OF_TOBACCO_SMOKING_ONSET'
-
APOBEC groups file = /xchip/cga/gdac-prod/tcga-gdac/jobResults/APOBEC_Pipelines/LUAD-TP/15246504/APOBEC_clinical_corr_input_15246553/APOBEC_for_clinical.correlaion.input.categorical.txt
-
Clinical data file = /xchip/cga/gdac-prod/tcga-gdac/jobResults/Append_Data/LUAD-TP/15084450/LUAD-TP.merged_data.txt
-
Number of patients = 480
-
Number of selected clinical features = 15
APOBEC classification based on APOBEC_MutLoad_MinEstimate : a. APOBEC non group -- samples with zero value, b. APOBEC hig group -- samples above median value in non zero samples, c. APOBEC hig group -- samples below median value in non zero samples.
APOBEC classification based on APOBEC_enrich : a. No Enrichmment group -- all samples with BH_Fisher_p-value_tCw >=0.05, b. Small enrichment group -- samples with BH_Fisher_p-value_tCw = < 0.05 and APOBEC_enrich=<2, c. High enrichment gruop -- samples with BH_Fisher_p-value_tCw =< 0.05 and APOBEC_enrich>2.
For survival clinical features, the Kaplan-Meier survival curves of tumors with and without gene mutations were plotted and the statistical significance P values were estimated by logrank test (Bland and Altman 2004) using the 'survdiff' function in R
For binary clinical features, two-tailed Fisher's exact tests (Fisher 1922) were used to estimate the P values using the 'fisher.test' function in R
For multiple hypothesis correction, Q value is the False Discovery Rate (FDR) analogue of the P value (Benjamini and Hochberg 1995), defined as the minimum FDR at which the test may be called significant. We used the 'Benjamini and Hochberg' method of 'p.adjust' function in R to convert P values into Q values.
In addition to the links below, the full results of the analysis summarized in this report can also be downloaded programmatically using firehose_get, or interactively from either the Broad GDAC website or TCGA Data Coordination Center Portal.