This pipeline computes the correlation between APOBRC groups and selected clinical features.
Testing the association between APOBEC groups identified by 2 different apobec score and 15 clinical features across 177 patients, 4 significant findings detected with Q value < 0.25.
-
3 subtypes identified in current cancer cohort by 'APOBEC MUTLOAD MINESTIMATE'. These subtypes correlate to 'KARNOFSKY_PERFORMANCE_SCORE' and 'RADIATIONS_RADIATION_REGIMENINDICATION'.
-
3 subtypes identified in current cancer cohort by 'APOBEC ENRICH'. These subtypes correlate to 'KARNOFSKY_PERFORMANCE_SCORE' and 'RADIATIONS_RADIATION_REGIMENINDICATION'.
Table 1. Get Full Table Overview of the association between APOBEC groups by 2 different APOBEC scores and 15 clinical features. Shown in the table are P values (Q values). Thresholded by Q value < 0.25, 4 significant findings detected.
|
Clinical Features |
Statistical Tests |
APOBEC MUTLOAD MINESTIMATE |
APOBEC ENRICH |
| Time to Death | logrank test |
0.487 (0.731) |
0.329 (0.607) |
| YEARS TO BIRTH | Kruskal-Wallis (anova) |
0.465 (0.731) |
0.344 (0.607) |
| NEOPLASM DISEASESTAGE | Fisher's exact test |
0.0914 (0.507) |
0.118 (0.507) |
| PATHOLOGY T STAGE | Fisher's exact test |
0.207 (0.607) |
0.202 (0.607) |
| PATHOLOGY N STAGE | Fisher's exact test |
0.565 (0.764) |
0.593 (0.764) |
| PATHOLOGY M STAGE | Fisher's exact test |
1 (1.00) |
1 (1.00) |
| GENDER | Fisher's exact test |
0.611 (0.764) |
0.522 (0.746) |
| KARNOFSKY PERFORMANCE SCORE | Kruskal-Wallis (anova) |
0.0153 (0.204) |
0.0147 (0.204) |
| HISTOLOGICAL TYPE | Fisher's exact test |
1 (1.00) |
0.245 (0.607) |
| RADIATIONS RADIATION REGIMENINDICATION | Fisher's exact test |
0.0272 (0.204) |
0.0246 (0.204) |
| NUMBER PACK YEARS SMOKED | Kruskal-Wallis (anova) |
0.846 (0.976) |
0.43 (0.717) |
| YEAR OF TOBACCO SMOKING ONSET | Kruskal-Wallis (anova) |
0.297 (0.607) |
0.111 (0.507) |
| COMPLETENESS OF RESECTION | Fisher's exact test |
0.147 (0.55) |
0.308 (0.607) |
| RACE | Fisher's exact test |
0.936 (1.00) |
0.838 (0.976) |
| ETHNICITY | Fisher's exact test |
0.228 (0.607) |
0.286 (0.607) |
Table S1. Description of APOBEC group #1: 'APOBEC MUTLOAD MINESTIMATE'
| Cluster Labels | 0 | HIGH | LOW |
|---|---|---|---|
| Number of samples | 67 | 43 | 67 |
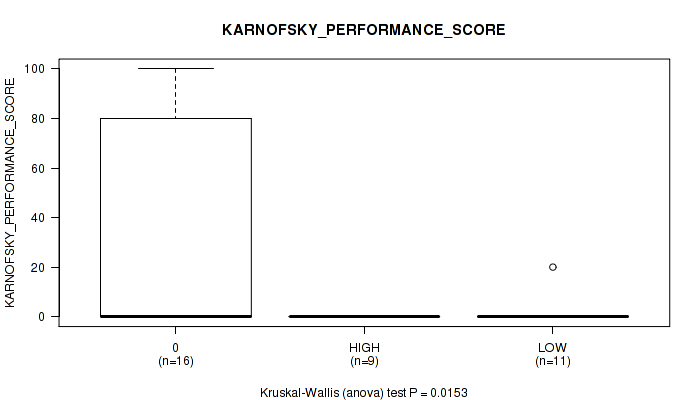
P value = 0.0153 (Kruskal-Wallis (anova)), Q value = 0.2
Table S2. Clustering Approach #1: 'APOBEC MUTLOAD MINESTIMATE' versus Clinical Feature #8: 'KARNOFSKY_PERFORMANCE_SCORE'
| nPatients | Mean (Std.Dev) | |
|---|---|---|
| ALL | 36 | 15.3 (31.8) |
| 0 | 16 | 33.1 (41.4) |
| HIGH | 9 | 0.0 (0.0) |
| LOW | 11 | 1.8 (6.0) |
Figure S1. Get High-res Image Clustering Approach #1: 'APOBEC MUTLOAD MINESTIMATE' versus Clinical Feature #8: 'KARNOFSKY_PERFORMANCE_SCORE'
P value = 0.0272 (Fisher's exact test), Q value = 0.2
Table S3. Clustering Approach #1: 'APOBEC MUTLOAD MINESTIMATE' versus Clinical Feature #10: 'RADIATIONS_RADIATION_REGIMENINDICATION'
| nPatients | NO | YES |
|---|---|---|
| ALL | 5 | 172 |
| 0 | 0 | 67 |
| HIGH | 0 | 43 |
| LOW | 5 | 62 |
Figure S2. Get High-res Image Clustering Approach #1: 'APOBEC MUTLOAD MINESTIMATE' versus Clinical Feature #10: 'RADIATIONS_RADIATION_REGIMENINDICATION'

Table S4. Description of APOBEC group #2: 'APOBEC ENRICH'
| Cluster Labels | FC.HIGH.SIG | FC.LOW.NONSIG | FC.NEUTRAL |
|---|---|---|---|
| Number of samples | 58 | 66 | 53 |
P value = 0.0147 (Kruskal-Wallis (anova)), Q value = 0.2
Table S5. Clustering Approach #2: 'APOBEC ENRICH' versus Clinical Feature #8: 'KARNOFSKY_PERFORMANCE_SCORE'
| nPatients | Mean (Std.Dev) | |
|---|---|---|
| ALL | 36 | 15.3 (31.8) |
| FC.HIGH.SIG | 11 | 0.0 (0.0) |
| FC.LOW.NONSIG | 16 | 33.1 (41.4) |
| FC.NEUTRAL | 9 | 2.2 (6.7) |
Figure S3. Get High-res Image Clustering Approach #2: 'APOBEC ENRICH' versus Clinical Feature #8: 'KARNOFSKY_PERFORMANCE_SCORE'

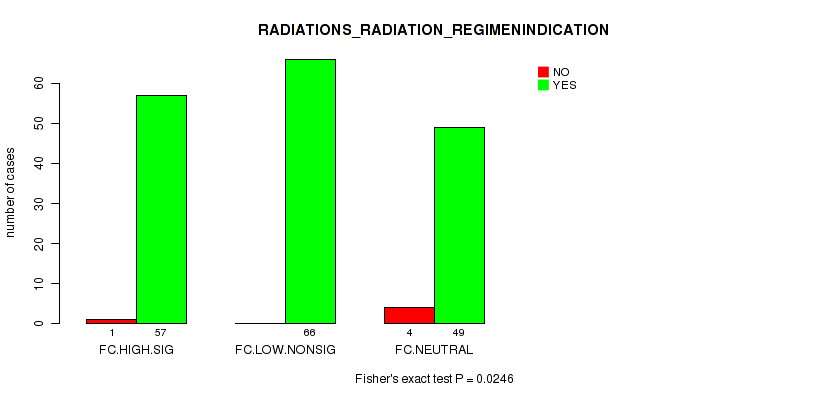
P value = 0.0246 (Fisher's exact test), Q value = 0.2
Table S6. Clustering Approach #2: 'APOBEC ENRICH' versus Clinical Feature #10: 'RADIATIONS_RADIATION_REGIMENINDICATION'
| nPatients | NO | YES |
|---|---|---|
| ALL | 5 | 172 |
| FC.HIGH.SIG | 1 | 57 |
| FC.LOW.NONSIG | 0 | 66 |
| FC.NEUTRAL | 4 | 49 |
Figure S4. Get High-res Image Clustering Approach #2: 'APOBEC ENRICH' versus Clinical Feature #10: 'RADIATIONS_RADIATION_REGIMENINDICATION'
-
APOBEC groups file = /xchip/cga/gdac-prod/tcga-gdac/jobResults/APOBEC_Pipelines/LUSC-TP/15165081/APOBEC_clinical_corr_input_15169729/APOBEC_for_clinical.correlaion.input.categorical.txt
-
Clinical data file = /xchip/cga/gdac-prod/tcga-gdac/jobResults/Append_Data/LUSC-TP/15084586/LUSC-TP.merged_data.txt
-
Number of patients = 177
-
Number of selected clinical features = 15
APOBEC classification based on APOBEC_MutLoad_MinEstimate : a. APOBEC non group -- samples with zero value, b. APOBEC hig group -- samples above median value in non zero samples, c. APOBEC hig group -- samples below median value in non zero samples.
APOBEC classification based on APOBEC_enrich : a. No Enrichmment group -- all samples with BH_Fisher_p-value_tCw >=0.05, b. Small enrichment group -- samples with BH_Fisher_p-value_tCw = < 0.05 and APOBEC_enrich=<2, c. High enrichment gruop -- samples with BH_Fisher_p-value_tCw =< 0.05 and APOBEC_enrich>2.
For survival clinical features, the Kaplan-Meier survival curves of tumors with and without gene mutations were plotted and the statistical significance P values were estimated by logrank test (Bland and Altman 2004) using the 'survdiff' function in R
For binary clinical features, two-tailed Fisher's exact tests (Fisher 1922) were used to estimate the P values using the 'fisher.test' function in R
For multiple hypothesis correction, Q value is the False Discovery Rate (FDR) analogue of the P value (Benjamini and Hochberg 1995), defined as the minimum FDR at which the test may be called significant. We used the 'Benjamini and Hochberg' method of 'p.adjust' function in R to convert P values into Q values.
In addition to the links below, the full results of the analysis summarized in this report can also be downloaded programmatically using firehose_get, or interactively from either the Broad GDAC website or TCGA Data Coordination Center Portal.