This pipeline computes the correlation between significant copy number variation (cnv focal) genes and selected clinical features.
Testing the association between copy number variation 21 focal events and 8 clinical features across 77 patients, 3 significant findings detected with Q value < 0.25.
-
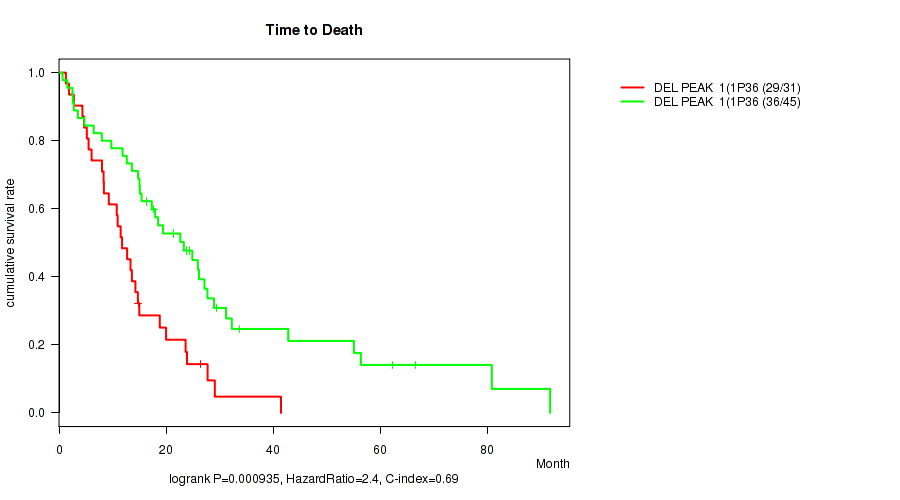
del_1p36.31 cnv correlated to 'Time to Death'.
-
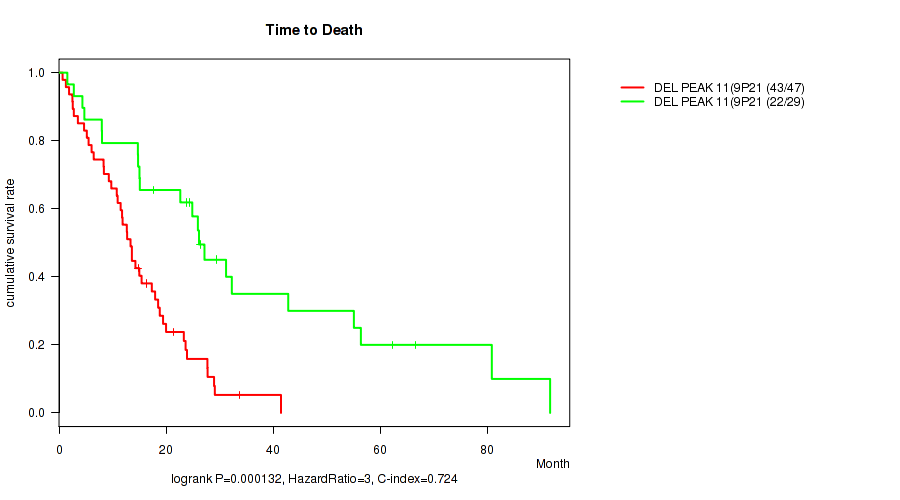
del_9p21.3 cnv correlated to 'Time to Death'.
-
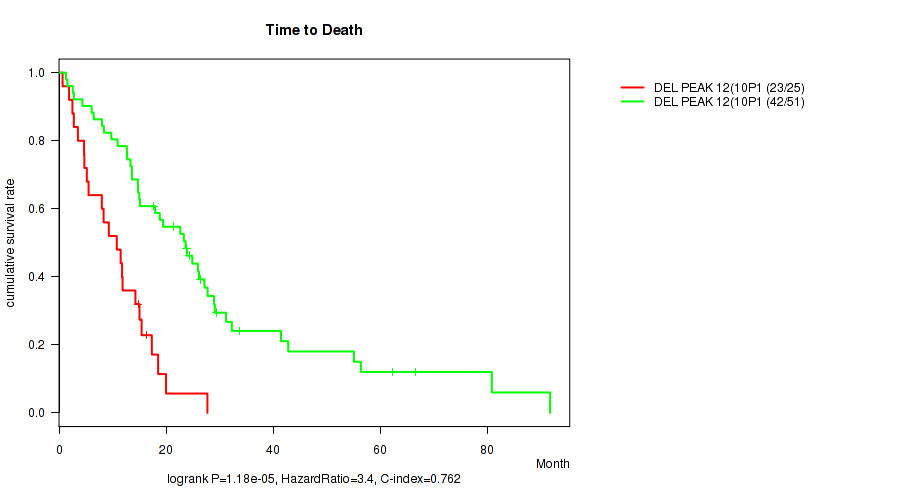
del_10p15.3 cnv correlated to 'Time to Death'.
Table 1. Get Full Table Overview of the association between significant copy number variation of 21 focal events and 8 clinical features. Shown in the table are P values (Q values). Thresholded by Q value < 0.25, 3 significant findings detected.
|
Clinical Features |
Time to Death |
YEARS TO BIRTH |
NEOPLASM DISEASESTAGE |
PATHOLOGY T STAGE |
PATHOLOGY N STAGE |
PATHOLOGY M STAGE |
GENDER |
KARNOFSKY PERFORMANCE SCORE |
||
| nCNV (%) | nWild-Type | logrank test | Wilcoxon-test | Fisher's exact test | Fisher's exact test | Fisher's exact test | Fisher's exact test | Fisher's exact test | Wilcoxon-test | |
| del 1p36 31 | 32 (42%) | 45 |
0.000935 (0.0524) |
0.992 (1.00) |
0.98 (1.00) |
0.578 (1.00) |
0.798 (1.00) |
0.5 (1.00) |
0.772 (1.00) |
|
| del 9p21 3 | 48 (62%) | 29 |
0.000132 (0.0111) |
0.32 (0.933) |
0.994 (1.00) |
0.44 (1.00) |
0.75 (1.00) |
0.134 (0.681) |
1 (1.00) |
0.653 (1.00) |
| del 10p15 3 | 26 (34%) | 51 |
1.18e-05 (0.00198) |
0.918 (1.00) |
0.0402 (0.473) |
0.0517 (0.491) |
0.333 (0.933) |
1 (1.00) |
1 (1.00) |
0.261 (0.877) |
| del 1p21 3 | 34 (44%) | 43 |
0.227 (0.877) |
0.178 (0.81) |
0.635 (1.00) |
0.418 (1.00) |
0.57 (1.00) |
1 (1.00) |
0.564 (1.00) |
|
| del 2q35 | 15 (19%) | 62 |
0.0339 (0.473) |
0.119 (0.667) |
0.737 (1.00) |
0.453 (1.00) |
0.232 (0.877) |
1 (1.00) |
0.00716 (0.288) |
|
| del 3p21 1 | 41 (53%) | 36 |
0.416 (1.00) |
0.951 (1.00) |
0.24 (0.877) |
0.947 (1.00) |
0.574 (1.00) |
1 (1.00) |
0.58 (1.00) |
|
| del 4q26 | 35 (45%) | 42 |
0.0154 (0.369) |
0.984 (1.00) |
0.583 (1.00) |
0.0687 (0.563) |
0.71 (1.00) |
0.495 (1.00) |
0.254 (0.877) |
|
| del 4q34 3 | 38 (49%) | 39 |
0.0291 (0.473) |
0.33 (0.933) |
0.845 (1.00) |
0.252 (0.877) |
0.801 (1.00) |
0.235 (0.877) |
0.401 (1.00) |
|
| del 5q23 2 | 15 (19%) | 62 |
0.0327 (0.473) |
0.0393 (0.473) |
0.968 (1.00) |
0.59 (1.00) |
0.77 (1.00) |
0.325 (0.933) |
0.277 (0.91) |
|
| del 6q22 1 | 37 (48%) | 40 |
0.447 (1.00) |
0.98 (1.00) |
0.111 (0.667) |
0.542 (1.00) |
0.359 (0.99) |
1 (1.00) |
0.256 (0.877) |
|
| del 6q26 | 32 (42%) | 45 |
0.136 (0.681) |
0.587 (1.00) |
0.211 (0.877) |
0.851 (1.00) |
0.0854 (0.624) |
0.523 (1.00) |
1 (1.00) |
|
| del 8p23 2 | 16 (21%) | 61 |
0.107 (0.667) |
0.209 (0.877) |
0.102 (0.656) |
0.038 (0.473) |
0.785 (1.00) |
1 (1.00) |
0.723 (1.00) |
|
| del 10q25 2 | 28 (36%) | 49 |
0.045 (0.473) |
0.844 (1.00) |
0.506 (1.00) |
0.221 (0.877) |
0.607 (1.00) |
1 (1.00) |
0.771 (1.00) |
|
| del 11q23 2 | 16 (21%) | 61 |
0.0988 (0.656) |
0.606 (1.00) |
0.317 (0.933) |
0.695 (1.00) |
0.914 (1.00) |
1 (1.00) |
0.723 (1.00) |
|
| del 12p13 31 | 9 (12%) | 68 |
0.0969 (0.656) |
0.918 (1.00) |
0.311 (0.933) |
0.876 (1.00) |
0.673 (1.00) |
1 (1.00) |
0.68 (1.00) |
|
| del 13q14 11 | 41 (53%) | 36 |
0.117 (0.667) |
0.759 (1.00) |
0.247 (0.877) |
0.96 (1.00) |
0.0725 (0.563) |
0.492 (1.00) |
0.148 (0.699) |
|
| del 14q32 31 | 36 (47%) | 41 |
0.043 (0.473) |
0.834 (1.00) |
0.72 (1.00) |
0.138 (0.681) |
0.754 (1.00) |
0.49 (1.00) |
0.0411 (0.473) |
|
| del 15q15 1 | 25 (32%) | 52 |
0.00858 (0.288) |
0.87 (1.00) |
0.624 (1.00) |
0.783 (1.00) |
0.875 (1.00) |
1 (1.00) |
1 (1.00) |
|
| del 16p13 3 | 5 (6%) | 72 |
0.557 (1.00) |
0.0555 (0.491) |
0.15 (0.699) |
0.0737 (0.563) |
0.323 (0.933) |
1 (1.00) |
0.249 (0.877) |
|
| del 16q24 1 | 20 (26%) | 57 |
0.0109 (0.304) |
0.406 (1.00) |
0.653 (1.00) |
0.98 (1.00) |
0.331 (0.933) |
1 (1.00) |
0.054 (0.491) |
|
| del 22q12 2 | 60 (78%) | 17 |
0.136 (0.681) |
0.745 (1.00) |
0.539 (1.00) |
0.282 (0.91) |
0.858 (1.00) |
0.419 (1.00) |
0.73 (1.00) |
P value = 0.000935 (logrank test), Q value = 0.052
Table S1. Gene #1: 'del_1p36.31' versus Clinical Feature #1: 'Time to Death'
| nPatients | nDeath | Duration Range (Median), Month | |
|---|---|---|---|
| ALL | 76 | 65 | 0.7 - 91.7 (15.1) |
| DEL PEAK 1(1P36.31) MUTATED | 31 | 29 | 1.3 - 41.5 (11.8) |
| DEL PEAK 1(1P36.31) WILD-TYPE | 45 | 36 | 0.7 - 91.7 (19.4) |
Figure S1. Get High-res Image Gene #1: 'del_1p36.31' versus Clinical Feature #1: 'Time to Death'
P value = 0.000132 (logrank test), Q value = 0.011
Table S2. Gene #11: 'del_9p21.3' versus Clinical Feature #1: 'Time to Death'
| nPatients | nDeath | Duration Range (Median), Month | |
|---|---|---|---|
| ALL | 76 | 65 | 0.7 - 91.7 (15.1) |
| DEL PEAK 11(9P21.3) MUTATED | 47 | 43 | 0.7 - 41.5 (13.3) |
| DEL PEAK 11(9P21.3) WILD-TYPE | 29 | 22 | 1.6 - 91.7 (24.9) |
Figure S2. Get High-res Image Gene #11: 'del_9p21.3' versus Clinical Feature #1: 'Time to Death'
P value = 1.18e-05 (logrank test), Q value = 0.002
Table S3. Gene #12: 'del_10p15.3' versus Clinical Feature #1: 'Time to Death'
| nPatients | nDeath | Duration Range (Median), Month | |
|---|---|---|---|
| ALL | 76 | 65 | 0.7 - 91.7 (15.1) |
| DEL PEAK 12(10P15.3) MUTATED | 25 | 23 | 0.7 - 27.7 (10.8) |
| DEL PEAK 12(10P15.3) WILD-TYPE | 51 | 42 | 1.3 - 91.7 (22.6) |
Figure S3. Get High-res Image Gene #12: 'del_10p15.3' versus Clinical Feature #1: 'Time to Death'
-
Copy number data file = all_lesions.txt from GISTIC pipeline
-
Processed Copy number data file = /xchip/cga/gdac-prod/tcga-gdac/jobResults/GDAC_Correlate_Genomic_Events_Preprocess/MESO-TP/15089884/transformed.cor.cli.txt
-
Clinical data file = /xchip/cga/gdac-prod/tcga-gdac/jobResults/Append_Data/MESO-TP/15084766/MESO-TP.merged_data.txt
-
Number of patients = 77
-
Number of significantly focal cnvs = 21
-
Number of selected clinical features = 8
-
Exclude genes that fewer than K tumors have mutations, K = 3
For survival clinical features, the Kaplan-Meier survival curves of tumors with and without gene mutations were plotted and the statistical significance P values were estimated by logrank test (Bland and Altman 2004) using the 'survdiff' function in R
For binary or multi-class clinical features (nominal or ordinal), two-tailed Fisher's exact tests (Fisher 1922) were used to estimate the P values using the 'fisher.test' function in R
For multiple hypothesis correction, Q value is the False Discovery Rate (FDR) analogue of the P value (Benjamini and Hochberg 1995), defined as the minimum FDR at which the test may be called significant. We used the 'Benjamini and Hochberg' method of 'p.adjust' function in R to convert P values into Q values.
In addition to the links below, the full results of the analysis summarized in this report can also be downloaded programmatically using firehose_get, or interactively from either the Broad GDAC website or TCGA Data Coordination Center Portal.