This pipeline computes the correlation between significant arm-level copy number variations (cnvs) and selected clinical features.
Testing the association between copy number variation 82 arm-level events and 8 clinical features across 573 patients, 29 significant findings detected with Q value < 0.25.
-
1q gain cnv correlated to 'YEARS_TO_BIRTH'.
-
2p gain cnv correlated to 'YEARS_TO_BIRTH'.
-
2q gain cnv correlated to 'YEARS_TO_BIRTH'.
-
3p gain cnv correlated to 'YEARS_TO_BIRTH'.
-
3q gain cnv correlated to 'YEARS_TO_BIRTH'.
-
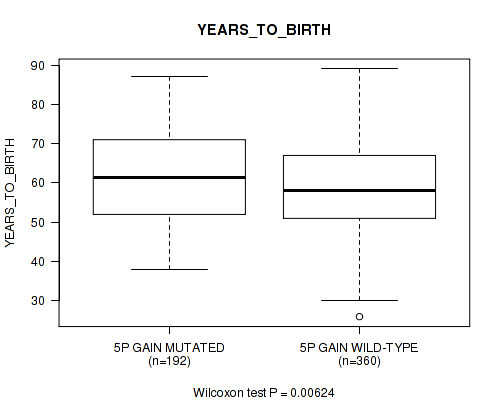
5p gain cnv correlated to 'YEARS_TO_BIRTH'.
-
6p gain cnv correlated to 'YEARS_TO_BIRTH'.
-
6q gain cnv correlated to 'YEARS_TO_BIRTH'.
-
7p gain cnv correlated to 'YEARS_TO_BIRTH'.
-
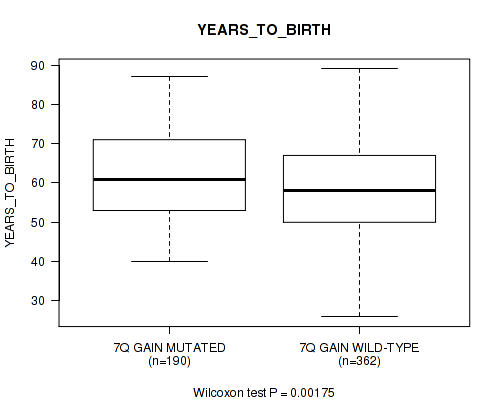
7q gain cnv correlated to 'YEARS_TO_BIRTH'.
-
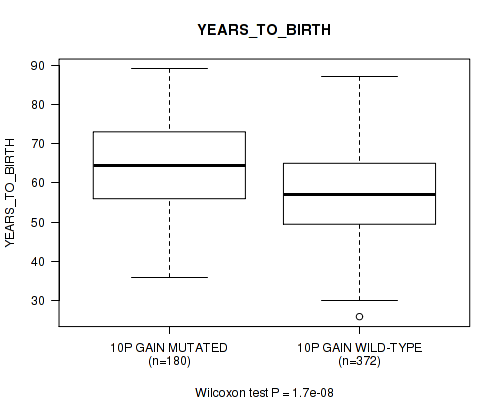
10p gain cnv correlated to 'YEARS_TO_BIRTH'.
-
10q gain cnv correlated to 'YEARS_TO_BIRTH'.
-
12p gain cnv correlated to 'YEARS_TO_BIRTH'.
-
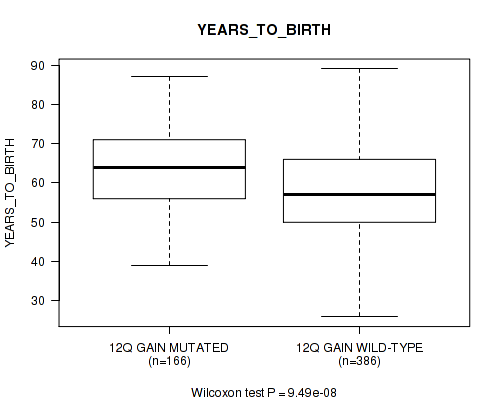
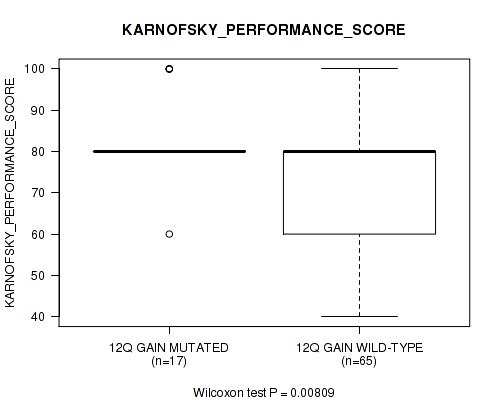
12q gain cnv correlated to 'YEARS_TO_BIRTH' and 'KARNOFSKY_PERFORMANCE_SCORE'.
-
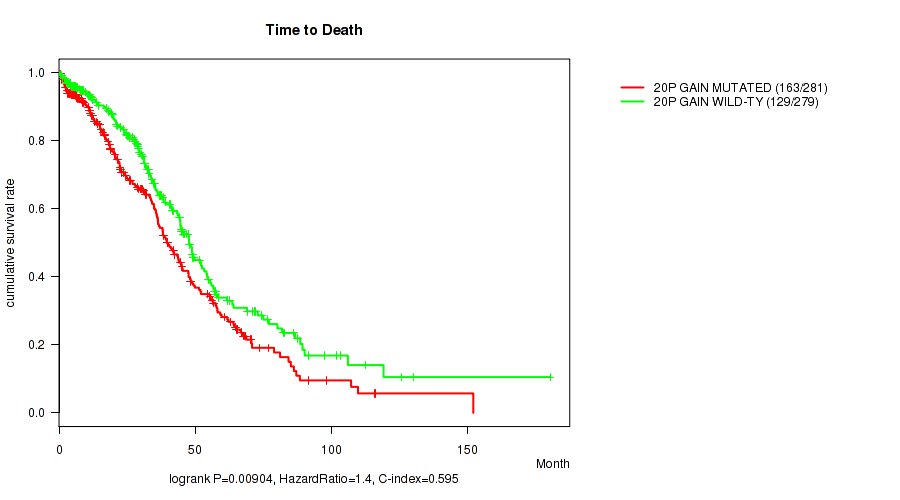
20p gain cnv correlated to 'Time to Death' and 'YEARS_TO_BIRTH'.
-
20q gain cnv correlated to 'YEARS_TO_BIRTH'.
-
21q gain cnv correlated to 'YEARS_TO_BIRTH'.
-
3p loss cnv correlated to 'YEARS_TO_BIRTH'.
-
8q loss cnv correlated to 'YEARS_TO_BIRTH'.
-
9q loss cnv correlated to 'YEARS_TO_BIRTH'.
-
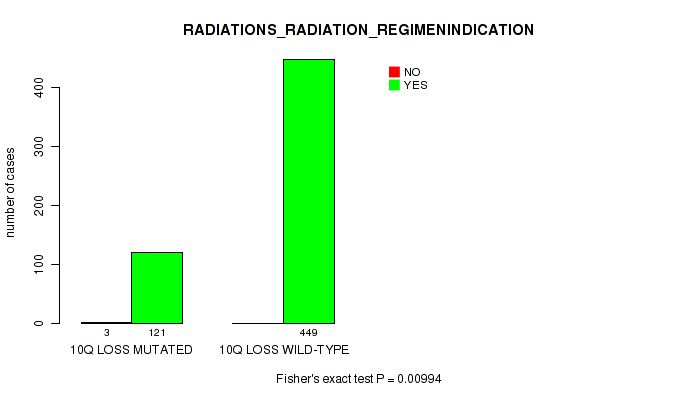
10q loss cnv correlated to 'RADIATIONS_RADIATION_REGIMENINDICATION'.
-
11p loss cnv correlated to 'YEARS_TO_BIRTH'.
-
14q loss cnv correlated to 'YEARS_TO_BIRTH'.
-
15q loss cnv correlated to 'YEARS_TO_BIRTH'.
-
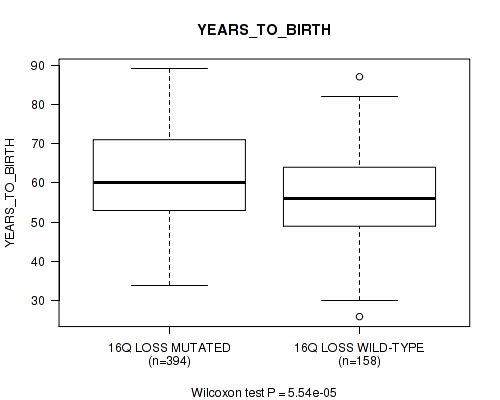
16q loss cnv correlated to 'YEARS_TO_BIRTH'.
-
xp loss cnv correlated to 'YEARS_TO_BIRTH'.
-
xq loss cnv correlated to 'YEARS_TO_BIRTH'.
Table 1. Get Full Table Overview of the association between significant copy number variation of 82 arm-level events and 8 clinical features. Shown in the table are P values (Q values). Thresholded by Q value < 0.25, 29 significant findings detected.
|
Clinical Features |
Time to Death |
YEARS TO BIRTH |
PRIMARY SITE OF DISEASE |
KARNOFSKY PERFORMANCE SCORE |
RADIATIONS RADIATION REGIMENINDICATION |
COMPLETENESS OF RESECTION |
RACE | ETHNICITY | ||
| nCNV (%) | nWild-Type | logrank test | Wilcoxon-test | Fisher's exact test | Wilcoxon-test | Fisher's exact test | Fisher's exact test | Fisher's exact test | Fisher's exact test | |
| 12q gain | 176 (31%) | 397 |
0.144 (0.824) |
9.49e-08 (2.08e-05) |
0.043 (0.542) |
0.00809 (0.212) |
1 (1.00) |
0.192 (0.877) |
0.103 (0.729) |
0.462 (1.00) |
| 20p gain | 287 (50%) | 286 |
0.00904 (0.225) |
1.08e-06 (0.000118) |
0.247 (0.938) |
0.253 (0.942) |
1 (1.00) |
0.499 (1.00) |
0.132 (0.793) |
0.752 (1.00) |
| 1q gain | 219 (38%) | 354 |
0.537 (1.00) |
0.000775 (0.0299) |
0.123 (0.786) |
0.0748 (0.654) |
1 (1.00) |
0.678 (1.00) |
0.663 (1.00) |
0.74 (1.00) |
| 2p gain | 184 (32%) | 389 |
0.0673 (0.654) |
3.44e-06 (0.000323) |
1 (1.00) |
0.858 (1.00) |
1 (1.00) |
0.708 (1.00) |
0.446 (1.00) |
1 (1.00) |
| 2q gain | 153 (27%) | 420 |
0.129 (0.793) |
0.000717 (0.0294) |
0.765 (1.00) |
0.494 (1.00) |
0.175 (0.861) |
1 (1.00) |
0.352 (1.00) |
0.706 (1.00) |
| 3p gain | 160 (28%) | 413 |
0.632 (1.00) |
0.00419 (0.12) |
0.404 (1.00) |
0.423 (1.00) |
0.564 (1.00) |
0.329 (1.00) |
0.233 (0.925) |
1 (1.00) |
| 3q gain | 272 (47%) | 301 |
0.43 (1.00) |
2.46e-07 (4.04e-05) |
0.421 (1.00) |
0.819 (1.00) |
0.251 (0.939) |
0.649 (1.00) |
0.801 (1.00) |
0.521 (1.00) |
| 5p gain | 197 (34%) | 376 |
0.372 (1.00) |
0.00624 (0.171) |
0.0993 (0.709) |
0.483 (1.00) |
1 (1.00) |
0.0669 (0.654) |
0.502 (1.00) |
1 (1.00) |
| 6p gain | 168 (29%) | 405 |
0.36 (1.00) |
6.07e-06 (0.000498) |
0.781 (1.00) |
0.0602 (0.648) |
0.559 (1.00) |
1 (1.00) |
0.384 (1.00) |
0.729 (1.00) |
| 6q gain | 97 (17%) | 476 |
0.474 (1.00) |
0.000197 (0.0108) |
1 (1.00) |
0.232 (0.925) |
1 (1.00) |
0.789 (1.00) |
0.171 (0.858) |
0.674 (1.00) |
| 7p gain | 179 (31%) | 394 |
0.977 (1.00) |
0.000706 (0.0294) |
0.308 (1.00) |
0.162 (0.852) |
0.556 (1.00) |
0.869 (1.00) |
0.088 (0.687) |
0.176 (0.861) |
| 7q gain | 199 (35%) | 374 |
0.41 (1.00) |
0.00175 (0.0604) |
1 (1.00) |
0.192 (0.877) |
0.555 (1.00) |
1 (1.00) |
0.109 (0.75) |
1 (1.00) |
| 10p gain | 186 (32%) | 387 |
0.34 (1.00) |
1.7e-08 (5.59e-06) |
0.0568 (0.634) |
0.449 (1.00) |
0.247 (0.938) |
0.855 (1.00) |
0.68 (1.00) |
0.507 (1.00) |
| 10q gain | 109 (19%) | 464 |
0.557 (1.00) |
0.000641 (0.0294) |
0.0694 (0.654) |
0.915 (1.00) |
1 (1.00) |
0.74 (1.00) |
0.934 (1.00) |
1 (1.00) |
| 12p gain | 254 (44%) | 319 |
0.316 (1.00) |
5.96e-10 (3.91e-07) |
0.235 (0.925) |
0.0793 (0.667) |
1 (1.00) |
0.932 (1.00) |
0.35 (1.00) |
0.327 (1.00) |
| 20q gain | 326 (57%) | 247 |
0.0336 (0.479) |
3.64e-05 (0.00266) |
0.402 (1.00) |
0.235 (0.925) |
1 (1.00) |
0.598 (1.00) |
0.0294 (0.459) |
0.353 (1.00) |
| 21q gain | 109 (19%) | 464 |
0.964 (1.00) |
0.00109 (0.0396) |
0.0412 (0.53) |
0.423 (1.00) |
1 (1.00) |
0.437 (1.00) |
0.657 (1.00) |
0.684 (1.00) |
| 3p loss | 94 (16%) | 479 |
0.955 (1.00) |
0.00983 (0.225) |
0.598 (1.00) |
0.525 (1.00) |
0.416 (1.00) |
0.245 (0.938) |
0.342 (1.00) |
1 (1.00) |
| 8q loss | 89 (16%) | 484 |
0.111 (0.75) |
0.00345 (0.103) |
1 (1.00) |
0.344 (1.00) |
1 (1.00) |
0.519 (1.00) |
0.71 (1.00) |
0.643 (1.00) |
| 9q loss | 286 (50%) | 287 |
0.415 (1.00) |
7.42e-07 (9.73e-05) |
0.434 (1.00) |
0.979 (1.00) |
0.624 (1.00) |
0.741 (1.00) |
0.493 (1.00) |
1 (1.00) |
| 10q loss | 124 (22%) | 449 |
0.786 (1.00) |
0.0859 (0.687) |
0.453 (1.00) |
0.956 (1.00) |
0.00994 (0.225) |
1 (1.00) |
0.488 (1.00) |
0.694 (1.00) |
| 11p loss | 196 (34%) | 377 |
0.869 (1.00) |
0.00316 (0.0986) |
1 (1.00) |
0.517 (1.00) |
1 (1.00) |
0.782 (1.00) |
0.474 (1.00) |
0.731 (1.00) |
| 14q loss | 214 (37%) | 359 |
0.414 (1.00) |
0.000613 (0.0294) |
1 (1.00) |
0.578 (1.00) |
0.297 (1.00) |
0.457 (1.00) |
0.668 (1.00) |
0.188 (0.877) |
| 15q loss | 276 (48%) | 297 |
0.64 (1.00) |
0.000192 (0.0108) |
0.421 (1.00) |
0.481 (1.00) |
0.611 (1.00) |
0.678 (1.00) |
0.397 (1.00) |
0.525 (1.00) |
| 16q loss | 409 (71%) | 164 |
0.0854 (0.687) |
5.54e-05 (0.00363) |
1 (1.00) |
0.113 (0.75) |
0.561 (1.00) |
0.573 (1.00) |
0.889 (1.00) |
0.159 (0.846) |
| xp loss | 322 (56%) | 251 |
0.872 (1.00) |
0.00978 (0.225) |
0.317 (1.00) |
0.933 (1.00) |
0.26 (0.948) |
0.52 (1.00) |
0.669 (1.00) |
0.759 (1.00) |
| xq loss | 277 (48%) | 296 |
0.664 (1.00) |
0.00223 (0.0731) |
0.625 (1.00) |
0.26 (0.948) |
0.112 (0.75) |
0.653 (1.00) |
0.153 (0.828) |
0.753 (1.00) |
| 1p gain | 168 (29%) | 405 |
0.19 (0.877) |
0.0768 (0.663) |
0.778 (1.00) |
0.147 (0.824) |
0.207 (0.89) |
0.432 (1.00) |
0.853 (1.00) |
0.461 (1.00) |
| 4p gain | 60 (10%) | 513 |
0.0282 (0.459) |
0.0287 (0.459) |
0.0876 (0.687) |
0.475 (1.00) |
0.283 (0.987) |
0.705 (1.00) |
0.78 (1.00) |
0.255 (0.946) |
| 4q gain | 32 (6%) | 541 |
0.0698 (0.654) |
0.0482 (0.596) |
1 (1.00) |
0.168 (0.856) |
0.159 (0.846) |
0.53 (1.00) |
0.462 (1.00) |
|
| 5q gain | 60 (10%) | 513 |
0.931 (1.00) |
0.191 (0.877) |
0.22 (0.89) |
0.148 (0.824) |
1 (1.00) |
0.0991 (0.709) |
0.916 (1.00) |
1 (1.00) |
| 8p gain | 118 (21%) | 455 |
0.992 (1.00) |
0.801 (1.00) |
0.439 (1.00) |
0.551 (1.00) |
0.5 (1.00) |
0.656 (1.00) |
0.471 (1.00) |
1 (1.00) |
| 8q gain | 240 (42%) | 333 |
0.528 (1.00) |
0.116 (0.761) |
0.304 (1.00) |
0.923 (1.00) |
1 (1.00) |
0.282 (0.987) |
0.132 (0.793) |
0.528 (1.00) |
| 9p gain | 89 (16%) | 484 |
0.458 (1.00) |
0.851 (1.00) |
1 (1.00) |
0.682 (1.00) |
0.398 (1.00) |
0.791 (1.00) |
0.694 (1.00) |
0.369 (1.00) |
| 9q gain | 43 (8%) | 530 |
0.7 (1.00) |
0.208 (0.89) |
1 (1.00) |
0.542 (1.00) |
0.209 (0.89) |
1 (1.00) |
0.206 (0.89) |
1 (1.00) |
| 11p gain | 76 (13%) | 497 |
0.099 (0.709) |
0.7 (1.00) |
1 (1.00) |
0.527 (1.00) |
0.348 (1.00) |
0.447 (1.00) |
0.318 (1.00) |
1 (1.00) |
| 11q gain | 112 (20%) | 461 |
0.841 (1.00) |
0.762 (1.00) |
1 (1.00) |
0.727 (1.00) |
1 (1.00) |
0.242 (0.938) |
0.954 (1.00) |
0.218 (0.89) |
| 13q gain | 60 (10%) | 513 |
0.745 (1.00) |
0.0159 (0.307) |
1 (1.00) |
0.0566 (0.634) |
0.283 (0.987) |
0.55 (1.00) |
0.845 (1.00) |
0.611 (1.00) |
| 14q gain | 58 (10%) | 515 |
0.032 (0.476) |
0.22 (0.89) |
1 (1.00) |
0.766 (1.00) |
0.0283 (0.459) |
0.855 (1.00) |
0.875 (1.00) |
0.608 (1.00) |
| 15q gain | 39 (7%) | 534 |
0.258 (0.948) |
0.908 (1.00) |
1 (1.00) |
0.134 (0.793) |
1 (1.00) |
1 (1.00) |
1 (1.00) |
|
| 16p gain | 59 (10%) | 514 |
0.873 (1.00) |
0.191 (0.877) |
1 (1.00) |
0.0528 (0.634) |
1 (1.00) |
0.121 (0.786) |
0.878 (1.00) |
1 (1.00) |
| 16q gain | 31 (5%) | 542 |
0.814 (1.00) |
0.948 (1.00) |
1 (1.00) |
0.162 (0.852) |
1 (1.00) |
0.219 (0.89) |
0.726 (1.00) |
1 (1.00) |
| 17p gain | 22 (4%) | 551 |
0.171 (0.858) |
0.443 (1.00) |
1 (1.00) |
0.923 (1.00) |
1 (1.00) |
0.422 (1.00) |
1 (1.00) |
|
| 17q gain | 47 (8%) | 526 |
0.552 (1.00) |
0.447 (1.00) |
1 (1.00) |
0.451 (1.00) |
1 (1.00) |
0.0923 (0.709) |
0.392 (1.00) |
1 (1.00) |
| 18p gain | 120 (21%) | 453 |
0.152 (0.828) |
0.0356 (0.487) |
1 (1.00) |
0.672 (1.00) |
1 (1.00) |
0.365 (1.00) |
0.971 (1.00) |
1 (1.00) |
| 18q gain | 72 (13%) | 501 |
0.279 (0.987) |
0.506 (1.00) |
1 (1.00) |
0.973 (1.00) |
1 (1.00) |
0.857 (1.00) |
0.638 (1.00) |
0.615 (1.00) |
| 19p gain | 169 (29%) | 404 |
0.42 (1.00) |
0.0708 (0.654) |
0.78 (1.00) |
0.449 (1.00) |
0.209 (0.89) |
0.359 (1.00) |
0.397 (1.00) |
0.73 (1.00) |
| 19q gain | 160 (28%) | 413 |
0.699 (1.00) |
0.0143 (0.302) |
0.0975 (0.709) |
0.752 (1.00) |
0.19 (0.877) |
0.458 (1.00) |
0.0551 (0.634) |
1 (1.00) |
| 22q gain | 24 (4%) | 549 |
0.125 (0.789) |
0.691 (1.00) |
0.195 (0.882) |
0.476 (1.00) |
1 (1.00) |
1 (1.00) |
0.577 (1.00) |
1 (1.00) |
| xp gain | 78 (14%) | 495 |
0.588 (1.00) |
0.138 (0.8) |
0.0326 (0.476) |
0.772 (1.00) |
1 (1.00) |
0.132 (0.793) |
0.725 (1.00) |
1 (1.00) |
| xq gain | 108 (19%) | 465 |
0.64 (1.00) |
0.178 (0.861) |
0.0238 (0.421) |
0.692 (1.00) |
1 (1.00) |
1 (1.00) |
0.617 (1.00) |
1 (1.00) |
| 1p loss | 64 (11%) | 509 |
0.799 (1.00) |
0.289 (0.991) |
1 (1.00) |
0.148 (0.824) |
0.3 (1.00) |
0.857 (1.00) |
0.594 (1.00) |
0.314 (1.00) |
| 1q loss | 43 (8%) | 530 |
0.552 (1.00) |
0.408 (1.00) |
1 (1.00) |
0.181 (0.867) |
0.209 (0.89) |
0.587 (1.00) |
0.375 (1.00) |
0.542 (1.00) |
| 2p loss | 53 (9%) | 520 |
0.745 (1.00) |
0.503 (1.00) |
1 (1.00) |
0.166 (0.856) |
1 (1.00) |
0.905 (1.00) |
0.608 (1.00) |
|
| 2q loss | 59 (10%) | 514 |
0.897 (1.00) |
0.0187 (0.351) |
0.219 (0.89) |
0.522 (1.00) |
1 (1.00) |
0.652 (1.00) |
0.797 (1.00) |
0.609 (1.00) |
| 3q loss | 43 (8%) | 530 |
0.36 (1.00) |
0.126 (0.79) |
0.329 (1.00) |
0.831 (1.00) |
0.209 (0.89) |
0.766 (1.00) |
0.542 (1.00) |
|
| 4p loss | 313 (55%) | 260 |
0.663 (1.00) |
0.794 (1.00) |
0.409 (1.00) |
0.242 (0.938) |
1 (1.00) |
0.869 (1.00) |
0.554 (1.00) |
1 (1.00) |
| 4q loss | 359 (63%) | 214 |
0.641 (1.00) |
0.824 (1.00) |
1 (1.00) |
0.781 (1.00) |
1 (1.00) |
0.833 (1.00) |
0.428 (1.00) |
0.326 (1.00) |
| 5p loss | 131 (23%) | 442 |
0.683 (1.00) |
0.0244 (0.421) |
0.732 (1.00) |
0.0388 (0.509) |
1 (1.00) |
0.123 (0.786) |
0.841 (1.00) |
0.705 (1.00) |
| 5q loss | 221 (39%) | 352 |
0.538 (1.00) |
0.0152 (0.302) |
1 (1.00) |
0.0537 (0.634) |
1 (1.00) |
0.151 (0.828) |
0.929 (1.00) |
0.527 (1.00) |
| 6p loss | 163 (28%) | 410 |
0.287 (0.99) |
0.0693 (0.654) |
1 (1.00) |
0.974 (1.00) |
1 (1.00) |
0.287 (0.99) |
0.426 (1.00) |
0.73 (1.00) |
| 6q loss | 238 (42%) | 335 |
0.599 (1.00) |
0.058 (0.634) |
0.502 (1.00) |
0.631 (1.00) |
1 (1.00) |
0.427 (1.00) |
0.0789 (0.667) |
0.524 (1.00) |
| 7p loss | 120 (21%) | 453 |
0.828 (1.00) |
0.908 (1.00) |
0.447 (1.00) |
0.0995 (0.709) |
1 (1.00) |
0.539 (1.00) |
0.783 (1.00) |
0.694 (1.00) |
| 7q loss | 81 (14%) | 492 |
0.339 (1.00) |
0.211 (0.89) |
0.309 (1.00) |
0.134 (0.793) |
0.368 (1.00) |
0.549 (1.00) |
0.361 (1.00) |
0.371 (1.00) |
| 8p loss | 273 (48%) | 300 |
0.137 (0.8) |
0.0309 (0.471) |
0.521 (1.00) |
0.204 (0.89) |
1 (1.00) |
0.303 (1.00) |
0.834 (1.00) |
0.522 (1.00) |
| 9p loss | 262 (46%) | 311 |
0.727 (1.00) |
0.013 (0.284) |
0.409 (1.00) |
0.76 (1.00) |
0.595 (1.00) |
0.212 (0.89) |
0.75 (1.00) |
0.526 (1.00) |
| 10p loss | 96 (17%) | 477 |
0.581 (1.00) |
0.146 (0.824) |
1 (1.00) |
0.745 (1.00) |
0.424 (1.00) |
0.63 (1.00) |
0.366 (1.00) |
1 (1.00) |
| 11q loss | 148 (26%) | 425 |
0.506 (1.00) |
0.0148 (0.302) |
0.545 (1.00) |
0.0738 (0.654) |
1 (1.00) |
0.868 (1.00) |
0.453 (1.00) |
0.708 (1.00) |
| 12p loss | 78 (14%) | 495 |
0.927 (1.00) |
0.0725 (0.654) |
1 (1.00) |
0.632 (1.00) |
1 (1.00) |
1 (1.00) |
0.279 (0.987) |
1 (1.00) |
| 12q loss | 103 (18%) | 470 |
0.426 (1.00) |
0.331 (1.00) |
1 (1.00) |
0.449 (1.00) |
1 (1.00) |
0.621 (1.00) |
0.856 (1.00) |
1 (1.00) |
| 13q loss | 306 (53%) | 267 |
0.527 (1.00) |
0.576 (1.00) |
0.513 (1.00) |
0.987 (1.00) |
0.601 (1.00) |
0.604 (1.00) |
0.707 (1.00) |
0.522 (1.00) |
| 16p loss | 331 (58%) | 242 |
0.453 (1.00) |
0.166 (0.856) |
1 (1.00) |
0.991 (1.00) |
0.267 (0.962) |
1 (1.00) |
0.434 (1.00) |
0.0981 (0.709) |
| 17p loss | 474 (83%) | 99 |
0.832 (1.00) |
0.32 (1.00) |
0.206 (0.89) |
0.613 (1.00) |
0.435 (1.00) |
0.295 (1.00) |
0.98 (1.00) |
0.385 (1.00) |
| 17q loss | 380 (66%) | 193 |
0.822 (1.00) |
0.579 (1.00) |
1 (1.00) |
0.0221 (0.402) |
0.554 (1.00) |
0.372 (1.00) |
0.776 (1.00) |
0.0961 (0.709) |
| 18p loss | 231 (40%) | 342 |
0.058 (0.634) |
0.946 (1.00) |
0.498 (1.00) |
0.541 (1.00) |
0.065 (0.654) |
0.346 (1.00) |
0.0364 (0.487) |
1 (1.00) |
| 18q loss | 289 (50%) | 284 |
0.0668 (0.654) |
0.326 (1.00) |
0.433 (1.00) |
0.53 (1.00) |
0.249 (0.938) |
0.263 (0.952) |
0.0743 (0.654) |
0.214 (0.89) |
| 19p loss | 184 (32%) | 389 |
0.347 (1.00) |
0.0362 (0.487) |
0.324 (1.00) |
0.361 (1.00) |
0.555 (1.00) |
0.276 (0.987) |
0.522 (1.00) |
0.735 (1.00) |
| 19q loss | 176 (31%) | 397 |
0.914 (1.00) |
0.518 (1.00) |
0.295 (1.00) |
0.0686 (0.654) |
0.556 (1.00) |
0.11 (0.75) |
0.512 (1.00) |
0.513 (1.00) |
| 20p loss | 49 (9%) | 524 |
0.0846 (0.687) |
0.396 (1.00) |
1 (1.00) |
0.421 (1.00) |
0.236 (0.925) |
0.109 (0.75) |
0.77 (1.00) |
0.244 (0.938) |
| 20q loss | 32 (6%) | 541 |
0.168 (0.856) |
0.879 (1.00) |
1 (1.00) |
0.476 (1.00) |
1 (1.00) |
1 (1.00) |
0.479 (1.00) |
|
| 21q loss | 195 (34%) | 378 |
0.825 (1.00) |
0.307 (1.00) |
0.797 (1.00) |
0.173 (0.861) |
1 (1.00) |
1 (1.00) |
0.507 (1.00) |
0.752 (1.00) |
| 22q loss | 428 (75%) | 145 |
0.179 (0.861) |
0.0876 (0.687) |
0.533 (1.00) |
0.431 (1.00) |
0.575 (1.00) |
0.0645 (0.654) |
1 (1.00) |
1 (1.00) |
P value = 0.000775 (Wilcoxon-test), Q value = 0.03
Table S1. Gene #2: '1q gain' versus Clinical Feature #2: 'YEARS_TO_BIRTH'
| nPatients | Mean (Std.Dev) | |
|---|---|---|
| ALL | 552 | 59.8 (11.6) |
| 1Q GAIN MUTATED | 209 | 61.9 (10.7) |
| 1Q GAIN WILD-TYPE | 343 | 58.6 (11.9) |
Figure S1. Get High-res Image Gene #2: '1q gain' versus Clinical Feature #2: 'YEARS_TO_BIRTH'

P value = 3.44e-06 (Wilcoxon-test), Q value = 0.00032
Table S2. Gene #3: '2p gain' versus Clinical Feature #2: 'YEARS_TO_BIRTH'
| nPatients | Mean (Std.Dev) | |
|---|---|---|
| ALL | 552 | 59.8 (11.6) |
| 2P GAIN MUTATED | 175 | 63.3 (11.2) |
| 2P GAIN WILD-TYPE | 377 | 58.2 (11.4) |
Figure S2. Get High-res Image Gene #3: '2p gain' versus Clinical Feature #2: 'YEARS_TO_BIRTH'

P value = 0.000717 (Wilcoxon-test), Q value = 0.029
Table S3. Gene #4: '2q gain' versus Clinical Feature #2: 'YEARS_TO_BIRTH'
| nPatients | Mean (Std.Dev) | |
|---|---|---|
| ALL | 552 | 59.8 (11.6) |
| 2Q GAIN MUTATED | 146 | 62.6 (11.1) |
| 2Q GAIN WILD-TYPE | 406 | 58.8 (11.6) |
Figure S3. Get High-res Image Gene #4: '2q gain' versus Clinical Feature #2: 'YEARS_TO_BIRTH'

P value = 0.00419 (Wilcoxon-test), Q value = 0.12
Table S4. Gene #5: '3p gain' versus Clinical Feature #2: 'YEARS_TO_BIRTH'
| nPatients | Mean (Std.Dev) | |
|---|---|---|
| ALL | 552 | 59.8 (11.6) |
| 3P GAIN MUTATED | 154 | 62.1 (11.3) |
| 3P GAIN WILD-TYPE | 398 | 59.0 (11.5) |
Figure S4. Get High-res Image Gene #5: '3p gain' versus Clinical Feature #2: 'YEARS_TO_BIRTH'

P value = 2.46e-07 (Wilcoxon-test), Q value = 4e-05
Table S5. Gene #6: '3q gain' versus Clinical Feature #2: 'YEARS_TO_BIRTH'
| nPatients | Mean (Std.Dev) | |
|---|---|---|
| ALL | 552 | 59.8 (11.6) |
| 3Q GAIN MUTATED | 265 | 62.5 (11.1) |
| 3Q GAIN WILD-TYPE | 287 | 57.4 (11.5) |
Figure S5. Get High-res Image Gene #6: '3q gain' versus Clinical Feature #2: 'YEARS_TO_BIRTH'

P value = 0.00624 (Wilcoxon-test), Q value = 0.17
Table S6. Gene #9: '5p gain' versus Clinical Feature #2: 'YEARS_TO_BIRTH'
| nPatients | Mean (Std.Dev) | |
|---|---|---|
| ALL | 552 | 59.8 (11.6) |
| 5P GAIN MUTATED | 192 | 61.7 (11.7) |
| 5P GAIN WILD-TYPE | 360 | 58.8 (11.4) |
Figure S6. Get High-res Image Gene #9: '5p gain' versus Clinical Feature #2: 'YEARS_TO_BIRTH'
P value = 6.07e-06 (Wilcoxon-test), Q value = 5e-04
Table S7. Gene #11: '6p gain' versus Clinical Feature #2: 'YEARS_TO_BIRTH'
| nPatients | Mean (Std.Dev) | |
|---|---|---|
| ALL | 552 | 59.8 (11.6) |
| 6P GAIN MUTATED | 164 | 63.2 (10.9) |
| 6P GAIN WILD-TYPE | 388 | 58.4 (11.6) |
Figure S7. Get High-res Image Gene #11: '6p gain' versus Clinical Feature #2: 'YEARS_TO_BIRTH'

P value = 0.000197 (Wilcoxon-test), Q value = 0.011
Table S8. Gene #12: '6q gain' versus Clinical Feature #2: 'YEARS_TO_BIRTH'
| nPatients | Mean (Std.Dev) | |
|---|---|---|
| ALL | 552 | 59.8 (11.6) |
| 6Q GAIN MUTATED | 93 | 63.8 (10.6) |
| 6Q GAIN WILD-TYPE | 459 | 59.0 (11.6) |
Figure S8. Get High-res Image Gene #12: '6q gain' versus Clinical Feature #2: 'YEARS_TO_BIRTH'

P value = 0.000706 (Wilcoxon-test), Q value = 0.029
Table S9. Gene #13: '7p gain' versus Clinical Feature #2: 'YEARS_TO_BIRTH'
| nPatients | Mean (Std.Dev) | |
|---|---|---|
| ALL | 552 | 59.8 (11.6) |
| 7P GAIN MUTATED | 171 | 62.3 (10.8) |
| 7P GAIN WILD-TYPE | 381 | 58.7 (11.7) |
Figure S9. Get High-res Image Gene #13: '7p gain' versus Clinical Feature #2: 'YEARS_TO_BIRTH'

P value = 0.00175 (Wilcoxon-test), Q value = 0.06
Table S10. Gene #14: '7q gain' versus Clinical Feature #2: 'YEARS_TO_BIRTH'
| nPatients | Mean (Std.Dev) | |
|---|---|---|
| ALL | 552 | 59.8 (11.6) |
| 7Q GAIN MUTATED | 190 | 62.0 (11.2) |
| 7Q GAIN WILD-TYPE | 362 | 58.7 (11.6) |
Figure S10. Get High-res Image Gene #14: '7q gain' versus Clinical Feature #2: 'YEARS_TO_BIRTH'
P value = 1.7e-08 (Wilcoxon-test), Q value = 5.6e-06
Table S11. Gene #19: '10p gain' versus Clinical Feature #2: 'YEARS_TO_BIRTH'
| nPatients | Mean (Std.Dev) | |
|---|---|---|
| ALL | 552 | 59.8 (11.6) |
| 10P GAIN MUTATED | 180 | 63.7 (10.9) |
| 10P GAIN WILD-TYPE | 372 | 58.0 (11.4) |
Figure S11. Get High-res Image Gene #19: '10p gain' versus Clinical Feature #2: 'YEARS_TO_BIRTH'
P value = 0.000641 (Wilcoxon-test), Q value = 0.029
Table S12. Gene #20: '10q gain' versus Clinical Feature #2: 'YEARS_TO_BIRTH'
| nPatients | Mean (Std.Dev) | |
|---|---|---|
| ALL | 552 | 59.8 (11.6) |
| 10Q GAIN MUTATED | 105 | 63.2 (11.1) |
| 10Q GAIN WILD-TYPE | 447 | 59.0 (11.5) |
Figure S12. Get High-res Image Gene #20: '10q gain' versus Clinical Feature #2: 'YEARS_TO_BIRTH'

P value = 5.96e-10 (Wilcoxon-test), Q value = 3.9e-07
Table S13. Gene #23: '12p gain' versus Clinical Feature #2: 'YEARS_TO_BIRTH'
| nPatients | Mean (Std.Dev) | |
|---|---|---|
| ALL | 552 | 59.8 (11.6) |
| 12P GAIN MUTATED | 241 | 63.3 (11.1) |
| 12P GAIN WILD-TYPE | 311 | 57.1 (11.2) |
Figure S13. Get High-res Image Gene #23: '12p gain' versus Clinical Feature #2: 'YEARS_TO_BIRTH'

P value = 9.49e-08 (Wilcoxon-test), Q value = 2.1e-05
Table S14. Gene #24: '12q gain' versus Clinical Feature #2: 'YEARS_TO_BIRTH'
| nPatients | Mean (Std.Dev) | |
|---|---|---|
| ALL | 552 | 59.8 (11.6) |
| 12Q GAIN MUTATED | 166 | 63.7 (10.3) |
| 12Q GAIN WILD-TYPE | 386 | 58.2 (11.7) |
Figure S14. Get High-res Image Gene #24: '12q gain' versus Clinical Feature #2: 'YEARS_TO_BIRTH'
P value = 0.00809 (Wilcoxon-test), Q value = 0.21
Table S15. Gene #24: '12q gain' versus Clinical Feature #4: 'KARNOFSKY_PERFORMANCE_SCORE'
| nPatients | Mean (Std.Dev) | |
|---|---|---|
| ALL | 82 | 75.7 (13.9) |
| 12Q GAIN MUTATED | 17 | 83.5 (10.6) |
| 12Q GAIN WILD-TYPE | 65 | 73.7 (14.0) |
Figure S15. Get High-res Image Gene #24: '12q gain' versus Clinical Feature #4: 'KARNOFSKY_PERFORMANCE_SCORE'
P value = 0.00904 (logrank test), Q value = 0.22
Table S16. Gene #36: '20p gain' versus Clinical Feature #1: 'Time to Death'
| nPatients | nDeath | Duration Range (Median), Month | |
|---|---|---|---|
| ALL | 560 | 292 | 0.3 - 180.2 (28.7) |
| 20P GAIN MUTATED | 281 | 163 | 0.3 - 152.0 (25.0) |
| 20P GAIN WILD-TYPE | 279 | 129 | 0.3 - 180.2 (29.5) |
Figure S16. Get High-res Image Gene #36: '20p gain' versus Clinical Feature #1: 'Time to Death'
P value = 1.08e-06 (Wilcoxon-test), Q value = 0.00012
Table S17. Gene #36: '20p gain' versus Clinical Feature #2: 'YEARS_TO_BIRTH'
| nPatients | Mean (Std.Dev) | |
|---|---|---|
| ALL | 552 | 59.8 (11.6) |
| 20P GAIN MUTATED | 278 | 62.2 (11.5) |
| 20P GAIN WILD-TYPE | 274 | 57.4 (11.1) |
Figure S17. Get High-res Image Gene #36: '20p gain' versus Clinical Feature #2: 'YEARS_TO_BIRTH'

P value = 3.64e-05 (Wilcoxon-test), Q value = 0.0027
Table S18. Gene #37: '20q gain' versus Clinical Feature #2: 'YEARS_TO_BIRTH'
| nPatients | Mean (Std.Dev) | |
|---|---|---|
| ALL | 552 | 59.8 (11.6) |
| 20Q GAIN MUTATED | 315 | 61.6 (11.8) |
| 20Q GAIN WILD-TYPE | 237 | 57.4 (10.9) |
Figure S18. Get High-res Image Gene #37: '20q gain' versus Clinical Feature #2: 'YEARS_TO_BIRTH'

P value = 0.00109 (Wilcoxon-test), Q value = 0.04
Table S19. Gene #38: '21q gain' versus Clinical Feature #2: 'YEARS_TO_BIRTH'
| nPatients | Mean (Std.Dev) | |
|---|---|---|
| ALL | 552 | 59.8 (11.6) |
| 21Q GAIN MUTATED | 106 | 63.1 (10.5) |
| 21Q GAIN WILD-TYPE | 446 | 59.1 (11.7) |
Figure S19. Get High-res Image Gene #38: '21q gain' versus Clinical Feature #2: 'YEARS_TO_BIRTH'

P value = 0.00983 (Wilcoxon-test), Q value = 0.22
Table S20. Gene #46: '3p loss' versus Clinical Feature #2: 'YEARS_TO_BIRTH'
| nPatients | Mean (Std.Dev) | |
|---|---|---|
| ALL | 552 | 59.8 (11.6) |
| 3P LOSS MUTATED | 92 | 62.8 (11.6) |
| 3P LOSS WILD-TYPE | 460 | 59.2 (11.5) |
Figure S20. Get High-res Image Gene #46: '3p loss' versus Clinical Feature #2: 'YEARS_TO_BIRTH'

P value = 0.00345 (Wilcoxon-test), Q value = 0.1
Table S21. Gene #57: '8q loss' versus Clinical Feature #2: 'YEARS_TO_BIRTH'
| nPatients | Mean (Std.Dev) | |
|---|---|---|
| ALL | 552 | 59.8 (11.6) |
| 8Q LOSS MUTATED | 85 | 63.1 (11.5) |
| 8Q LOSS WILD-TYPE | 467 | 59.2 (11.5) |
Figure S21. Get High-res Image Gene #57: '8q loss' versus Clinical Feature #2: 'YEARS_TO_BIRTH'

P value = 7.42e-07 (Wilcoxon-test), Q value = 9.7e-05
Table S22. Gene #59: '9q loss' versus Clinical Feature #2: 'YEARS_TO_BIRTH'
| nPatients | Mean (Std.Dev) | |
|---|---|---|
| ALL | 552 | 59.8 (11.6) |
| 9Q LOSS MUTATED | 272 | 62.3 (11.3) |
| 9Q LOSS WILD-TYPE | 280 | 57.4 (11.3) |
Figure S22. Get High-res Image Gene #59: '9q loss' versus Clinical Feature #2: 'YEARS_TO_BIRTH'

P value = 0.00994 (Fisher's exact test), Q value = 0.22
Table S23. Gene #61: '10q loss' versus Clinical Feature #5: 'RADIATIONS_RADIATION_REGIMENINDICATION'
| nPatients | NO | YES |
|---|---|---|
| ALL | 3 | 570 |
| 10Q LOSS MUTATED | 3 | 121 |
| 10Q LOSS WILD-TYPE | 0 | 449 |
Figure S23. Get High-res Image Gene #61: '10q loss' versus Clinical Feature #5: 'RADIATIONS_RADIATION_REGIMENINDICATION'
P value = 0.00316 (Wilcoxon-test), Q value = 0.099
Table S24. Gene #62: '11p loss' versus Clinical Feature #2: 'YEARS_TO_BIRTH'
| nPatients | Mean (Std.Dev) | |
|---|---|---|
| ALL | 552 | 59.8 (11.6) |
| 11P LOSS MUTATED | 189 | 61.9 (11.5) |
| 11P LOSS WILD-TYPE | 363 | 58.8 (11.5) |
Figure S24. Get High-res Image Gene #62: '11p loss' versus Clinical Feature #2: 'YEARS_TO_BIRTH'

P value = 0.000613 (Wilcoxon-test), Q value = 0.029
Table S25. Gene #67: '14q loss' versus Clinical Feature #2: 'YEARS_TO_BIRTH'
| nPatients | Mean (Std.Dev) | |
|---|---|---|
| ALL | 552 | 59.8 (11.6) |
| 14Q LOSS MUTATED | 208 | 62.0 (11.5) |
| 14Q LOSS WILD-TYPE | 344 | 58.5 (11.5) |
Figure S25. Get High-res Image Gene #67: '14q loss' versus Clinical Feature #2: 'YEARS_TO_BIRTH'

P value = 0.000192 (Wilcoxon-test), Q value = 0.011
Table S26. Gene #68: '15q loss' versus Clinical Feature #2: 'YEARS_TO_BIRTH'
| nPatients | Mean (Std.Dev) | |
|---|---|---|
| ALL | 552 | 59.8 (11.6) |
| 15Q LOSS MUTATED | 268 | 61.7 (11.3) |
| 15Q LOSS WILD-TYPE | 284 | 58.1 (11.5) |
Figure S26. Get High-res Image Gene #68: '15q loss' versus Clinical Feature #2: 'YEARS_TO_BIRTH'

P value = 5.54e-05 (Wilcoxon-test), Q value = 0.0036
Table S27. Gene #70: '16q loss' versus Clinical Feature #2: 'YEARS_TO_BIRTH'
| nPatients | Mean (Std.Dev) | |
|---|---|---|
| ALL | 552 | 59.8 (11.6) |
| 16Q LOSS MUTATED | 394 | 61.1 (11.3) |
| 16Q LOSS WILD-TYPE | 158 | 56.6 (11.5) |
Figure S27. Get High-res Image Gene #70: '16q loss' versus Clinical Feature #2: 'YEARS_TO_BIRTH'
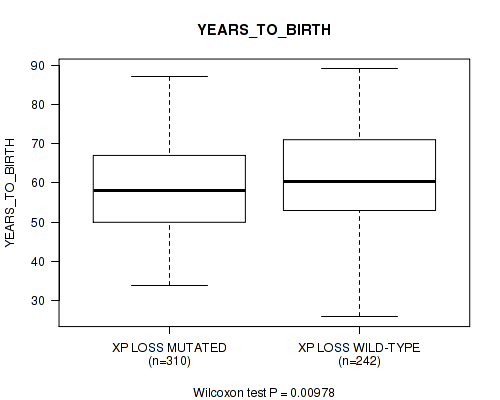
P value = 0.00978 (Wilcoxon-test), Q value = 0.22
Table S28. Gene #81: 'xp loss' versus Clinical Feature #2: 'YEARS_TO_BIRTH'
| nPatients | Mean (Std.Dev) | |
|---|---|---|
| ALL | 552 | 59.8 (11.6) |
| XP LOSS MUTATED | 310 | 58.8 (11.5) |
| XP LOSS WILD-TYPE | 242 | 61.2 (11.5) |
Figure S28. Get High-res Image Gene #81: 'xp loss' versus Clinical Feature #2: 'YEARS_TO_BIRTH'
P value = 0.00223 (Wilcoxon-test), Q value = 0.073
Table S29. Gene #82: 'xq loss' versus Clinical Feature #2: 'YEARS_TO_BIRTH'
| nPatients | Mean (Std.Dev) | |
|---|---|---|
| ALL | 552 | 59.8 (11.6) |
| XQ LOSS MUTATED | 266 | 58.3 (11.5) |
| XQ LOSS WILD-TYPE | 286 | 61.2 (11.5) |
Figure S29. Get High-res Image Gene #82: 'xq loss' versus Clinical Feature #2: 'YEARS_TO_BIRTH'

-
Copy number data file = broad_values_by_arm.txt from GISTIC pipeline
-
Processed Copy number data file = /xchip/cga/gdac-prod/tcga-gdac/jobResults/GDAC_Correlate_Genomic_Events_Preprocess/OV-TP/15096464/transformed.cor.cli.txt
-
Clinical data file = /xchip/cga/gdac-prod/tcga-gdac/jobResults/Append_Data/OV-TP/15085780/OV-TP.merged_data.txt
-
Number of patients = 573
-
Number of significantly arm-level cnvs = 82
-
Number of selected clinical features = 8
-
Exclude regions that fewer than K tumors have mutations, K = 3
For survival clinical features, the Kaplan-Meier survival curves of tumors with and without gene mutations were plotted and the statistical significance P values were estimated by logrank test (Bland and Altman 2004) using the 'survdiff' function in R
For binary or multi-class clinical features (nominal or ordinal), two-tailed Fisher's exact tests (Fisher 1922) were used to estimate the P values using the 'fisher.test' function in R
For multiple hypothesis correction, Q value is the False Discovery Rate (FDR) analogue of the P value (Benjamini and Hochberg 1995), defined as the minimum FDR at which the test may be called significant. We used the 'Benjamini and Hochberg' method of 'p.adjust' function in R to convert P values into Q values.
In addition to the links below, the full results of the analysis summarized in this report can also be downloaded programmatically using firehose_get, or interactively from either the Broad GDAC website or TCGA Data Coordination Center Portal.