This pipeline computes the correlation between significant copy number variation (cnv focal) genes and selected clinical features.
Testing the association between copy number variation 71 focal events and 8 clinical features across 573 patients, 21 significant findings detected with Q value < 0.25.
-
amp_1q21.3 cnv correlated to 'YEARS_TO_BIRTH'.
-
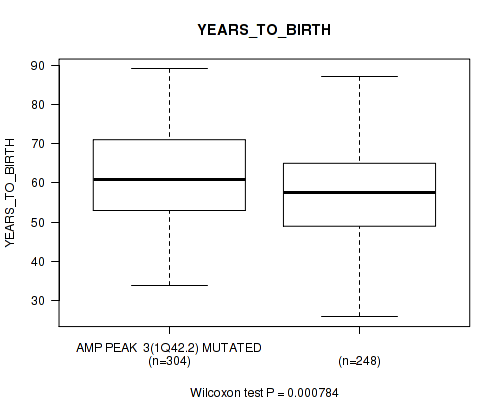
amp_1q42.2 cnv correlated to 'YEARS_TO_BIRTH'.
-
amp_3q26.2 cnv correlated to 'YEARS_TO_BIRTH'.
-
amp_6p22.3 cnv correlated to 'YEARS_TO_BIRTH'.
-
amp_8p11.21 cnv correlated to 'YEARS_TO_BIRTH'.
-
amp_10p15.3 cnv correlated to 'YEARS_TO_BIRTH'.
-
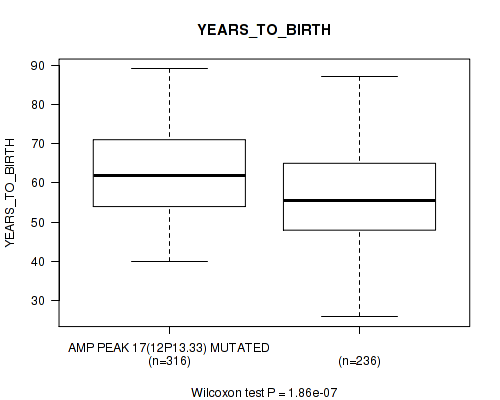
amp_12p13.33 cnv correlated to 'YEARS_TO_BIRTH'.
-
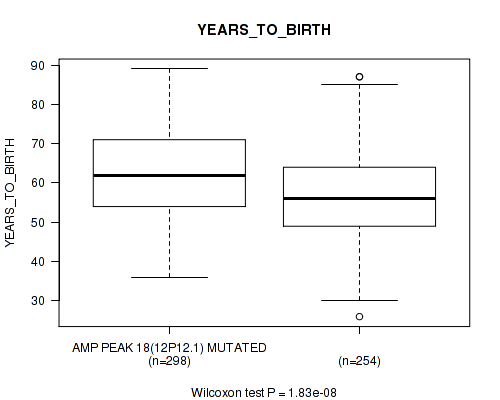
amp_12p12.1 cnv correlated to 'YEARS_TO_BIRTH'.
-
amp_12q15 cnv correlated to 'YEARS_TO_BIRTH' and 'PRIMARY_SITE_OF_DISEASE'.
-
amp_19q12 cnv correlated to 'YEARS_TO_BIRTH'.
-
amp_19q13.2 cnv correlated to 'YEARS_TO_BIRTH'.
-
amp_20p13 cnv correlated to 'YEARS_TO_BIRTH'.
-
amp_20q11.21 cnv correlated to 'YEARS_TO_BIRTH'.
-
amp_20q13.33 cnv correlated to 'YEARS_TO_BIRTH'.
-
del_3p26.2 cnv correlated to 'YEARS_TO_BIRTH'.
-
del_6q27 cnv correlated to 'YEARS_TO_BIRTH'.
-
del_7p22.1 cnv correlated to 'YEARS_TO_BIRTH'.
-
del_15q11.2 cnv correlated to 'YEARS_TO_BIRTH'.
-
del_15q15.1 cnv correlated to 'YEARS_TO_BIRTH'.
-
del_16q23.1 cnv correlated to 'YEARS_TO_BIRTH'.
Table 1. Get Full Table Overview of the association between significant copy number variation of 71 focal events and 8 clinical features. Shown in the table are P values (Q values). Thresholded by Q value < 0.25, 21 significant findings detected.
|
Clinical Features |
Time to Death |
YEARS TO BIRTH |
PRIMARY SITE OF DISEASE |
KARNOFSKY PERFORMANCE SCORE |
RADIATIONS RADIATION REGIMENINDICATION |
COMPLETENESS OF RESECTION |
RACE | ETHNICITY | ||
| nCNV (%) | nWild-Type | logrank test | Wilcoxon-test | Fisher's exact test | Wilcoxon-test | Fisher's exact test | Fisher's exact test | Fisher's exact test | Fisher's exact test | |
| amp 12q15 | 221 (39%) | 352 |
0.132 (0.693) |
4.56e-07 (6.48e-05) |
0.00783 (0.222) |
0.343 (0.96) |
1 (1.00) |
0.402 (0.991) |
0.762 (1.00) |
0.739 (1.00) |
| amp 1q21 3 | 364 (64%) | 209 |
0.186 (0.814) |
8.07e-06 (0.000655) |
0.38 (0.982) |
0.364 (0.981) |
1 (1.00) |
0.0884 (0.636) |
0.956 (1.00) |
1 (1.00) |
| amp 1q42 2 | 317 (55%) | 256 |
0.194 (0.816) |
0.000784 (0.0342) |
0.173 (0.788) |
0.749 (1.00) |
0.589 (1.00) |
0.885 (1.00) |
0.958 (1.00) |
0.53 (1.00) |
| amp 3q26 2 | 479 (84%) | 94 |
0.999 (1.00) |
0.00206 (0.0835) |
1 (1.00) |
0.0256 (0.415) |
1 (1.00) |
0.829 (1.00) |
0.543 (1.00) |
0.648 (1.00) |
| amp 6p22 3 | 300 (52%) | 273 |
0.11 (0.645) |
0.00267 (0.101) |
1 (1.00) |
0.289 (0.927) |
1 (1.00) |
0.869 (1.00) |
0.755 (1.00) |
0.342 (0.96) |
| amp 8p11 21 | 210 (37%) | 363 |
0.223 (0.863) |
0.000568 (0.0269) |
0.112 (0.645) |
0.941 (1.00) |
0.558 (1.00) |
0.784 (1.00) |
0.978 (1.00) |
1 (1.00) |
| amp 10p15 3 | 250 (44%) | 323 |
0.11 (0.645) |
0.000468 (0.0242) |
0.317 (0.953) |
0.979 (1.00) |
0.583 (1.00) |
0.647 (1.00) |
0.271 (0.925) |
0.197 (0.816) |
| amp 12p13 33 | 328 (57%) | 245 |
0.674 (1.00) |
1.86e-07 (3.53e-05) |
0.4 (0.991) |
0.79 (1.00) |
1 (1.00) |
0.279 (0.925) |
1 (1.00) |
1 (1.00) |
| amp 12p12 1 | 312 (54%) | 261 |
0.0602 (0.581) |
1.83e-08 (5.89e-06) |
0.128 (0.692) |
0.495 (1.00) |
0.594 (1.00) |
1 (1.00) |
0.514 (1.00) |
1 (1.00) |
| amp 19q12 | 318 (55%) | 255 |
0.422 (1.00) |
1.75e-05 (0.00124) |
0.0445 (0.515) |
0.715 (1.00) |
1 (1.00) |
0.23 (0.877) |
0.377 (0.982) |
1 (1.00) |
| amp 19q13 2 | 242 (42%) | 331 |
0.0293 (0.449) |
3.06e-06 (0.000348) |
0.0725 (0.589) |
0.845 (1.00) |
0.576 (1.00) |
0.74 (1.00) |
0.0103 (0.253) |
0.747 (1.00) |
| amp 20p13 | 315 (55%) | 258 |
0.325 (0.953) |
0.00526 (0.166) |
0.322 (0.953) |
0.169 (0.788) |
1 (1.00) |
0.754 (1.00) |
0.0746 (0.589) |
0.524 (1.00) |
| amp 20q11 21 | 344 (60%) | 229 |
0.0798 (0.603) |
2.07e-08 (5.89e-06) |
1 (1.00) |
0.361 (0.981) |
1 (1.00) |
0.698 (1.00) |
0.431 (1.00) |
0.748 (1.00) |
| amp 20q13 33 | 399 (70%) | 174 |
0.32 (0.953) |
6.57e-06 (0.000622) |
0.597 (1.00) |
0.475 (1.00) |
1 (1.00) |
0.0627 (0.581) |
0.0957 (0.645) |
0.731 (1.00) |
| del 3p26 2 | 207 (36%) | 366 |
0.646 (1.00) |
0.00367 (0.13) |
0.271 (0.925) |
0.405 (0.991) |
0.0467 (0.52) |
0.534 (1.00) |
0.355 (0.975) |
1 (1.00) |
| del 6q27 | 375 (65%) | 198 |
0.109 (0.645) |
0.000102 (0.00643) |
0.367 (0.982) |
0.968 (1.00) |
1 (1.00) |
0.781 (1.00) |
0.881 (1.00) |
1 (1.00) |
| del 7p22 1 | 250 (44%) | 323 |
0.0776 (0.603) |
0.00824 (0.223) |
0.404 (0.991) |
0.486 (1.00) |
1 (1.00) |
0.574 (1.00) |
0.8 (1.00) |
0.75 (1.00) |
| del 15q11 2 | 295 (51%) | 278 |
0.935 (1.00) |
0.00427 (0.143) |
0.623 (1.00) |
0.557 (1.00) |
0.249 (0.897) |
0.599 (1.00) |
0.195 (0.816) |
0.752 (1.00) |
| del 15q15 1 | 359 (63%) | 214 |
0.886 (1.00) |
0.00571 (0.171) |
0.794 (1.00) |
0.708 (1.00) |
0.297 (0.931) |
1 (1.00) |
0.513 (1.00) |
0.327 (0.953) |
| del 16q23 1 | 447 (78%) | 126 |
0.19 (0.816) |
0.000464 (0.0242) |
0.714 (1.00) |
0.0657 (0.583) |
1 (1.00) |
0.0501 (0.537) |
0.934 (1.00) |
0.249 (0.897) |
| amp 1p34 3 | 291 (51%) | 282 |
0.0166 (0.325) |
0.0164 (0.325) |
1 (1.00) |
0.654 (1.00) |
0.249 (0.897) |
0.397 (0.991) |
0.116 (0.648) |
1 (1.00) |
| amp 2p23 2 | 247 (43%) | 326 |
0.548 (1.00) |
0.0926 (0.645) |
1 (1.00) |
0.843 (1.00) |
1 (1.00) |
0.782 (1.00) |
0.779 (1.00) |
1 (1.00) |
| amp 2q31 2 | 259 (45%) | 314 |
0.171 (0.788) |
0.0245 (0.409) |
0.324 (0.953) |
0.903 (1.00) |
0.0918 (0.645) |
0.848 (1.00) |
0.652 (1.00) |
0.338 (0.96) |
| amp 4p16 3 | 159 (28%) | 414 |
0.522 (1.00) |
0.647 (1.00) |
0.572 (1.00) |
0.236 (0.888) |
0.188 (0.814) |
0.745 (1.00) |
0.306 (0.944) |
0.727 (1.00) |
| amp 4q13 3 | 113 (20%) | 460 |
0.13 (0.692) |
0.198 (0.816) |
0.26 (0.919) |
0.555 (1.00) |
0.483 (1.00) |
0.104 (0.645) |
0.527 (1.00) |
1 (1.00) |
| amp 5p15 33 | 306 (53%) | 267 |
0.0514 (0.537) |
0.0113 (0.267) |
0.513 (1.00) |
0.735 (1.00) |
0.601 (1.00) |
0.166 (0.788) |
0.827 (1.00) |
0.753 (1.00) |
| amp 7q36 3 | 316 (55%) | 257 |
0.169 (0.788) |
0.715 (1.00) |
1 (1.00) |
0.0805 (0.603) |
0.59 (1.00) |
0.846 (1.00) |
0.0714 (0.589) |
0.342 (0.96) |
| amp 8q24 21 | 455 (79%) | 118 |
0.433 (1.00) |
0.0981 (0.645) |
1 (1.00) |
0.801 (1.00) |
0.5 (1.00) |
0.923 (1.00) |
0.661 (1.00) |
0.428 (1.00) |
| amp 10q22 3 | 182 (32%) | 391 |
0.548 (1.00) |
0.111 (0.645) |
0.0532 (0.537) |
0.852 (1.00) |
1 (1.00) |
0.461 (1.00) |
0.27 (0.925) |
1 (1.00) |
| amp 11q14 1 | 253 (44%) | 320 |
0.579 (1.00) |
0.574 (1.00) |
0.637 (1.00) |
0.76 (1.00) |
1 (1.00) |
0.775 (1.00) |
0.841 (1.00) |
0.524 (1.00) |
| amp 14q11 2 | 147 (26%) | 426 |
0.569 (1.00) |
0.0416 (0.503) |
0.0807 (0.603) |
0.469 (1.00) |
0.163 (0.788) |
0.74 (1.00) |
0.487 (1.00) |
0.141 (0.723) |
| amp 14q32 33 | 156 (27%) | 417 |
0.498 (1.00) |
0.0187 (0.35) |
0.396 (0.991) |
0.991 (1.00) |
0.0199 (0.353) |
0.955 (1.00) |
0.773 (1.00) |
0.72 (1.00) |
| amp 15q26 3 | 160 (28%) | 413 |
0.102 (0.645) |
0.204 (0.826) |
1 (1.00) |
0.833 (1.00) |
0.564 (1.00) |
0.869 (1.00) |
0.506 (1.00) |
0.733 (1.00) |
| amp 17q25 3 | 212 (37%) | 361 |
0.085 (0.619) |
0.768 (1.00) |
0.622 (1.00) |
0.925 (1.00) |
1 (1.00) |
0.0524 (0.537) |
0.765 (1.00) |
1 (1.00) |
| amp 18q11 2 | 139 (24%) | 434 |
0.745 (1.00) |
0.11 (0.645) |
0.0733 (0.589) |
0.435 (1.00) |
0.566 (1.00) |
1 (1.00) |
0.556 (1.00) |
0.26 (0.919) |
| amp 19p13 12 | 314 (55%) | 259 |
0.343 (0.96) |
0.0414 (0.503) |
0.798 (1.00) |
0.318 (0.953) |
0.592 (1.00) |
0.267 (0.925) |
0.889 (1.00) |
1 (1.00) |
| amp 22q12 2 | 91 (16%) | 482 |
0.535 (1.00) |
0.0413 (0.503) |
0.094 (0.645) |
0.302 (0.937) |
1 (1.00) |
0.621 (1.00) |
0.937 (1.00) |
0.173 (0.788) |
| amp xp11 23 | 159 (28%) | 414 |
0.129 (0.692) |
0.104 (0.645) |
0.0342 (0.499) |
0.554 (1.00) |
0.564 (1.00) |
0.191 (0.816) |
0.928 (1.00) |
1 (1.00) |
| amp xq28 | 217 (38%) | 356 |
0.482 (1.00) |
0.624 (1.00) |
1 (1.00) |
0.245 (0.897) |
0.0538 (0.537) |
0.529 (1.00) |
0.821 (1.00) |
0.327 (0.953) |
| del 1p36 11 | 266 (46%) | 307 |
0.141 (0.723) |
0.289 (0.927) |
0.627 (1.00) |
0.815 (1.00) |
1 (1.00) |
0.759 (1.00) |
0.268 (0.925) |
0.525 (1.00) |
| del 1q41 | 95 (17%) | 478 |
0.97 (1.00) |
0.442 (1.00) |
1 (1.00) |
0.979 (1.00) |
0.42 (1.00) |
0.588 (1.00) |
0.112 (0.645) |
0.377 (0.982) |
| del 2p25 3 | 120 (21%) | 453 |
0.697 (1.00) |
0.467 (1.00) |
0.696 (1.00) |
0.995 (1.00) |
0.507 (1.00) |
0.0386 (0.503) |
0.12 (0.664) |
0.45 (1.00) |
| del 2q22 1 | 134 (23%) | 439 |
0.386 (0.982) |
0.296 (0.931) |
0.496 (1.00) |
0.967 (1.00) |
1 (1.00) |
0.665 (1.00) |
0.415 (1.00) |
0.0614 (0.581) |
| del 2q37 3 | 172 (30%) | 401 |
0.381 (0.982) |
0.0191 (0.35) |
0.787 (1.00) |
0.166 (0.788) |
0.216 (0.845) |
0.673 (1.00) |
0.804 (1.00) |
1 (1.00) |
| del 3q13 31 | 84 (15%) | 489 |
0.452 (1.00) |
0.811 (1.00) |
1 (1.00) |
0.225 (0.863) |
1 (1.00) |
0.439 (1.00) |
0.807 (1.00) |
1 (1.00) |
| del 4q22 1 | 390 (68%) | 183 |
0.391 (0.991) |
0.879 (1.00) |
0.797 (1.00) |
0.736 (1.00) |
1 (1.00) |
0.851 (1.00) |
0.735 (1.00) |
0.174 (0.788) |
| del 4q34 3 | 416 (73%) | 157 |
0.804 (1.00) |
0.46 (1.00) |
0.572 (1.00) |
0.152 (0.769) |
0.566 (1.00) |
0.407 (0.993) |
0.829 (1.00) |
0.0674 (0.589) |
| del 5q12 1 | 350 (61%) | 223 |
0.88 (1.00) |
0.678 (1.00) |
0.497 (1.00) |
0.243 (0.897) |
0.563 (1.00) |
0.374 (0.982) |
0.107 (0.645) |
1 (1.00) |
| del 5q13 2 | 414 (72%) | 159 |
0.301 (0.937) |
0.998 (1.00) |
0.402 (0.991) |
0.177 (0.791) |
0.188 (0.814) |
0.215 (0.845) |
0.232 (0.877) |
0.733 (1.00) |
| del 8p23 3 | 384 (67%) | 189 |
0.169 (0.788) |
0.0691 (0.589) |
1 (1.00) |
0.555 (1.00) |
1 (1.00) |
0.52 (1.00) |
0.863 (1.00) |
0.175 (0.788) |
| del 8p21 2 | 401 (70%) | 172 |
0.633 (1.00) |
0.0738 (0.589) |
1 (1.00) |
0.894 (1.00) |
1 (1.00) |
0.56 (1.00) |
0.982 (1.00) |
0.293 (0.931) |
| del 9p24 3 | 259 (45%) | 314 |
0.705 (1.00) |
0.0153 (0.321) |
0.319 (0.953) |
0.554 (1.00) |
0.592 (1.00) |
0.82 (1.00) |
0.85 (1.00) |
1 (1.00) |
| del 9q34 13 | 341 (60%) | 232 |
0.954 (1.00) |
0.0614 (0.581) |
0.497 (1.00) |
0.962 (1.00) |
0.276 (0.925) |
0.678 (1.00) |
0.383 (0.982) |
1 (1.00) |
| del 10p15 3 | 117 (20%) | 456 |
0.279 (0.925) |
0.881 (1.00) |
0.677 (1.00) |
0.831 (1.00) |
0.497 (1.00) |
1 (1.00) |
0.224 (0.863) |
0.697 (1.00) |
| del 10q24 2 | 250 (44%) | 323 |
0.202 (0.826) |
0.0508 (0.537) |
1 (1.00) |
0.646 (1.00) |
0.583 (1.00) |
1 (1.00) |
0.243 (0.897) |
1 (1.00) |
| del 11p15 5 | 340 (59%) | 233 |
0.128 (0.692) |
0.363 (0.981) |
0.0098 (0.253) |
0.539 (1.00) |
1 (1.00) |
0.754 (1.00) |
0.84 (1.00) |
1 (1.00) |
| del 11q25 | 200 (35%) | 373 |
0.656 (1.00) |
0.041 (0.503) |
0.163 (0.788) |
0.322 (0.953) |
0.28 (0.925) |
0.708 (1.00) |
0.901 (1.00) |
0.0382 (0.503) |
| del 12q24 33 | 214 (37%) | 359 |
0.86 (1.00) |
0.0741 (0.589) |
0.384 (0.982) |
0.636 (1.00) |
0.297 (0.931) |
0.0456 (0.519) |
0.756 (1.00) |
0.0368 (0.503) |
| del 13q14 2 | 359 (63%) | 214 |
0.0634 (0.581) |
0.403 (0.991) |
0.383 (0.982) |
0.843 (1.00) |
0.559 (1.00) |
0.259 (0.919) |
0.279 (0.925) |
0.746 (1.00) |
| del 14q23 3 | 303 (53%) | 270 |
0.975 (1.00) |
0.498 (1.00) |
0.178 (0.792) |
0.0965 (0.645) |
0.104 (0.645) |
0.377 (0.982) |
0.348 (0.97) |
0.115 (0.648) |
| del 16p13 3 | 309 (54%) | 264 |
0.896 (1.00) |
0.688 (1.00) |
1 (1.00) |
0.501 (1.00) |
0.597 (1.00) |
0.906 (1.00) |
0.87 (1.00) |
0.521 (1.00) |
| del 16q22 1 | 457 (80%) | 116 |
0.702 (1.00) |
0.0145 (0.317) |
0.273 (0.925) |
0.133 (0.693) |
1 (1.00) |
0.0439 (0.515) |
0.913 (1.00) |
0.428 (1.00) |
| del 17p12 | 486 (85%) | 87 |
0.966 (1.00) |
0.772 (1.00) |
0.169 (0.788) |
0.831 (1.00) |
1 (1.00) |
0.49 (1.00) |
0.976 (1.00) |
0.656 (1.00) |
| del 17q11 2 | 467 (82%) | 106 |
0.661 (1.00) |
0.0125 (0.284) |
0.0224 (0.385) |
0.994 (1.00) |
1 (1.00) |
1 (1.00) |
0.702 (1.00) |
0.697 (1.00) |
| del 18q23 | 377 (66%) | 196 |
0.873 (1.00) |
0.615 (1.00) |
0.155 (0.78) |
0.653 (1.00) |
1 (1.00) |
0.105 (0.645) |
0.288 (0.927) |
1 (1.00) |
| del 19p13 3 | 506 (88%) | 67 |
0.195 (0.816) |
0.0263 (0.415) |
1 (1.00) |
0.102 (0.645) |
1 (1.00) |
1 (1.00) |
0.0651 (0.583) |
1 (1.00) |
| del 19q13 33 | 296 (52%) | 277 |
0.364 (0.981) |
0.548 (1.00) |
0.805 (1.00) |
0.0847 (0.619) |
0.25 (0.897) |
0.328 (0.953) |
0.209 (0.837) |
0.114 (0.647) |
| del 19q13 43 | 282 (49%) | 291 |
0.332 (0.954) |
0.0336 (0.499) |
1 (1.00) |
0.0408 (0.503) |
1 (1.00) |
0.372 (0.982) |
0.211 (0.838) |
0.209 (0.837) |
| del 21q22 3 | 224 (39%) | 349 |
0.411 (0.997) |
0.426 (1.00) |
0.791 (1.00) |
0.329 (0.953) |
1 (1.00) |
0.354 (0.975) |
0.64 (1.00) |
0.331 (0.954) |
| del 22q13 32 | 498 (87%) | 75 |
0.953 (1.00) |
0.847 (1.00) |
0.284 (0.927) |
0.432 (1.00) |
1 (1.00) |
0.816 (1.00) |
0.802 (1.00) |
1 (1.00) |
| del xp21 1 | 352 (61%) | 221 |
0.999 (1.00) |
0.354 (0.975) |
1 (1.00) |
0.948 (1.00) |
0.288 (0.927) |
0.758 (1.00) |
0.912 (1.00) |
0.747 (1.00) |
P value = 8.07e-06 (Wilcoxon-test), Q value = 0.00065
Table S1. Gene #2: 'amp_1q21.3' versus Clinical Feature #2: 'YEARS_TO_BIRTH'
| nPatients | Mean (Std.Dev) | |
|---|---|---|
| ALL | 552 | 59.8 (11.6) |
| AMP PEAK 2(1Q21.3) MUTATED | 351 | 61.5 (10.9) |
| AMP PEAK 2(1Q21.3) WILD-TYPE | 201 | 56.9 (12.1) |
Figure S1. Get High-res Image Gene #2: 'amp_1q21.3' versus Clinical Feature #2: 'YEARS_TO_BIRTH'

P value = 0.000784 (Wilcoxon-test), Q value = 0.034
Table S2. Gene #3: 'amp_1q42.2' versus Clinical Feature #2: 'YEARS_TO_BIRTH'
| nPatients | Mean (Std.Dev) | |
|---|---|---|
| ALL | 552 | 59.8 (11.6) |
| AMP PEAK 3(1Q42.2) MUTATED | 304 | 61.3 (11.2) |
| AMP PEAK 3(1Q42.2) WILD-TYPE | 248 | 58.1 (11.8) |
Figure S2. Get High-res Image Gene #3: 'amp_1q42.2' versus Clinical Feature #2: 'YEARS_TO_BIRTH'
P value = 0.00206 (Wilcoxon-test), Q value = 0.083
Table S3. Gene #6: 'amp_3q26.2' versus Clinical Feature #2: 'YEARS_TO_BIRTH'
| nPatients | Mean (Std.Dev) | |
|---|---|---|
| ALL | 552 | 59.8 (11.6) |
| AMP PEAK 6(3Q26.2) MUTATED | 462 | 60.5 (11.3) |
| AMP PEAK 6(3Q26.2) WILD-TYPE | 90 | 56.2 (12.3) |
Figure S3. Get High-res Image Gene #6: 'amp_3q26.2' versus Clinical Feature #2: 'YEARS_TO_BIRTH'

P value = 0.00267 (Wilcoxon-test), Q value = 0.1
Table S4. Gene #10: 'amp_6p22.3' versus Clinical Feature #2: 'YEARS_TO_BIRTH'
| nPatients | Mean (Std.Dev) | |
|---|---|---|
| ALL | 552 | 59.8 (11.6) |
| AMP PEAK 10(6P22.3) MUTATED | 290 | 61.2 (11.8) |
| AMP PEAK 10(6P22.3) WILD-TYPE | 262 | 58.3 (11.2) |
Figure S4. Get High-res Image Gene #10: 'amp_6p22.3' versus Clinical Feature #2: 'YEARS_TO_BIRTH'

P value = 0.000568 (Wilcoxon-test), Q value = 0.027
Table S5. Gene #12: 'amp_8p11.21' versus Clinical Feature #2: 'YEARS_TO_BIRTH'
| nPatients | Mean (Std.Dev) | |
|---|---|---|
| ALL | 552 | 59.8 (11.6) |
| AMP PEAK 12(8P11.21) MUTATED | 200 | 62.1 (10.9) |
| AMP PEAK 12(8P11.21) WILD-TYPE | 352 | 58.5 (11.8) |
Figure S5. Get High-res Image Gene #12: 'amp_8p11.21' versus Clinical Feature #2: 'YEARS_TO_BIRTH'
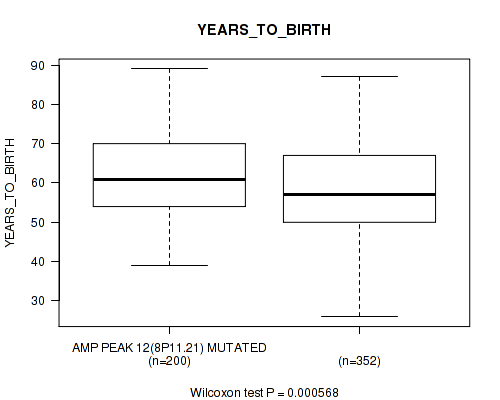
P value = 0.000468 (Wilcoxon-test), Q value = 0.024
Table S6. Gene #14: 'amp_10p15.3' versus Clinical Feature #2: 'YEARS_TO_BIRTH'
| nPatients | Mean (Std.Dev) | |
|---|---|---|
| ALL | 552 | 59.8 (11.6) |
| AMP PEAK 14(10P15.3) MUTATED | 244 | 61.7 (11.2) |
| AMP PEAK 14(10P15.3) WILD-TYPE | 308 | 58.4 (11.7) |
Figure S6. Get High-res Image Gene #14: 'amp_10p15.3' versus Clinical Feature #2: 'YEARS_TO_BIRTH'

P value = 1.86e-07 (Wilcoxon-test), Q value = 3.5e-05
Table S7. Gene #17: 'amp_12p13.33' versus Clinical Feature #2: 'YEARS_TO_BIRTH'
| nPatients | Mean (Std.Dev) | |
|---|---|---|
| ALL | 552 | 59.8 (11.6) |
| AMP PEAK 17(12P13.33) MUTATED | 316 | 62.1 (10.8) |
| AMP PEAK 17(12P13.33) WILD-TYPE | 236 | 56.8 (11.9) |
Figure S7. Get High-res Image Gene #17: 'amp_12p13.33' versus Clinical Feature #2: 'YEARS_TO_BIRTH'
P value = 1.83e-08 (Wilcoxon-test), Q value = 5.9e-06
Table S8. Gene #18: 'amp_12p12.1' versus Clinical Feature #2: 'YEARS_TO_BIRTH'
| nPatients | Mean (Std.Dev) | |
|---|---|---|
| ALL | 552 | 59.8 (11.6) |
| AMP PEAK 18(12P12.1) MUTATED | 298 | 62.4 (11.2) |
| AMP PEAK 18(12P12.1) WILD-TYPE | 254 | 56.8 (11.3) |
Figure S8. Get High-res Image Gene #18: 'amp_12p12.1' versus Clinical Feature #2: 'YEARS_TO_BIRTH'
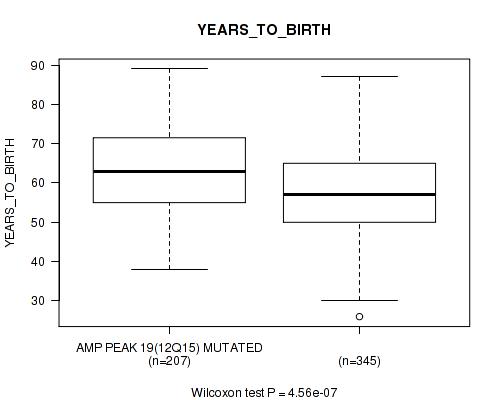
P value = 4.56e-07 (Wilcoxon-test), Q value = 6.5e-05
Table S9. Gene #19: 'amp_12q15' versus Clinical Feature #2: 'YEARS_TO_BIRTH'
| nPatients | Mean (Std.Dev) | |
|---|---|---|
| ALL | 552 | 59.8 (11.6) |
| AMP PEAK 19(12Q15) MUTATED | 207 | 63.0 (11.2) |
| AMP PEAK 19(12Q15) WILD-TYPE | 345 | 57.9 (11.4) |
Figure S9. Get High-res Image Gene #19: 'amp_12q15' versus Clinical Feature #2: 'YEARS_TO_BIRTH'
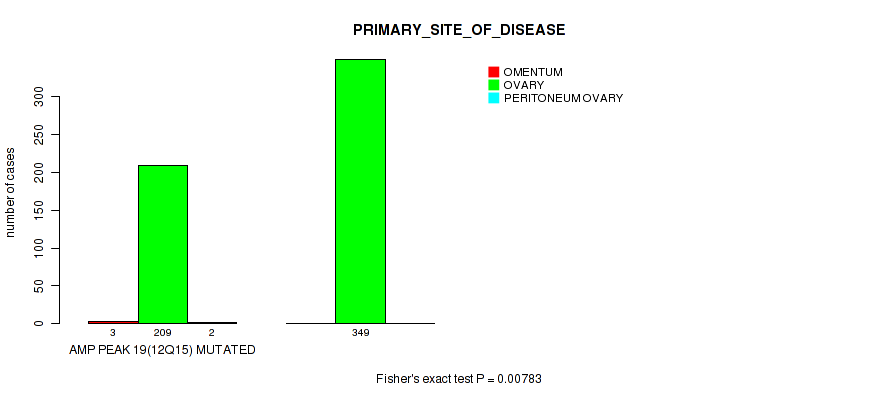
P value = 0.00783 (Fisher's exact test), Q value = 0.22
Table S10. Gene #19: 'amp_12q15' versus Clinical Feature #3: 'PRIMARY_SITE_OF_DISEASE'
| nPatients | OMENTUM | OVARY | PERITONEUM OVARY |
|---|---|---|---|
| ALL | 3 | 558 | 2 |
| AMP PEAK 19(12Q15) MUTATED | 3 | 209 | 2 |
| AMP PEAK 19(12Q15) WILD-TYPE | 0 | 349 | 0 |
Figure S10. Get High-res Image Gene #19: 'amp_12q15' versus Clinical Feature #3: 'PRIMARY_SITE_OF_DISEASE'
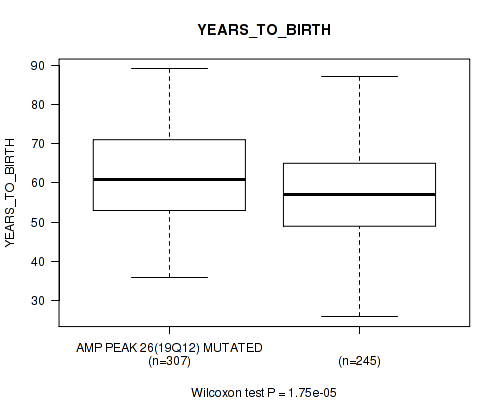
P value = 1.75e-05 (Wilcoxon-test), Q value = 0.0012
Table S11. Gene #26: 'amp_19q12' versus Clinical Feature #2: 'YEARS_TO_BIRTH'
| nPatients | Mean (Std.Dev) | |
|---|---|---|
| ALL | 552 | 59.8 (11.6) |
| AMP PEAK 26(19Q12) MUTATED | 307 | 61.8 (11.1) |
| AMP PEAK 26(19Q12) WILD-TYPE | 245 | 57.4 (11.7) |
Figure S11. Get High-res Image Gene #26: 'amp_19q12' versus Clinical Feature #2: 'YEARS_TO_BIRTH'
P value = 3.06e-06 (Wilcoxon-test), Q value = 0.00035
Table S12. Gene #27: 'amp_19q13.2' versus Clinical Feature #2: 'YEARS_TO_BIRTH'
| nPatients | Mean (Std.Dev) | |
|---|---|---|
| ALL | 552 | 59.8 (11.6) |
| AMP PEAK 27(19Q13.2) MUTATED | 235 | 62.5 (11.2) |
| AMP PEAK 27(19Q13.2) WILD-TYPE | 317 | 57.8 (11.5) |
Figure S12. Get High-res Image Gene #27: 'amp_19q13.2' versus Clinical Feature #2: 'YEARS_TO_BIRTH'

P value = 0.00526 (Wilcoxon-test), Q value = 0.17
Table S13. Gene #28: 'amp_20p13' versus Clinical Feature #2: 'YEARS_TO_BIRTH'
| nPatients | Mean (Std.Dev) | |
|---|---|---|
| ALL | 552 | 59.8 (11.6) |
| AMP PEAK 28(20P13) MUTATED | 305 | 61.1 (11.7) |
| AMP PEAK 28(20P13) WILD-TYPE | 247 | 58.2 (11.2) |
Figure S13. Get High-res Image Gene #28: 'amp_20p13' versus Clinical Feature #2: 'YEARS_TO_BIRTH'

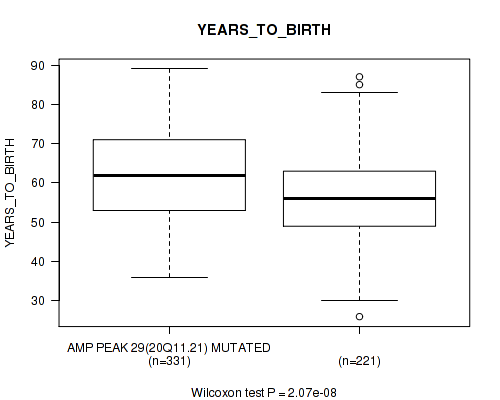
P value = 2.07e-08 (Wilcoxon-test), Q value = 5.9e-06
Table S14. Gene #29: 'amp_20q11.21' versus Clinical Feature #2: 'YEARS_TO_BIRTH'
| nPatients | Mean (Std.Dev) | |
|---|---|---|
| ALL | 552 | 59.8 (11.6) |
| AMP PEAK 29(20Q11.21) MUTATED | 331 | 62.1 (11.5) |
| AMP PEAK 29(20Q11.21) WILD-TYPE | 221 | 56.4 (10.9) |
Figure S14. Get High-res Image Gene #29: 'amp_20q11.21' versus Clinical Feature #2: 'YEARS_TO_BIRTH'
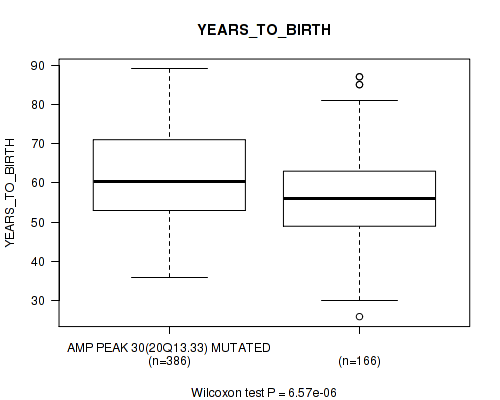
P value = 6.57e-06 (Wilcoxon-test), Q value = 0.00062
Table S15. Gene #30: 'amp_20q13.33' versus Clinical Feature #2: 'YEARS_TO_BIRTH'
| nPatients | Mean (Std.Dev) | |
|---|---|---|
| ALL | 552 | 59.8 (11.6) |
| AMP PEAK 30(20Q13.33) MUTATED | 386 | 61.3 (11.5) |
| AMP PEAK 30(20Q13.33) WILD-TYPE | 166 | 56.5 (11.1) |
Figure S15. Get High-res Image Gene #30: 'amp_20q13.33' versus Clinical Feature #2: 'YEARS_TO_BIRTH'
P value = 0.00367 (Wilcoxon-test), Q value = 0.13
Table S16. Gene #39: 'del_3p26.2' versus Clinical Feature #2: 'YEARS_TO_BIRTH'
| nPatients | Mean (Std.Dev) | |
|---|---|---|
| ALL | 552 | 59.8 (11.6) |
| DEL PEAK 6(3P26.2) MUTATED | 199 | 61.8 (11.6) |
| DEL PEAK 6(3P26.2) WILD-TYPE | 353 | 58.7 (11.4) |
Figure S16. Get High-res Image Gene #39: 'del_3p26.2' versus Clinical Feature #2: 'YEARS_TO_BIRTH'
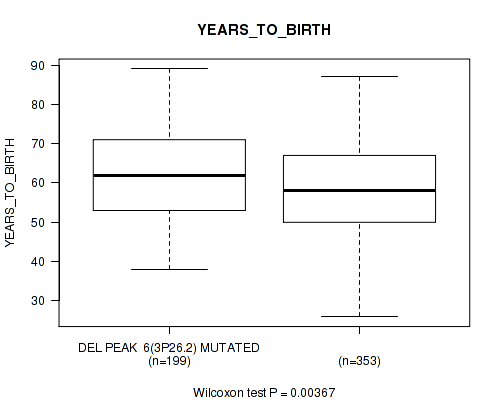
P value = 0.000102 (Wilcoxon-test), Q value = 0.0064
Table S17. Gene #45: 'del_6q27' versus Clinical Feature #2: 'YEARS_TO_BIRTH'
| nPatients | Mean (Std.Dev) | |
|---|---|---|
| ALL | 552 | 59.8 (11.6) |
| DEL PEAK 12(6Q27) MUTATED | 360 | 58.5 (11.4) |
| DEL PEAK 12(6Q27) WILD-TYPE | 192 | 62.4 (11.5) |
Figure S17. Get High-res Image Gene #45: 'del_6q27' versus Clinical Feature #2: 'YEARS_TO_BIRTH'
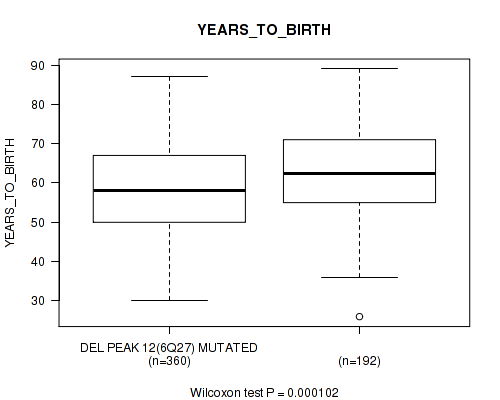
P value = 0.00824 (Wilcoxon-test), Q value = 0.22
Table S18. Gene #46: 'del_7p22.1' versus Clinical Feature #2: 'YEARS_TO_BIRTH'
| nPatients | Mean (Std.Dev) | |
|---|---|---|
| ALL | 552 | 59.8 (11.6) |
| DEL PEAK 13(7P22.1) MUTATED | 240 | 58.5 (11.4) |
| DEL PEAK 13(7P22.1) WILD-TYPE | 312 | 60.9 (11.6) |
Figure S18. Get High-res Image Gene #46: 'del_7p22.1' versus Clinical Feature #2: 'YEARS_TO_BIRTH'
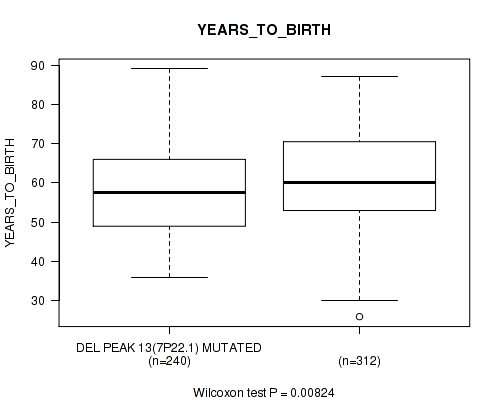
P value = 0.00427 (Wilcoxon-test), Q value = 0.14
Table S19. Gene #58: 'del_15q11.2' versus Clinical Feature #2: 'YEARS_TO_BIRTH'
| nPatients | Mean (Std.Dev) | |
|---|---|---|
| ALL | 552 | 59.8 (11.6) |
| DEL PEAK 25(15Q11.2) MUTATED | 284 | 61.2 (11.4) |
| DEL PEAK 25(15Q11.2) WILD-TYPE | 268 | 58.4 (11.6) |
Figure S19. Get High-res Image Gene #58: 'del_15q11.2' versus Clinical Feature #2: 'YEARS_TO_BIRTH'

P value = 0.00571 (Wilcoxon-test), Q value = 0.17
Table S20. Gene #59: 'del_15q15.1' versus Clinical Feature #2: 'YEARS_TO_BIRTH'
| nPatients | Mean (Std.Dev) | |
|---|---|---|
| ALL | 552 | 59.8 (11.6) |
| DEL PEAK 26(15Q15.1) MUTATED | 346 | 60.9 (11.1) |
| DEL PEAK 26(15Q15.1) WILD-TYPE | 206 | 58.1 (12.1) |
Figure S20. Get High-res Image Gene #59: 'del_15q15.1' versus Clinical Feature #2: 'YEARS_TO_BIRTH'
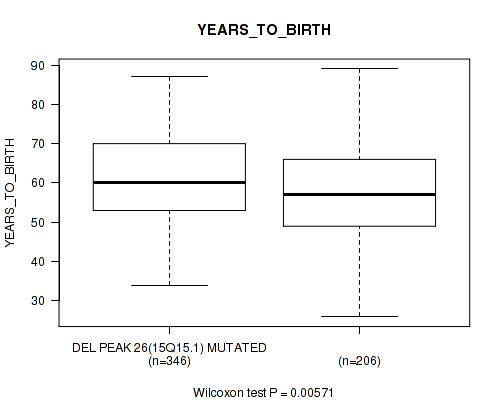
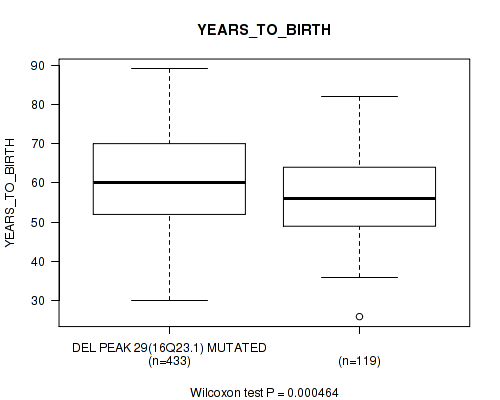
P value = 0.000464 (Wilcoxon-test), Q value = 0.024
Table S21. Gene #62: 'del_16q23.1' versus Clinical Feature #2: 'YEARS_TO_BIRTH'
| nPatients | Mean (Std.Dev) | |
|---|---|---|
| ALL | 552 | 59.8 (11.6) |
| DEL PEAK 29(16Q23.1) MUTATED | 433 | 60.8 (11.5) |
| DEL PEAK 29(16Q23.1) WILD-TYPE | 119 | 56.4 (11.3) |
Figure S21. Get High-res Image Gene #62: 'del_16q23.1' versus Clinical Feature #2: 'YEARS_TO_BIRTH'
-
Copy number data file = all_lesions.txt from GISTIC pipeline
-
Processed Copy number data file = /xchip/cga/gdac-prod/tcga-gdac/jobResults/GDAC_Correlate_Genomic_Events_Preprocess/OV-TP/15096461/transformed.cor.cli.txt
-
Clinical data file = /xchip/cga/gdac-prod/tcga-gdac/jobResults/Append_Data/OV-TP/15085780/OV-TP.merged_data.txt
-
Number of patients = 573
-
Number of significantly focal cnvs = 71
-
Number of selected clinical features = 8
-
Exclude genes that fewer than K tumors have mutations, K = 3
For survival clinical features, the Kaplan-Meier survival curves of tumors with and without gene mutations were plotted and the statistical significance P values were estimated by logrank test (Bland and Altman 2004) using the 'survdiff' function in R
For binary or multi-class clinical features (nominal or ordinal), two-tailed Fisher's exact tests (Fisher 1922) were used to estimate the P values using the 'fisher.test' function in R
For multiple hypothesis correction, Q value is the False Discovery Rate (FDR) analogue of the P value (Benjamini and Hochberg 1995), defined as the minimum FDR at which the test may be called significant. We used the 'Benjamini and Hochberg' method of 'p.adjust' function in R to convert P values into Q values.
In addition to the links below, the full results of the analysis summarized in this report can also be downloaded programmatically using firehose_get, or interactively from either the Broad GDAC website or TCGA Data Coordination Center Portal.