This pipeline computes the correlation between significant arm-level copy number variations (cnvs) and selected clinical features.
Testing the association between copy number variation 69 arm-level events and 4 clinical features across 162 patients, one significant finding detected with Q value < 0.25.
-
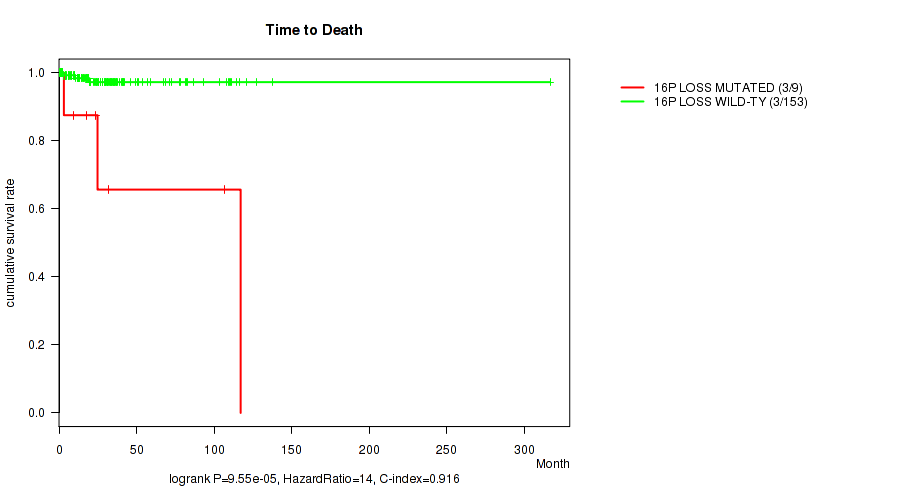
16p loss cnv correlated to 'Time to Death'.
Table 1. Get Full Table Overview of the association between significant copy number variation of 69 arm-level events and 4 clinical features. Shown in the table are P values (Q values). Thresholded by Q value < 0.25, one significant finding detected.
|
Clinical Features |
Time to Death |
YEARS TO BIRTH |
GENDER | RACE | ||
| nCNV (%) | nWild-Type | logrank test | Wilcoxon-test | Fisher's exact test | Fisher's exact test | |
| 16p loss | 9 (6%) | 153 |
9.55e-05 (0.0264) |
0.124 (1.00) |
0.733 (1.00) |
0.721 (1.00) |
| 1p gain | 7 (4%) | 155 |
0.424 (1.00) |
0.419 (1.00) |
0.048 (1.00) |
1 (1.00) |
| 1q gain | 19 (12%) | 143 |
0.489 (1.00) |
0.0891 (1.00) |
0.141 (1.00) |
0.857 (1.00) |
| 2p gain | 6 (4%) | 156 |
0.62 (1.00) |
0.968 (1.00) |
1 (1.00) |
0.227 (1.00) |
| 4p gain | 4 (2%) | 158 |
0.657 (1.00) |
0.339 (1.00) |
0.332 (1.00) |
0.208 (1.00) |
| 4q gain | 3 (2%) | 159 |
0.756 (1.00) |
0.305 (1.00) |
0.593 (1.00) |
1 (1.00) |
| 5p gain | 11 (7%) | 151 |
0.529 (1.00) |
0.225 (1.00) |
0.756 (1.00) |
1 (1.00) |
| 5q gain | 7 (4%) | 155 |
0.594 (1.00) |
0.863 (1.00) |
0.127 (1.00) |
1 (1.00) |
| 6p gain | 15 (9%) | 147 |
0.483 (1.00) |
0.0416 (1.00) |
1 (1.00) |
1 (1.00) |
| 6q gain | 8 (5%) | 154 |
0.603 (1.00) |
0.071 (1.00) |
1 (1.00) |
0.46 (1.00) |
| 7p gain | 27 (17%) | 135 |
0.337 (1.00) |
0.694 (1.00) |
0.53 (1.00) |
0.617 (1.00) |
| 7q gain | 22 (14%) | 140 |
0.391 (1.00) |
0.845 (1.00) |
0.106 (1.00) |
1 (1.00) |
| 8p gain | 10 (6%) | 152 |
0.554 (1.00) |
0.211 (1.00) |
1 (1.00) |
0.571 (1.00) |
| 8q gain | 13 (8%) | 149 |
0.328 (1.00) |
0.851 (1.00) |
0.259 (1.00) |
0.345 (1.00) |
| 9p gain | 4 (2%) | 158 |
0.729 (1.00) |
0.742 (1.00) |
1 (1.00) |
0.498 (1.00) |
| 9q gain | 3 (2%) | 159 |
0.756 (1.00) |
0.374 (1.00) |
1 (1.00) |
0.401 (1.00) |
| 10p gain | 12 (7%) | 150 |
0.571 (1.00) |
0.972 (1.00) |
1 (1.00) |
0.763 (1.00) |
| 10q gain | 10 (6%) | 152 |
0.612 (1.00) |
0.646 (1.00) |
0.514 (1.00) |
1 (1.00) |
| 11p gain | 5 (3%) | 157 |
0.772 (1.00) |
0.611 (1.00) |
0.377 (1.00) |
1 (1.00) |
| 12p gain | 11 (7%) | 151 |
0.526 (1.00) |
0.266 (1.00) |
1 (1.00) |
0.759 (1.00) |
| 12q gain | 14 (9%) | 148 |
0.474 (1.00) |
0.661 (1.00) |
1 (1.00) |
0.821 (1.00) |
| 13q gain | 9 (6%) | 153 |
0.603 (1.00) |
0.829 (1.00) |
0.733 (1.00) |
1 (1.00) |
| 14q gain | 4 (2%) | 158 |
0.00491 (0.453) |
0.901 (1.00) |
0.332 (1.00) |
0.5 (1.00) |
| 15q gain | 14 (9%) | 148 |
0.481 (1.00) |
0.406 (1.00) |
0.784 (1.00) |
0.245 (1.00) |
| 16p gain | 6 (4%) | 156 |
0.653 (1.00) |
0.327 (1.00) |
0.689 (1.00) |
0.651 (1.00) |
| 16q gain | 6 (4%) | 156 |
0.0509 (1.00) |
0.0753 (1.00) |
1 (1.00) |
0.647 (1.00) |
| 17q gain | 5 (3%) | 157 |
0.7 (1.00) |
0.591 (1.00) |
0.179 (1.00) |
0.579 (1.00) |
| 18p gain | 8 (5%) | 154 |
0.56 (1.00) |
0.954 (1.00) |
0.471 (1.00) |
1 (1.00) |
| 18q gain | 10 (6%) | 152 |
0.529 (1.00) |
0.611 (1.00) |
1 (1.00) |
1 (1.00) |
| 19p gain | 20 (12%) | 142 |
0.725 (1.00) |
0.019 (0.874) |
0.638 (1.00) |
1 (1.00) |
| 19q gain | 14 (9%) | 148 |
0.467 (1.00) |
0.0235 (0.925) |
1 (1.00) |
0.821 (1.00) |
| 20p gain | 12 (7%) | 150 |
0.497 (1.00) |
0.294 (1.00) |
1 (1.00) |
0.603 (1.00) |
| 20q gain | 10 (6%) | 152 |
0.511 (1.00) |
0.333 (1.00) |
0.756 (1.00) |
1 (1.00) |
| 21q gain | 3 (2%) | 159 |
0.759 (1.00) |
0.0182 (0.874) |
0.593 (1.00) |
0.404 (1.00) |
| 22q gain | 3 (2%) | 159 |
0.756 (1.00) |
0.543 (1.00) |
0.593 (1.00) |
0.406 (1.00) |
| xp gain | 6 (4%) | 156 |
0.622 (1.00) |
0.842 (1.00) |
0.221 (1.00) |
0.338 (1.00) |
| xq gain | 5 (3%) | 157 |
0.661 (1.00) |
0.958 (1.00) |
0.377 (1.00) |
0.579 (1.00) |
| 1p loss | 98 (60%) | 64 |
0.208 (1.00) |
0.894 (1.00) |
0.748 (1.00) |
0.231 (1.00) |
| 1q loss | 27 (17%) | 135 |
0.94 (1.00) |
0.927 (1.00) |
0.53 (1.00) |
0.219 (1.00) |
| 2p loss | 10 (6%) | 152 |
0.646 (1.00) |
0.636 (1.00) |
1 (1.00) |
0.402 (1.00) |
| 2q loss | 13 (8%) | 149 |
0.497 (1.00) |
0.995 (1.00) |
0.259 (1.00) |
0.529 (1.00) |
| 3p loss | 62 (38%) | 100 |
0.535 (1.00) |
0.307 (1.00) |
0.195 (1.00) |
0.0687 (1.00) |
| 3q loss | 88 (54%) | 74 |
0.323 (1.00) |
0.145 (1.00) |
0.875 (1.00) |
0.935 (1.00) |
| 4p loss | 11 (7%) | 151 |
0.601 (1.00) |
0.823 (1.00) |
0.551 (1.00) |
1 (1.00) |
| 4q loss | 10 (6%) | 152 |
0.587 (1.00) |
0.989 (1.00) |
0.514 (1.00) |
1 (1.00) |
| 5p loss | 5 (3%) | 157 |
0.772 (1.00) |
0.981 (1.00) |
0.661 (1.00) |
0.579 (1.00) |
| 5q loss | 7 (4%) | 155 |
0.684 (1.00) |
0.751 (1.00) |
0.703 (1.00) |
0.4 (1.00) |
| 6q loss | 19 (12%) | 143 |
0.61 (1.00) |
0.859 (1.00) |
0.469 (1.00) |
0.856 (1.00) |
| 7q loss | 6 (4%) | 156 |
0.0957 (1.00) |
0.683 (1.00) |
1 (1.00) |
0.0179 (0.874) |
| 8p loss | 20 (12%) | 142 |
0.188 (1.00) |
0.249 (1.00) |
0.346 (1.00) |
0.507 (1.00) |
| 8q loss | 12 (7%) | 150 |
0.292 (1.00) |
0.567 (1.00) |
1 (1.00) |
1 (1.00) |
| 9p loss | 11 (7%) | 151 |
0.028 (0.965) |
0.704 (1.00) |
1 (1.00) |
1 (1.00) |
| 9q loss | 11 (7%) | 151 |
0.568 (1.00) |
0.316 (1.00) |
1 (1.00) |
0.759 (1.00) |
| 11p loss | 54 (33%) | 108 |
0.56 (1.00) |
0.919 (1.00) |
0.316 (1.00) |
0.598 (1.00) |
| 11q loss | 40 (25%) | 122 |
0.925 (1.00) |
0.712 (1.00) |
0.856 (1.00) |
1 (1.00) |
| 13q loss | 8 (5%) | 154 |
0.61 (1.00) |
0.951 (1.00) |
1 (1.00) |
0.315 (1.00) |
| 14q loss | 20 (12%) | 142 |
0.316 (1.00) |
0.311 (1.00) |
0.811 (1.00) |
0.671 (1.00) |
| 15q loss | 3 (2%) | 159 |
0.545 (1.00) |
0.452 (1.00) |
0.251 (1.00) |
0.0425 (1.00) |
| 16q loss | 5 (3%) | 157 |
0.693 (1.00) |
0.131 (1.00) |
1 (1.00) |
1 (1.00) |
| 17p loss | 61 (38%) | 101 |
0.958 (1.00) |
0.761 (1.00) |
0.332 (1.00) |
0.081 (1.00) |
| 17q loss | 19 (12%) | 143 |
0.11 (1.00) |
0.585 (1.00) |
0.328 (1.00) |
0.758 (1.00) |
| 18p loss | 16 (10%) | 146 |
0.478 (1.00) |
0.511 (1.00) |
0.19 (1.00) |
0.177 (1.00) |
| 18q loss | 6 (4%) | 156 |
0.69 (1.00) |
0.435 (1.00) |
0.413 (1.00) |
0.148 (1.00) |
| 19q loss | 6 (4%) | 156 |
0.0901 (1.00) |
0.723 (1.00) |
1 (1.00) |
0.23 (1.00) |
| 20q loss | 3 (2%) | 159 |
0.83 (1.00) |
0.751 (1.00) |
1 (1.00) |
1 (1.00) |
| 21q loss | 36 (22%) | 126 |
0.2 (1.00) |
0.588 (1.00) |
0.705 (1.00) |
0.207 (1.00) |
| 22q loss | 58 (36%) | 104 |
0.00492 (0.453) |
0.388 (1.00) |
0.742 (1.00) |
0.669 (1.00) |
| xp loss | 48 (30%) | 114 |
0.847 (1.00) |
0.958 (1.00) |
0.733 (1.00) |
0.563 (1.00) |
| xq loss | 49 (30%) | 113 |
0.872 (1.00) |
0.926 (1.00) |
0.865 (1.00) |
0.614 (1.00) |
P value = 9.55e-05 (logrank test), Q value = 0.026
Table S1. Gene #58: '16p loss' versus Clinical Feature #1: 'Time to Death'
| nPatients | nDeath | Duration Range (Median), Month | |
|---|---|---|---|
| ALL | 162 | 6 | 0.1 - 316.7 (21.4) |
| 16P LOSS MUTATED | 9 | 3 | 0.8 - 117.1 (23.8) |
| 16P LOSS WILD-TYPE | 153 | 3 | 0.1 - 316.7 (20.6) |
Figure S1. Get High-res Image Gene #58: '16p loss' versus Clinical Feature #1: 'Time to Death'
-
Copy number data file = broad_values_by_arm.txt from GISTIC pipeline
-
Processed Copy number data file = /xchip/cga/gdac-prod/tcga-gdac/jobResults/GDAC_Correlate_Genomic_Events_Preprocess/PCPG-TP/15096455/transformed.cor.cli.txt
-
Clinical data file = /xchip/cga/gdac-prod/tcga-gdac/jobResults/Append_Data/PCPG-TP/15087180/PCPG-TP.merged_data.txt
-
Number of patients = 162
-
Number of significantly arm-level cnvs = 69
-
Number of selected clinical features = 4
-
Exclude regions that fewer than K tumors have mutations, K = 3
For survival clinical features, the Kaplan-Meier survival curves of tumors with and without gene mutations were plotted and the statistical significance P values were estimated by logrank test (Bland and Altman 2004) using the 'survdiff' function in R
For binary or multi-class clinical features (nominal or ordinal), two-tailed Fisher's exact tests (Fisher 1922) were used to estimate the P values using the 'fisher.test' function in R
For multiple hypothesis correction, Q value is the False Discovery Rate (FDR) analogue of the P value (Benjamini and Hochberg 1995), defined as the minimum FDR at which the test may be called significant. We used the 'Benjamini and Hochberg' method of 'p.adjust' function in R to convert P values into Q values.
In addition to the links below, the full results of the analysis summarized in this report can also be downloaded programmatically using firehose_get, or interactively from either the Broad GDAC website or TCGA Data Coordination Center Portal.