This pipeline computes the correlation between significant copy number variation (cnv focal) genes and selected clinical features.
Testing the association between copy number variation 28 focal events and 4 clinical features across 162 patients, one significant finding detected with Q value < 0.25.
-
del_9p24.2 cnv correlated to 'Time to Death'.
Table 1. Get Full Table Overview of the association between significant copy number variation of 28 focal events and 4 clinical features. Shown in the table are P values (Q values). Thresholded by Q value < 0.25, one significant finding detected.
|
Clinical Features |
Time to Death |
YEARS TO BIRTH |
GENDER | RACE | ||
| nCNV (%) | nWild-Type | logrank test | Wilcoxon-test | Fisher's exact test | Fisher's exact test | |
| del 9p24 2 | 15 (9%) | 147 |
0.00137 (0.154) |
0.919 (1.00) |
0.284 (1.00) |
0.833 (1.00) |
| amp 1q21 3 | 30 (19%) | 132 |
0.0301 (0.843) |
0.631 (1.00) |
0.224 (1.00) |
0.842 (1.00) |
| amp 4q25 | 6 (4%) | 156 |
0.629 (1.00) |
0.706 (1.00) |
0.413 (1.00) |
0.648 (1.00) |
| amp 4q31 1 | 13 (8%) | 149 |
0.387 (1.00) |
0.255 (1.00) |
0.573 (1.00) |
1 (1.00) |
| amp 11p15 2 | 8 (5%) | 154 |
0.619 (1.00) |
0.874 (1.00) |
0.292 (1.00) |
0.0533 (0.976) |
| amp 12q13 3 | 16 (10%) | 146 |
0.438 (1.00) |
0.102 (1.00) |
1 (1.00) |
0.413 (1.00) |
| amp 14q24 3 | 10 (6%) | 152 |
0.178 (1.00) |
0.469 (1.00) |
0.514 (1.00) |
0.0784 (0.976) |
| amp 17q21 31 | 16 (10%) | 146 |
0.226 (1.00) |
0.232 (1.00) |
0.0169 (0.63) |
0.841 (1.00) |
| del 1p12 | 113 (70%) | 49 |
0.814 (1.00) |
0.718 (1.00) |
1 (1.00) |
0.0601 (0.976) |
| del 1q42 13 | 18 (11%) | 144 |
0.511 (1.00) |
0.449 (1.00) |
0.454 (1.00) |
0.722 (1.00) |
| del 3p24 1 | 64 (40%) | 98 |
0.459 (1.00) |
0.197 (1.00) |
0.108 (1.00) |
0.273 (1.00) |
| del 3q26 1 | 93 (57%) | 69 |
0.26 (1.00) |
0.288 (1.00) |
1 (1.00) |
1 (1.00) |
| del 4q28 3 | 10 (6%) | 152 |
0.612 (1.00) |
0.71 (1.00) |
0.514 (1.00) |
0.569 (1.00) |
| del 5q15 | 12 (7%) | 150 |
0.543 (1.00) |
0.428 (1.00) |
0.772 (1.00) |
0.312 (1.00) |
| del 6p12 3 | 10 (6%) | 152 |
0.453 (1.00) |
0.733 (1.00) |
0.112 (1.00) |
0.517 (1.00) |
| del 6q16 1 | 24 (15%) | 138 |
0.973 (1.00) |
0.459 (1.00) |
0.267 (1.00) |
1 (1.00) |
| del 8p22 | 25 (15%) | 137 |
0.345 (1.00) |
0.149 (1.00) |
0.383 (1.00) |
0.819 (1.00) |
| del 8q23 3 | 13 (8%) | 149 |
0.338 (1.00) |
0.583 (1.00) |
0.773 (1.00) |
1 (1.00) |
| del 9q21 12 | 14 (9%) | 148 |
0.653 (1.00) |
0.594 (1.00) |
1 (1.00) |
0.821 (1.00) |
| del 11p15 4 | 58 (36%) | 104 |
0.0781 (0.976) |
0.218 (1.00) |
0.417 (1.00) |
0.955 (1.00) |
| del 11q22 1 | 48 (30%) | 114 |
0.727 (1.00) |
0.269 (1.00) |
0.863 (1.00) |
0.808 (1.00) |
| del 12q21 33 | 8 (5%) | 154 |
0.492 (1.00) |
0.754 (1.00) |
0.728 (1.00) |
1 (1.00) |
| del 13q22 3 | 8 (5%) | 154 |
0.61 (1.00) |
0.923 (1.00) |
1 (1.00) |
0.236 (1.00) |
| del 16q21 | 5 (3%) | 157 |
0.669 (1.00) |
0.397 (1.00) |
1 (1.00) |
0.581 (1.00) |
| del 17p13 2 | 64 (40%) | 98 |
0.966 (1.00) |
0.956 (1.00) |
0.63 (1.00) |
0.196 (1.00) |
| del 17q11 2 | 42 (26%) | 120 |
0.0671 (0.976) |
0.481 (1.00) |
0.721 (1.00) |
0.154 (1.00) |
| del 22q13 31 | 65 (40%) | 97 |
0.0117 (0.63) |
0.237 (1.00) |
0.873 (1.00) |
0.375 (1.00) |
| del xp21 1 | 46 (28%) | 116 |
0.627 (1.00) |
0.879 (1.00) |
1 (1.00) |
0.503 (1.00) |
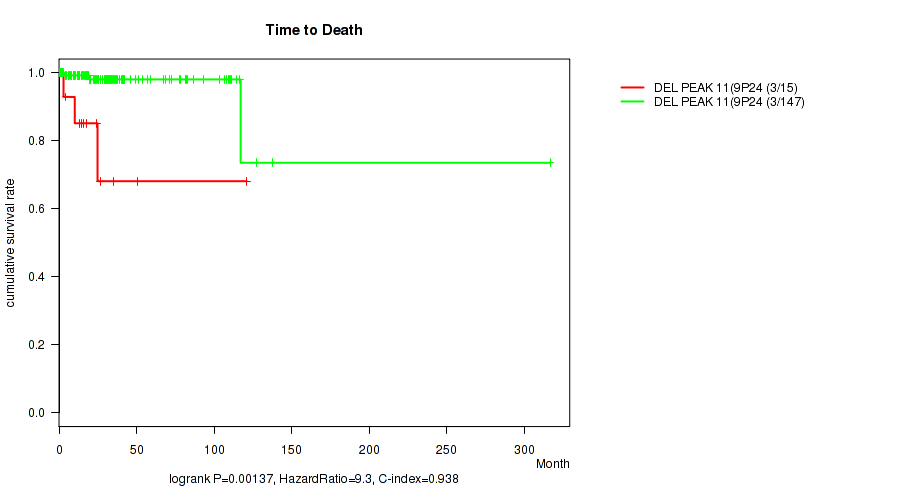
P value = 0.00137 (logrank test), Q value = 0.15
Table S1. Gene #18: 'del_9p24.2' versus Clinical Feature #1: 'Time to Death'
| nPatients | nDeath | Duration Range (Median), Month | |
|---|---|---|---|
| ALL | 162 | 6 | 0.1 - 316.7 (21.4) |
| DEL PEAK 11(9P24.2) MUTATED | 15 | 3 | 1.6 - 121.0 (15.5) |
| DEL PEAK 11(9P24.2) WILD-TYPE | 147 | 3 | 0.1 - 316.7 (23.1) |
Figure S1. Get High-res Image Gene #18: 'del_9p24.2' versus Clinical Feature #1: 'Time to Death'
-
Copy number data file = all_lesions.txt from GISTIC pipeline
-
Processed Copy number data file = /xchip/cga/gdac-prod/tcga-gdac/jobResults/GDAC_Correlate_Genomic_Events_Preprocess/PCPG-TP/15096462/transformed.cor.cli.txt
-
Clinical data file = /xchip/cga/gdac-prod/tcga-gdac/jobResults/Append_Data/PCPG-TP/15087180/PCPG-TP.merged_data.txt
-
Number of patients = 162
-
Number of significantly focal cnvs = 28
-
Number of selected clinical features = 4
-
Exclude genes that fewer than K tumors have mutations, K = 3
For survival clinical features, the Kaplan-Meier survival curves of tumors with and without gene mutations were plotted and the statistical significance P values were estimated by logrank test (Bland and Altman 2004) using the 'survdiff' function in R
For binary or multi-class clinical features (nominal or ordinal), two-tailed Fisher's exact tests (Fisher 1922) were used to estimate the P values using the 'fisher.test' function in R
For multiple hypothesis correction, Q value is the False Discovery Rate (FDR) analogue of the P value (Benjamini and Hochberg 1995), defined as the minimum FDR at which the test may be called significant. We used the 'Benjamini and Hochberg' method of 'p.adjust' function in R to convert P values into Q values.
In addition to the links below, the full results of the analysis summarized in this report can also be downloaded programmatically using firehose_get, or interactively from either the Broad GDAC website or TCGA Data Coordination Center Portal.