This pipeline computes the correlation between significantly recurrent gene mutations and selected clinical features.
Testing the association between mutation status of 9 genes and 5 clinical features across 178 patients, 2 significant findings detected with Q value < 0.25.
-
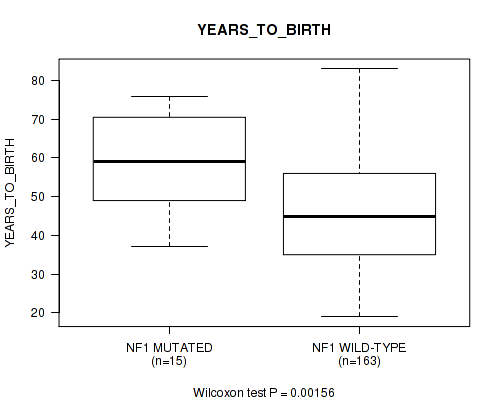
NF1 mutation correlated to 'YEARS_TO_BIRTH'.
-
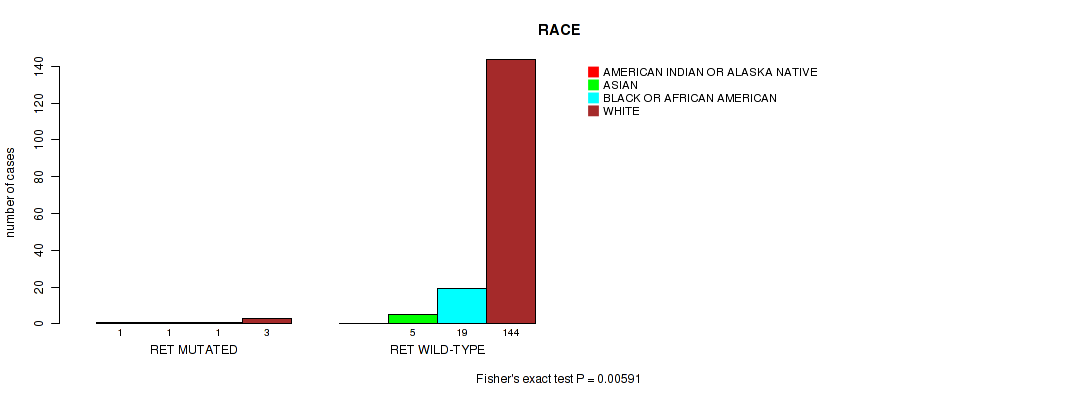
RET mutation correlated to 'RACE'.
Table 1. Get Full Table Overview of the association between mutation status of 9 genes and 5 clinical features. Shown in the table are P values (Q values). Thresholded by Q value < 0.25, 2 significant findings detected.
|
Clinical Features |
Time to Death |
YEARS TO BIRTH |
GENDER | RACE | ETHNICITY | ||
| nMutated (%) | nWild-Type | logrank test | Wilcoxon-test | Fisher's exact test | Fisher's exact test | Fisher's exact test | |
| NF1 | 15 (8%) | 163 |
0.592 (1.00) |
0.00156 (0.0701) |
1 (1.00) |
0.383 (1.00) |
0.283 (1.00) |
| RET | 6 (3%) | 172 |
0.701 (1.00) |
0.441 (1.00) |
0.7 (1.00) |
0.00591 (0.133) |
1 (1.00) |
| HRAS | 18 (10%) | 160 |
0.452 (1.00) |
0.157 (1.00) |
0.804 (1.00) |
0.0984 (1.00) |
1 (1.00) |
| EPAS1 | 8 (4%) | 170 |
0.482 (1.00) |
0.966 (1.00) |
0.469 (1.00) |
0.153 (1.00) |
1 (1.00) |
| CSDE1 | 4 (2%) | 174 |
0.714 (1.00) |
0.136 (1.00) |
0.317 (1.00) |
1 (1.00) |
1 (1.00) |
| GPR128 | 4 (2%) | 174 |
0.716 (1.00) |
0.891 (1.00) |
0.635 (1.00) |
0.494 (1.00) |
1 (1.00) |
| AMMECR1 | 3 (2%) | 175 |
0.799 (1.00) |
0.296 (1.00) |
1 (1.00) |
0.401 (1.00) |
1 (1.00) |
| SHROOM4 | 3 (2%) | 175 |
0.749 (1.00) |
0.233 (1.00) |
0.579 (1.00) |
1 (1.00) |
0.0694 (1.00) |
| FAM83D | 3 (2%) | 175 |
0.871 (1.00) |
0.786 (1.00) |
0.579 (1.00) |
1 (1.00) |
P value = 0.00156 (Wilcoxon-test), Q value = 0.07
Table S1. Gene #3: 'NF1 MUTATION STATUS' versus Clinical Feature #2: 'YEARS_TO_BIRTH'
| nPatients | Mean (Std.Dev) | |
|---|---|---|
| ALL | 178 | 47.2 (15.1) |
| NF1 MUTATED | 15 | 59.4 (13.4) |
| NF1 WILD-TYPE | 163 | 46.1 (14.8) |
Figure S1. Get High-res Image Gene #3: 'NF1 MUTATION STATUS' versus Clinical Feature #2: 'YEARS_TO_BIRTH'
P value = 0.00591 (Fisher's exact test), Q value = 0.13
Table S2. Gene #4: 'RET MUTATION STATUS' versus Clinical Feature #4: 'RACE'
| nPatients | AMERICAN INDIAN OR ALASKA NATIVE | ASIAN | BLACK OR AFRICAN AMERICAN | WHITE |
|---|---|---|---|---|
| ALL | 1 | 6 | 20 | 147 |
| RET MUTATED | 1 | 1 | 1 | 3 |
| RET WILD-TYPE | 0 | 5 | 19 | 144 |
Figure S2. Get High-res Image Gene #4: 'RET MUTATION STATUS' versus Clinical Feature #4: 'RACE'
-
Mutation data file = sample_sig_gene_table.txt from Mutsig_2CV pipeline
-
Processed Mutation data file = /xchip/cga/gdac-prod/tcga-gdac/jobResults/GDAC_Correlate_Genomic_Events_Preprocess/PCPG-TP/15165019/transformed.cor.cli.txt
-
Clinical data file = /xchip/cga/gdac-prod/tcga-gdac/jobResults/Append_Data/PCPG-TP/15087180/PCPG-TP.merged_data.txt
-
Number of patients = 178
-
Number of significantly mutated genes = 9
-
Number of selected clinical features = 5
-
Exclude genes that fewer than K tumors have mutations, K = 3
For survival clinical features, the Kaplan-Meier survival curves of tumors with and without gene mutations were plotted and the statistical significance P values were estimated by logrank test (Bland and Altman 2004) using the 'survdiff' function in R
For binary or multi-class clinical features (nominal or ordinal), two-tailed Fisher's exact tests (Fisher 1922) were used to estimate the P values using the 'fisher.test' function in R
For multiple hypothesis correction, Q value is the False Discovery Rate (FDR) analogue of the P value (Benjamini and Hochberg 1995), defined as the minimum FDR at which the test may be called significant. We used the 'Benjamini and Hochberg' method of 'p.adjust' function in R to convert P values into Q values.
In addition to the links below, the full results of the analysis summarized in this report can also be downloaded programmatically using firehose_get, or interactively from either the Broad GDAC website or TCGA Data Coordination Center Portal.