This pipeline computes the correlation between significant arm-level copy number variations (cnvs) and molecular subtypes.
Testing the association between copy number variation 80 arm-level events and 12 molecular subtypes across 165 patients, 54 significant findings detected with P value < 0.05 and Q value < 0.25.
-
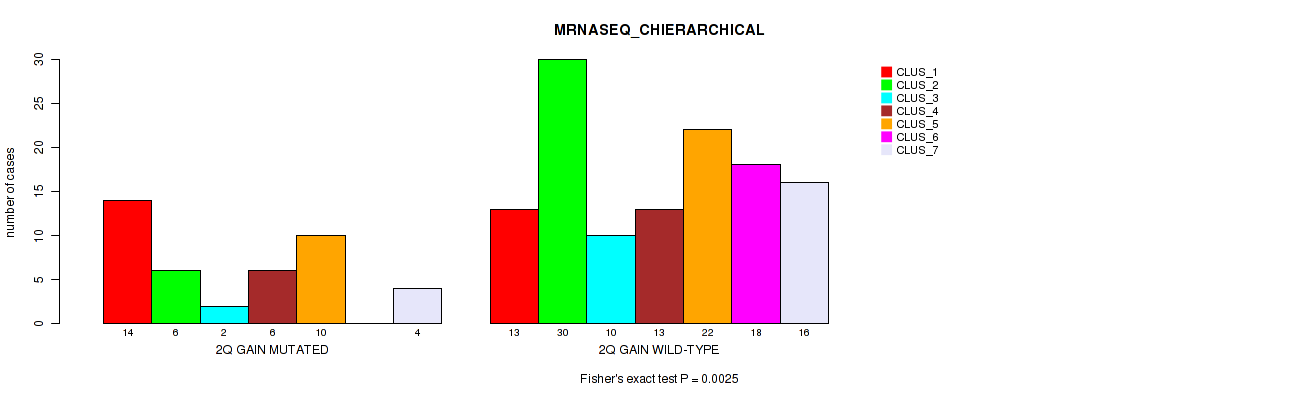
2q gain cnv correlated to 'MRNASEQ_CHIERARCHICAL'.
-
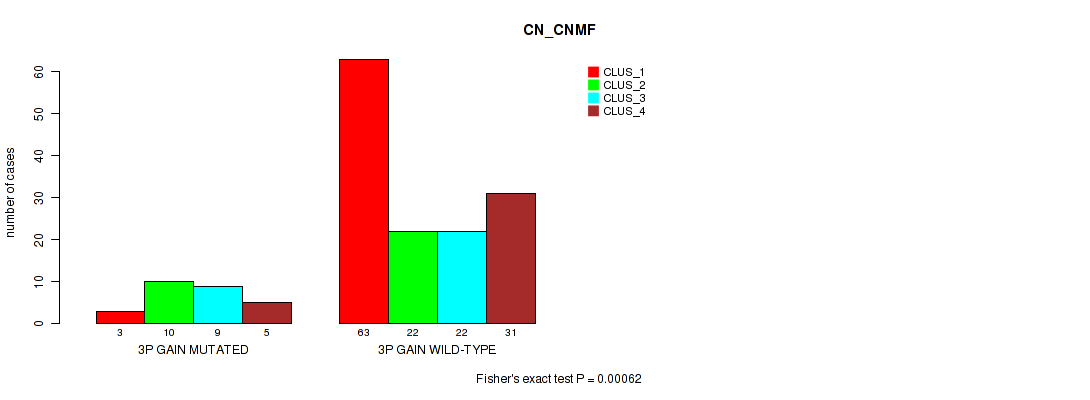
3p gain cnv correlated to 'CN_CNMF'.
-
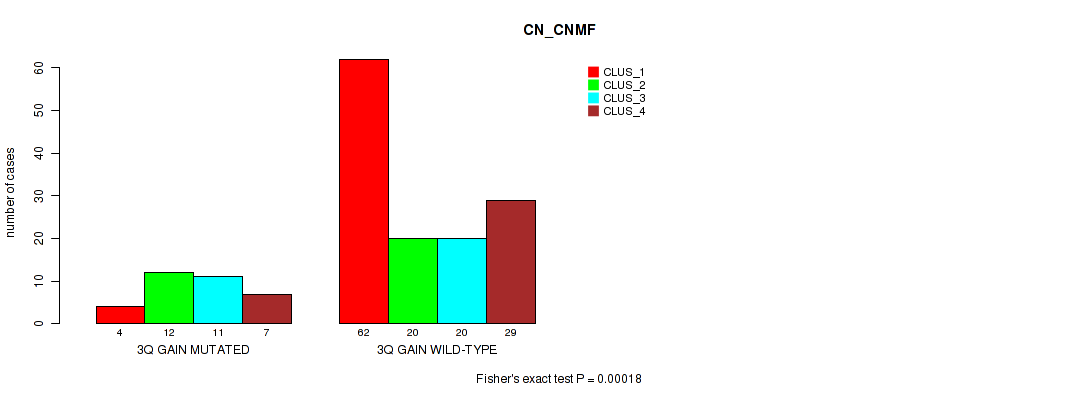
3q gain cnv correlated to 'CN_CNMF'.
-
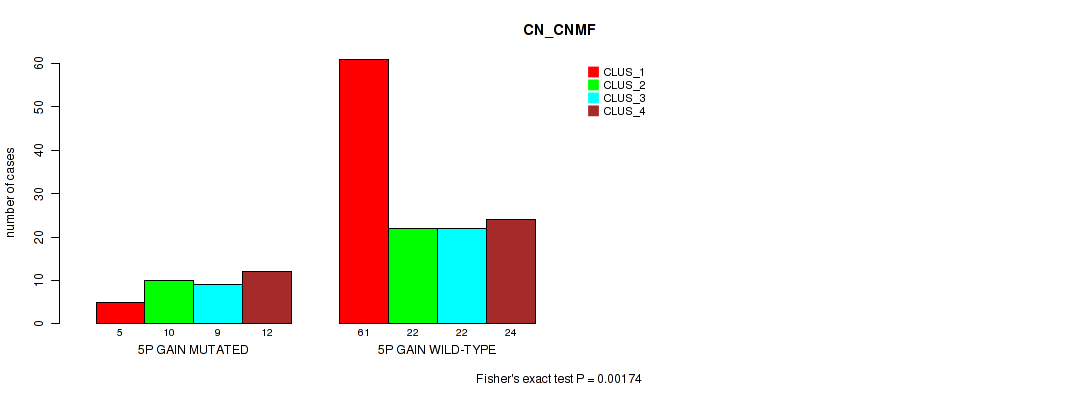
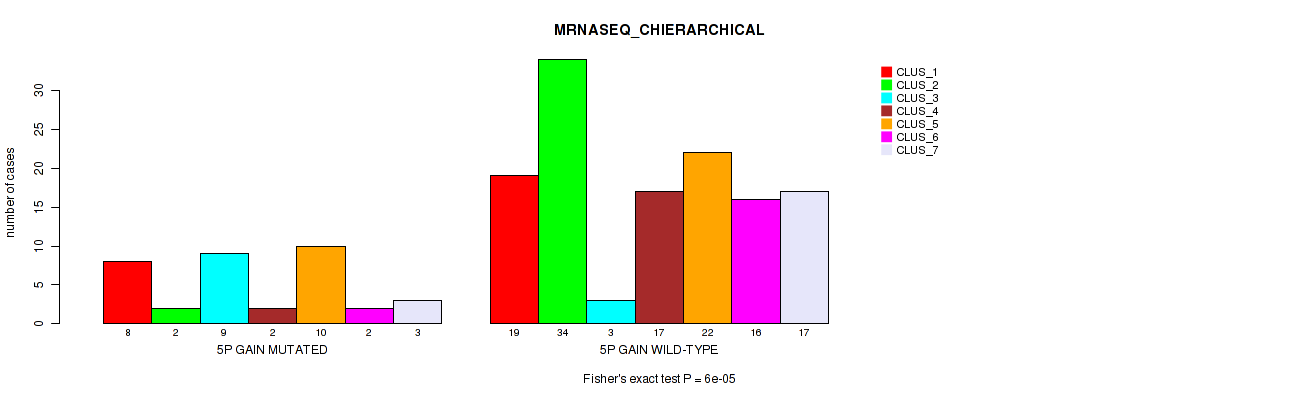
5p gain cnv correlated to 'CN_CNMF' and 'MRNASEQ_CHIERARCHICAL'.
-
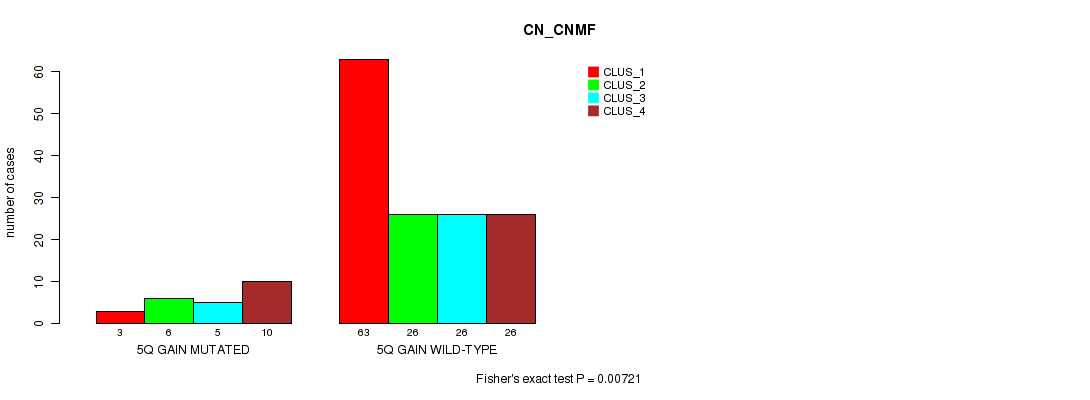
5q gain cnv correlated to 'CN_CNMF'.
-
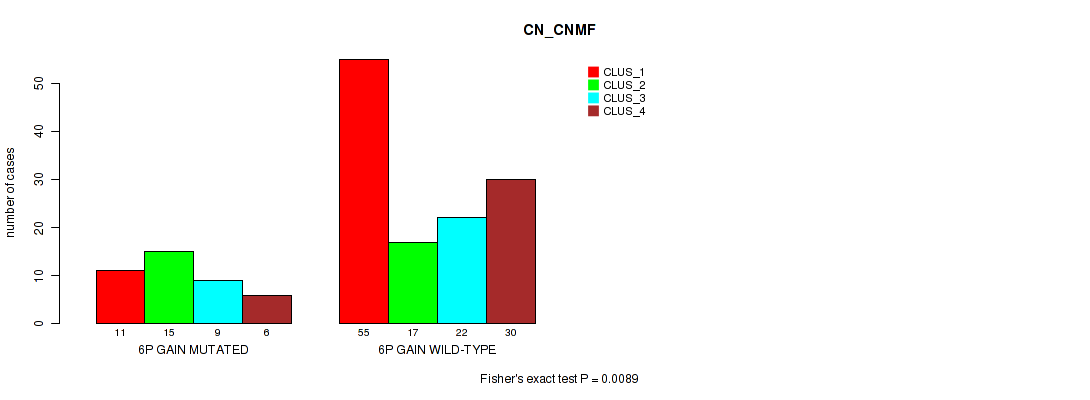
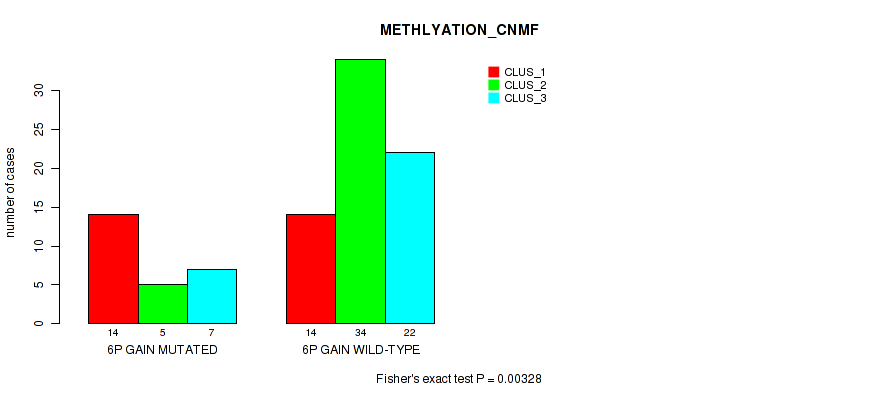
6p gain cnv correlated to 'CN_CNMF' and 'METHLYATION_CNMF'.
-
6q gain cnv correlated to 'METHLYATION_CNMF'.
-
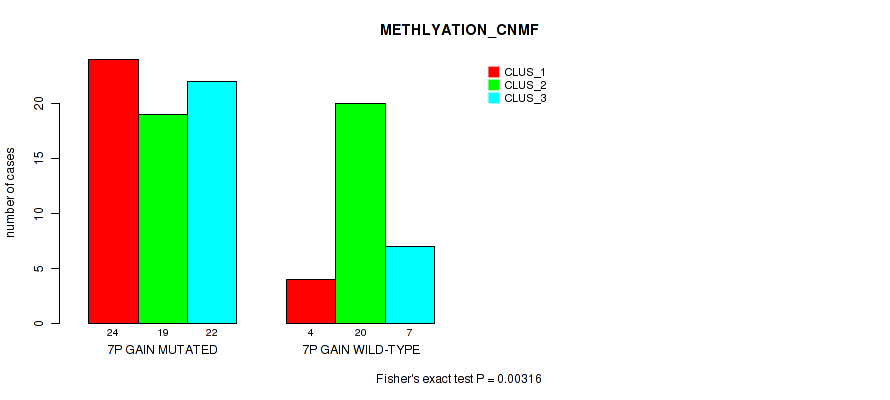
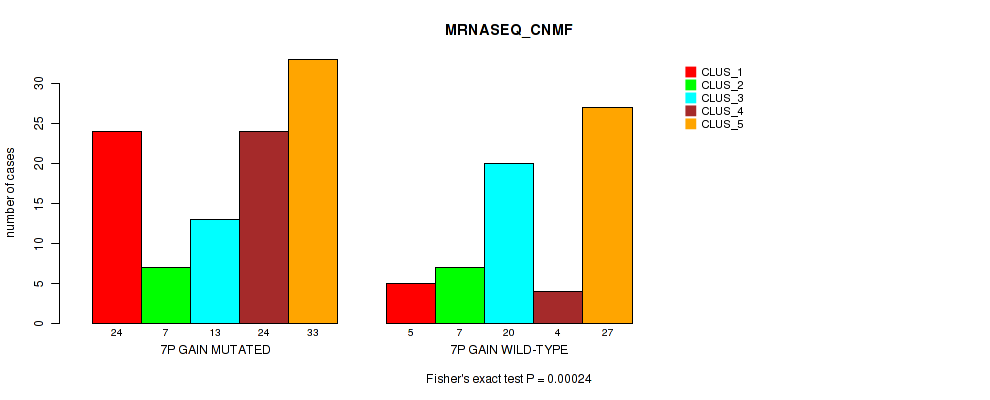
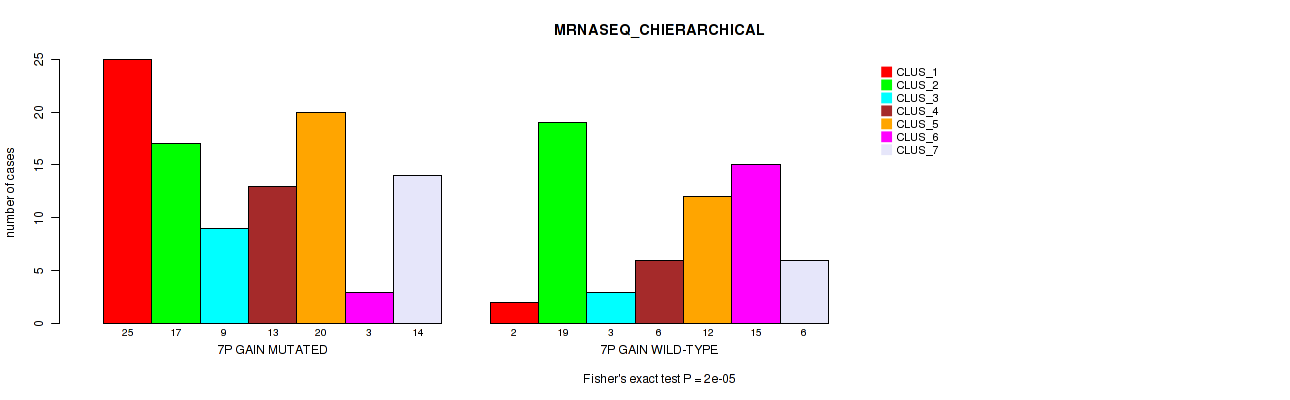
7p gain cnv correlated to 'MRNA_CNMF', 'MRNA_CHIERARCHICAL', 'CN_CNMF', 'METHLYATION_CNMF', 'MRNASEQ_CNMF', and 'MRNASEQ_CHIERARCHICAL'.
-
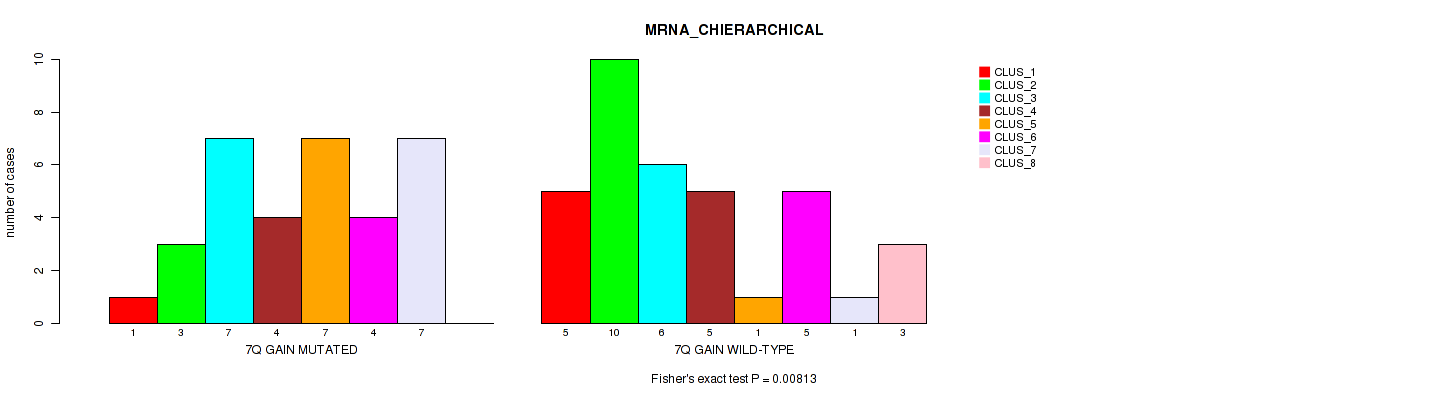
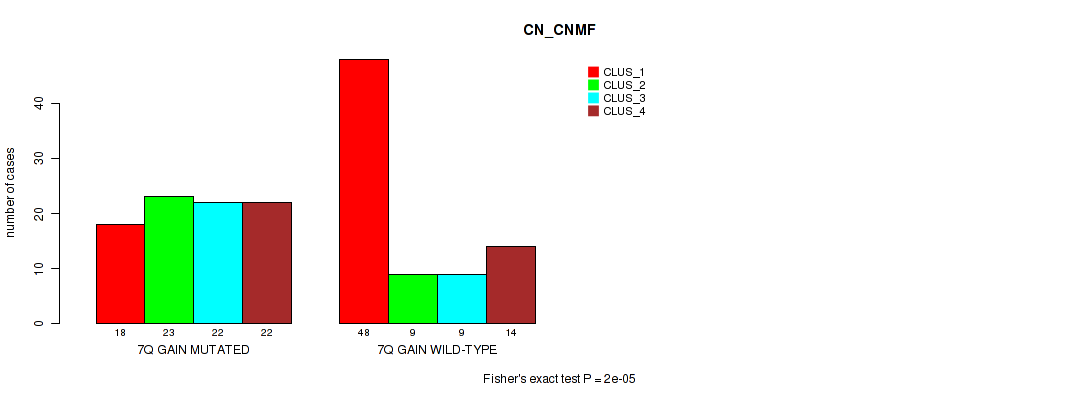
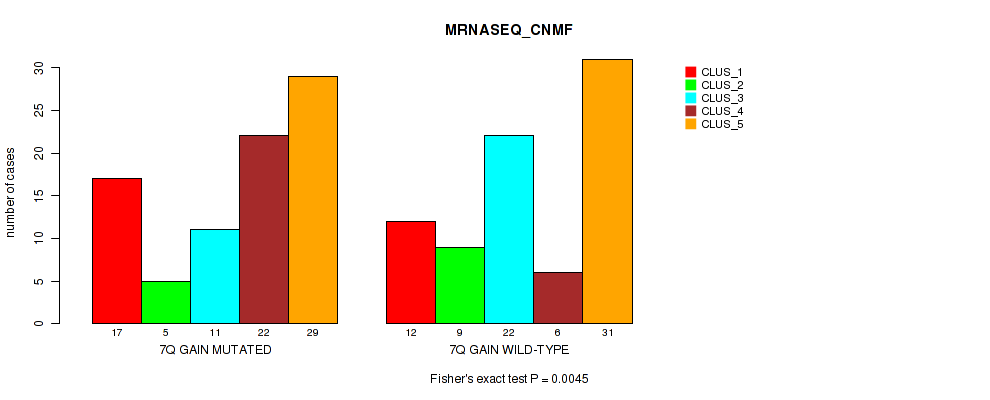
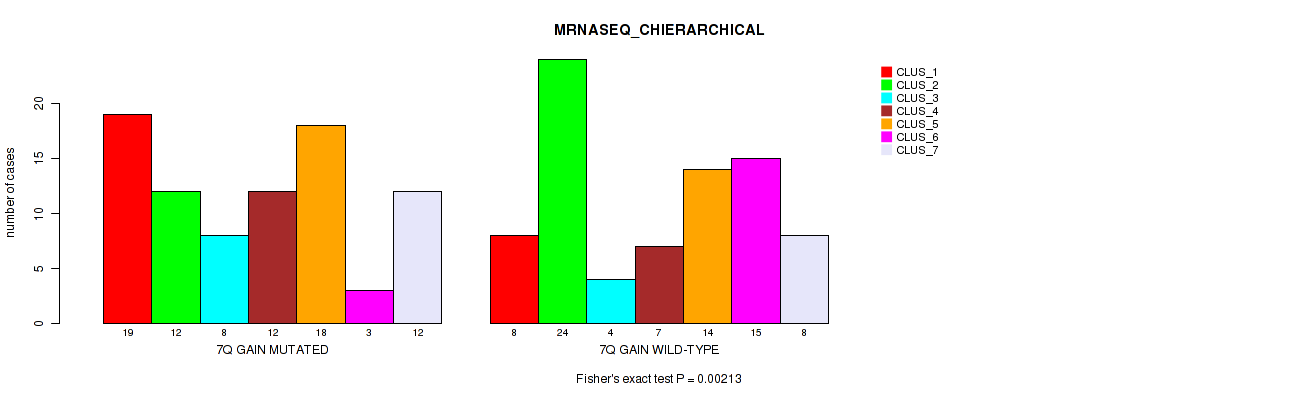
7q gain cnv correlated to 'MRNA_CHIERARCHICAL', 'CN_CNMF', 'MRNASEQ_CNMF', and 'MRNASEQ_CHIERARCHICAL'.
-
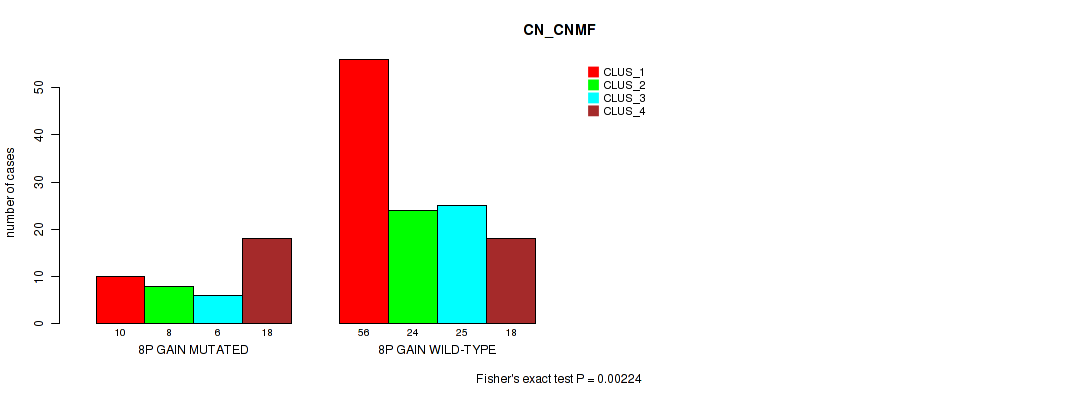
8p gain cnv correlated to 'CN_CNMF'.
-
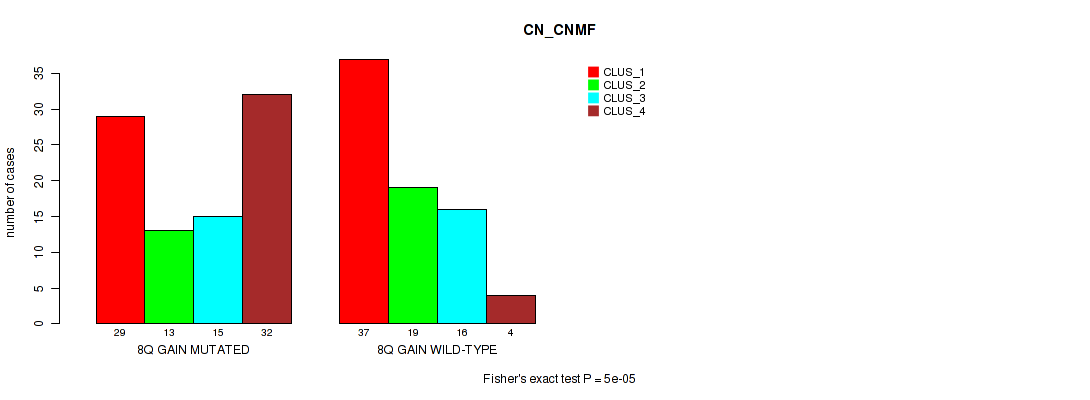
8q gain cnv correlated to 'CN_CNMF'.
-
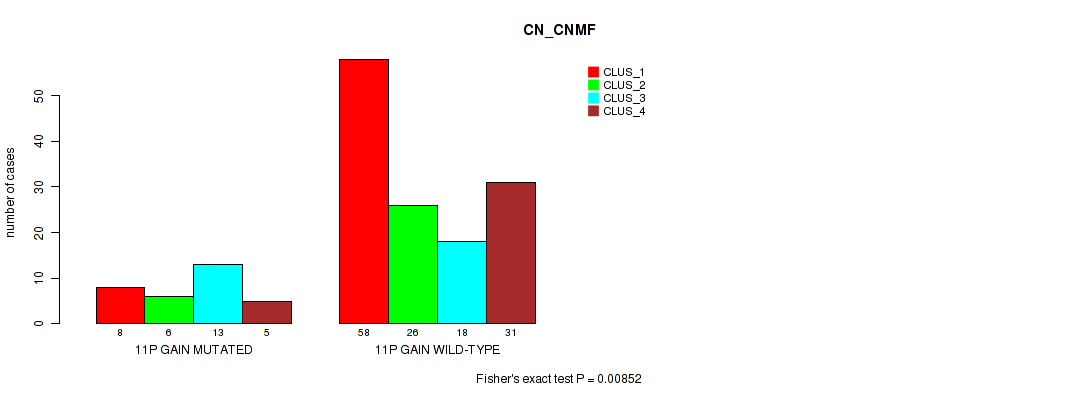
11p gain cnv correlated to 'CN_CNMF'.
-
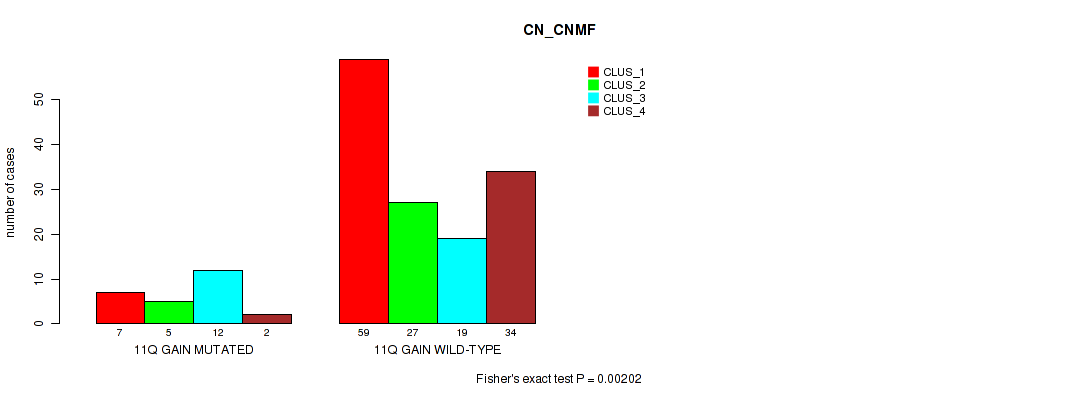
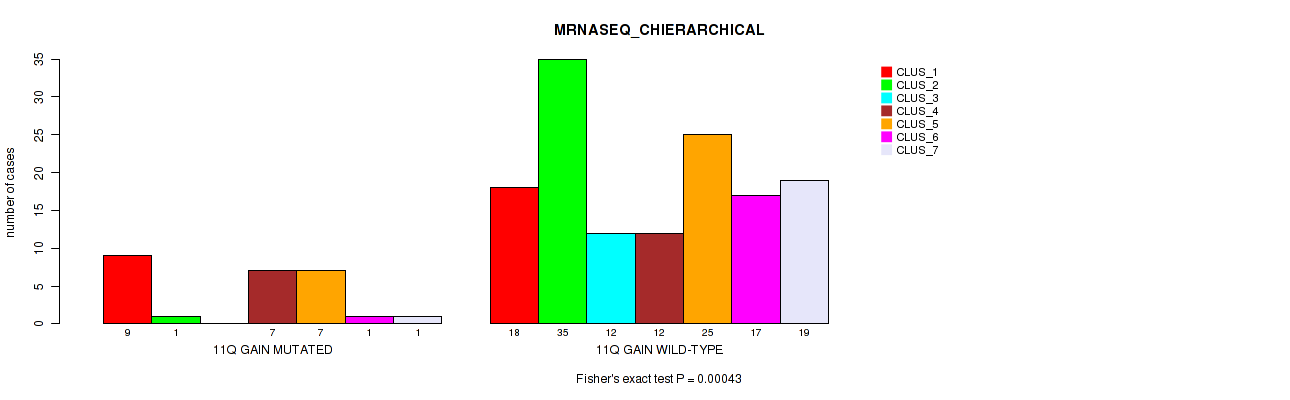
11q gain cnv correlated to 'CN_CNMF', 'MRNASEQ_CNMF', and 'MRNASEQ_CHIERARCHICAL'.
-
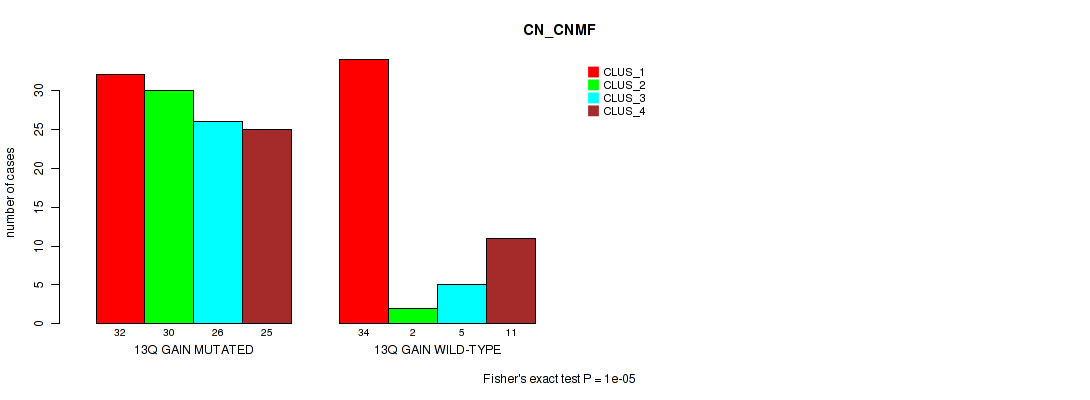
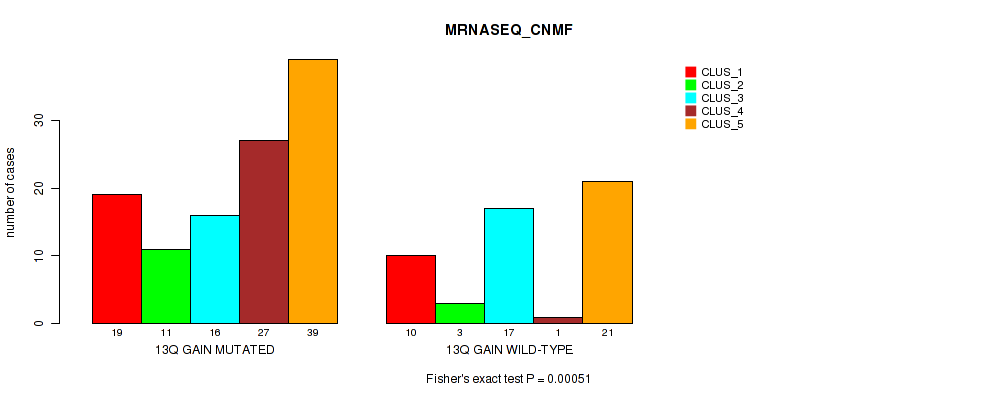
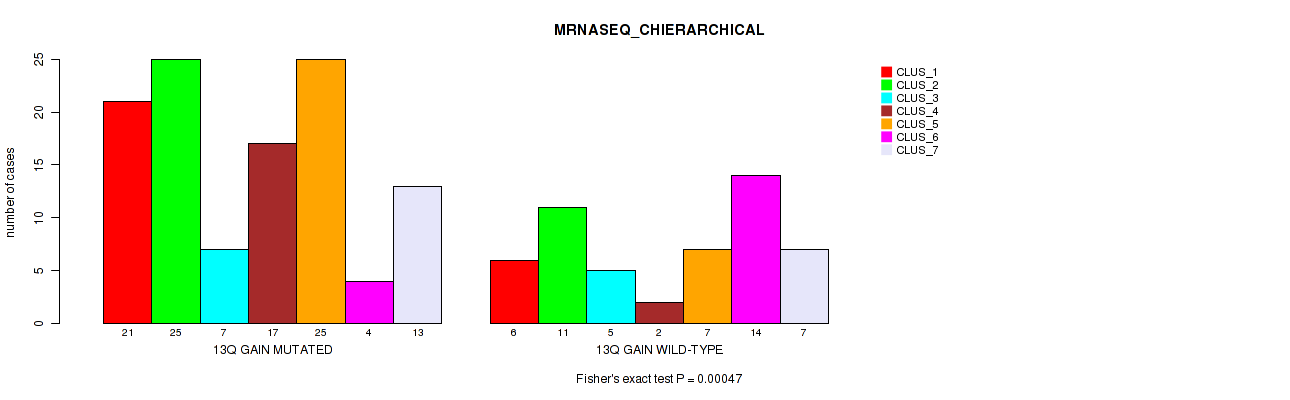
13q gain cnv correlated to 'CN_CNMF', 'MRNASEQ_CNMF', 'MRNASEQ_CHIERARCHICAL', and 'MIRSEQ_CNMF'.
-
16p gain cnv correlated to 'CN_CNMF'.
-
16q gain cnv correlated to 'CN_CNMF' and 'MRNASEQ_CNMF'.
-
17q gain cnv correlated to 'CN_CNMF'.
-
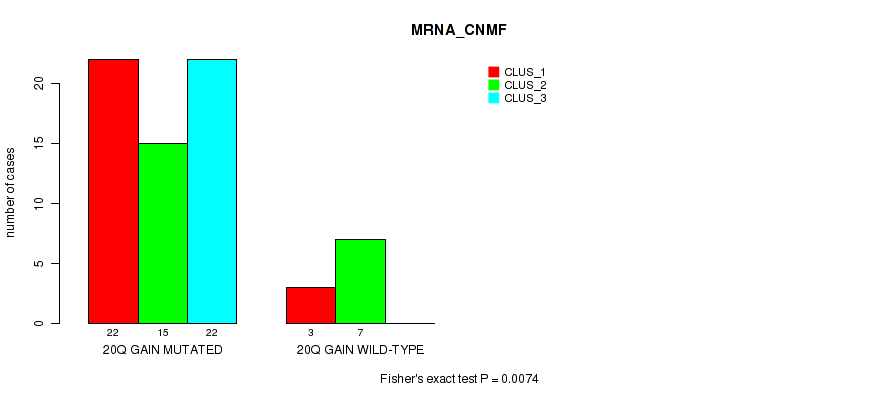
20q gain cnv correlated to 'MRNA_CNMF', 'CN_CNMF', and 'MRNASEQ_CHIERARCHICAL'.
-
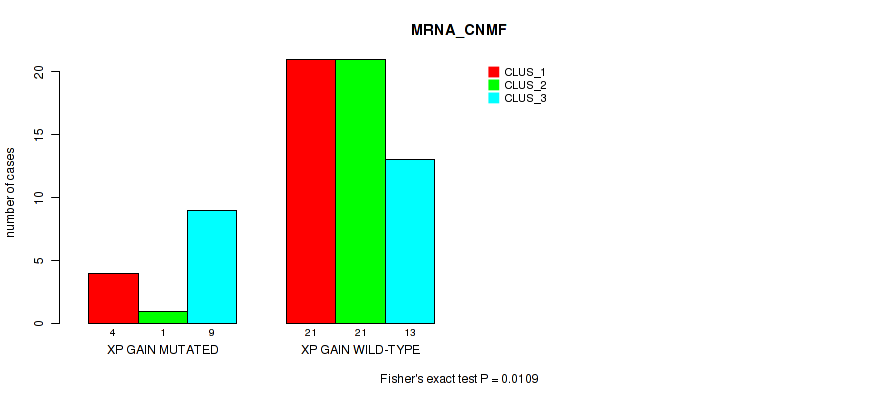
xp gain cnv correlated to 'MRNA_CNMF'.
-
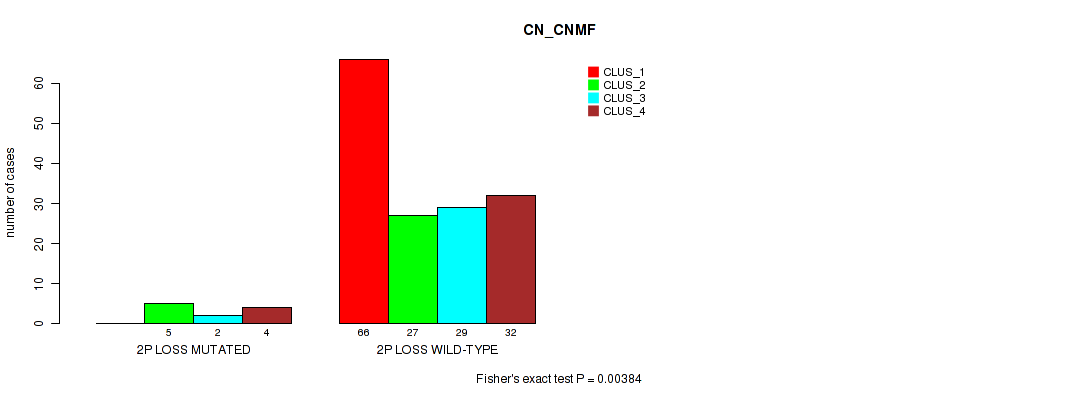
2p loss cnv correlated to 'CN_CNMF'.
-
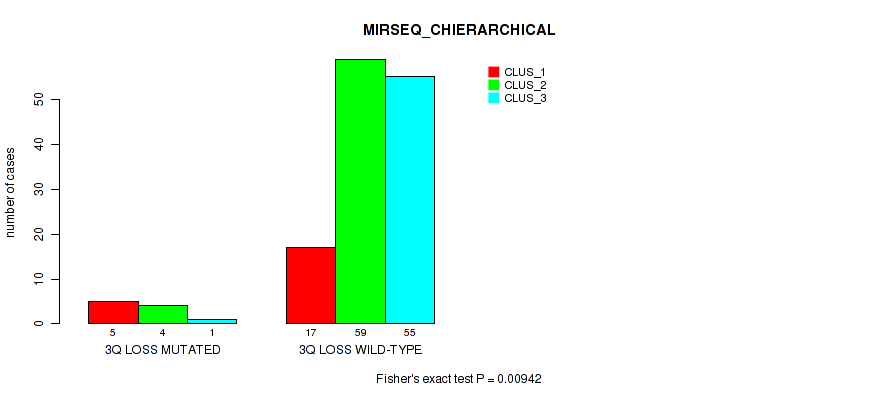
3q loss cnv correlated to 'MIRSEQ_CHIERARCHICAL'.
-
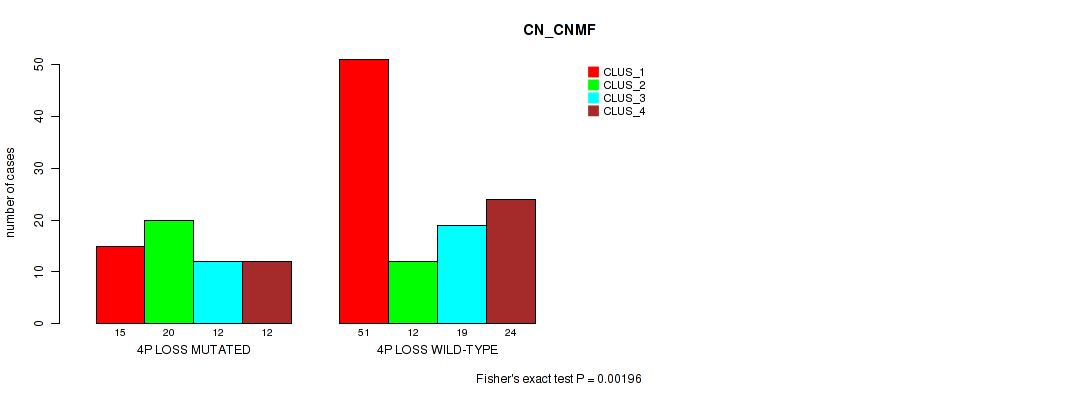
4p loss cnv correlated to 'CN_CNMF'.
-
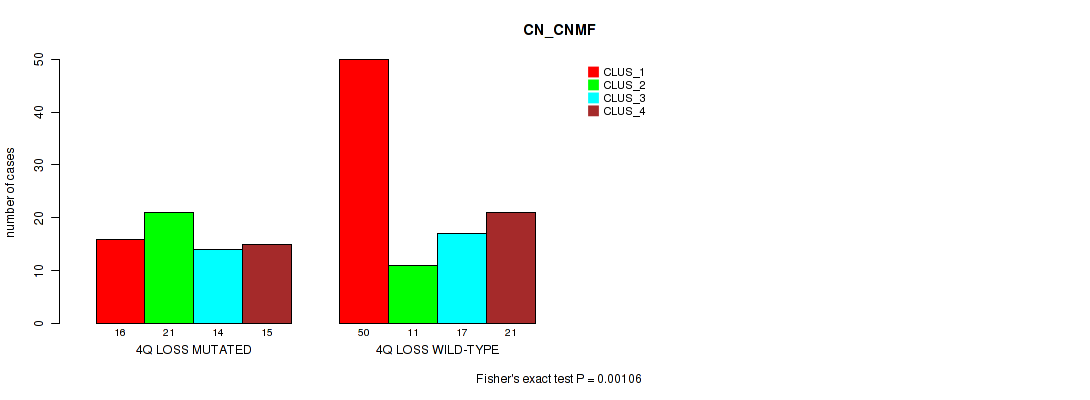
4q loss cnv correlated to 'CN_CNMF'.
-
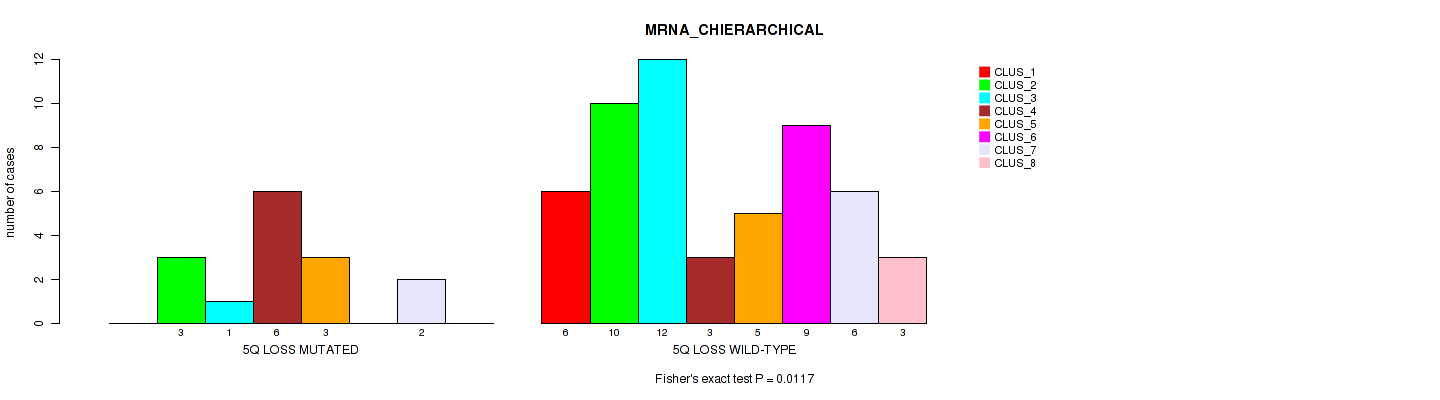
5q loss cnv correlated to 'MRNA_CHIERARCHICAL'.
-
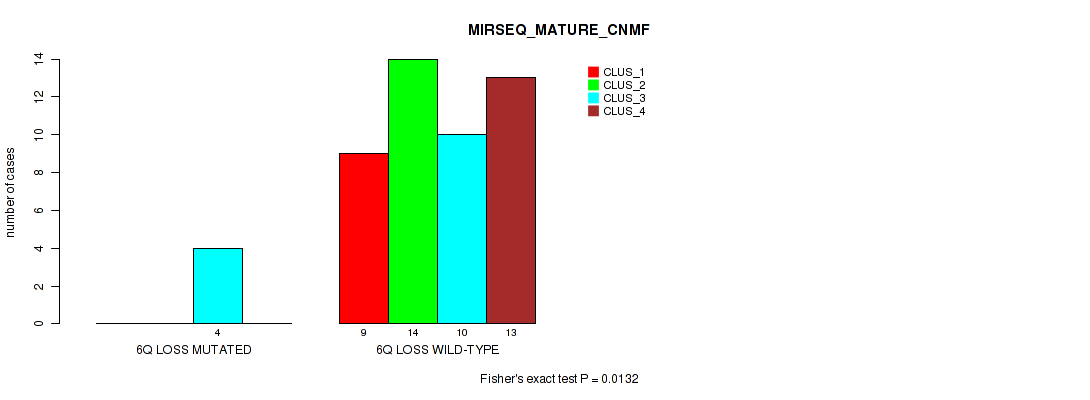
6q loss cnv correlated to 'MIRSEQ_MATURE_CNMF'.
-
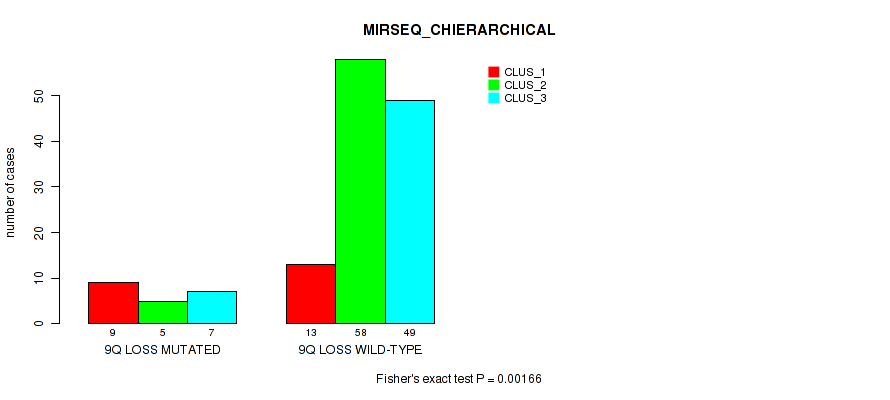
9q loss cnv correlated to 'MIRSEQ_CHIERARCHICAL'.
-
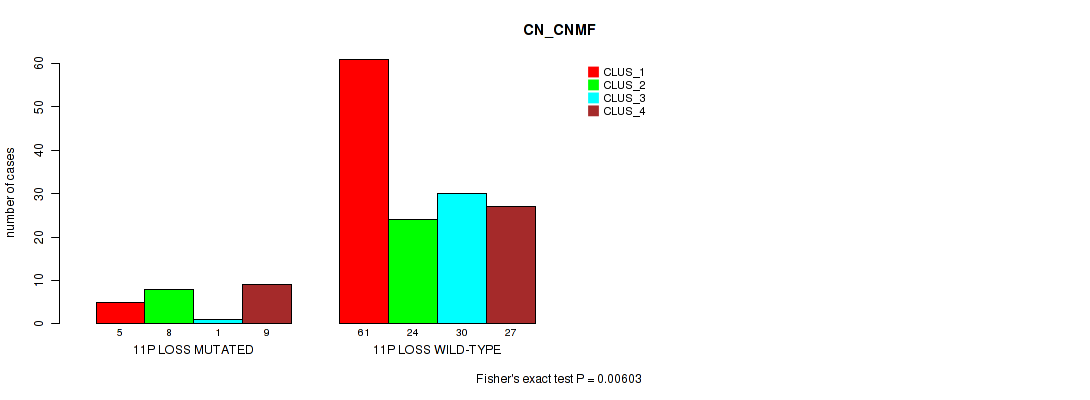
11p loss cnv correlated to 'CN_CNMF'.
-
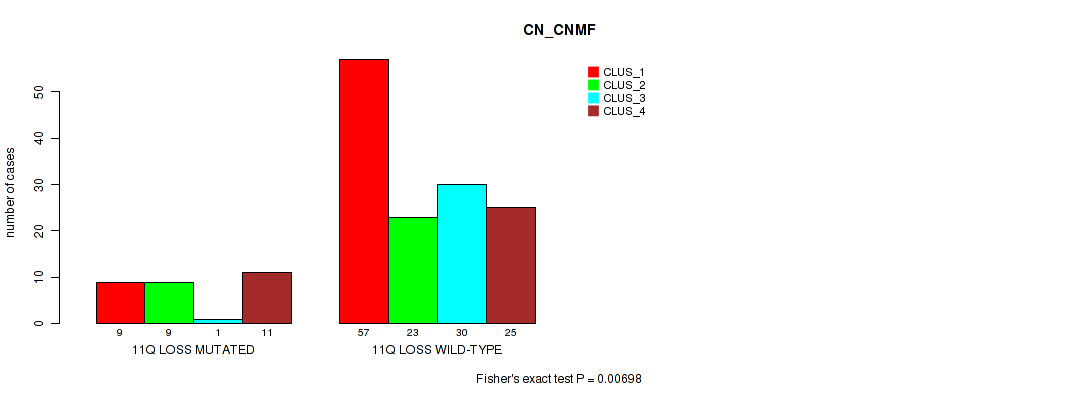
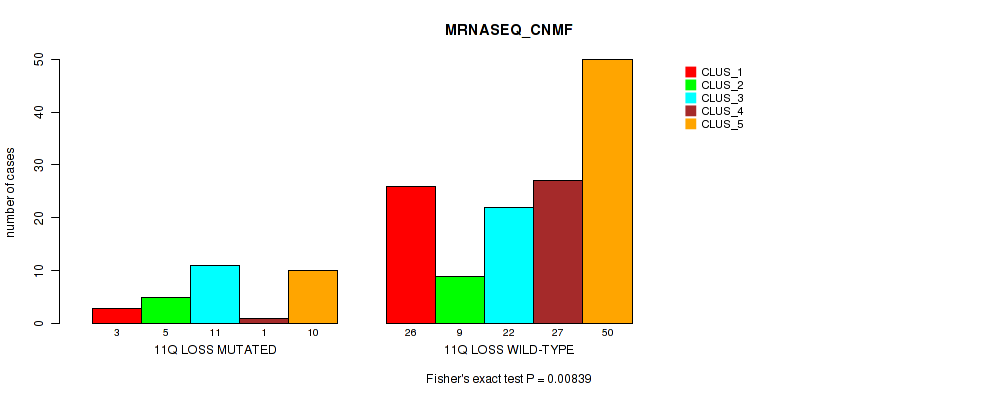
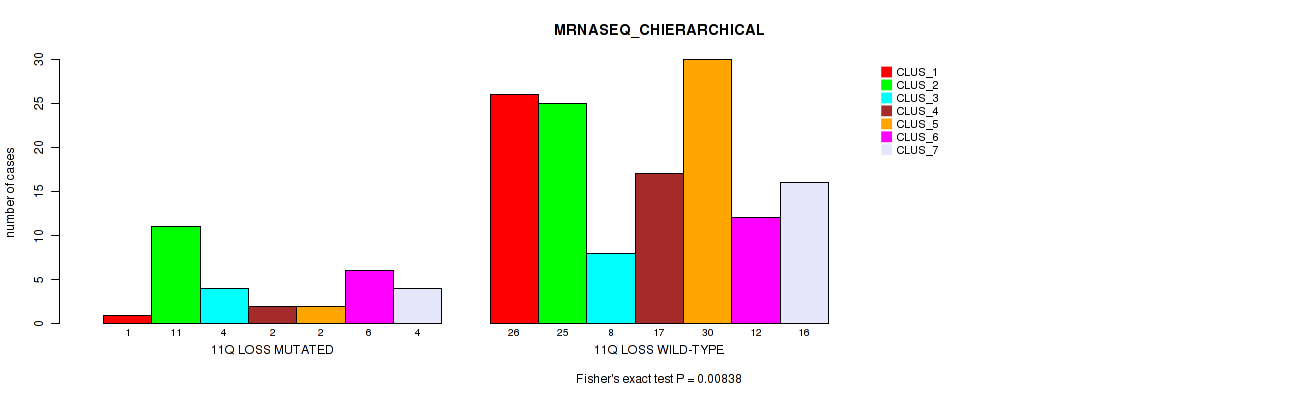
11q loss cnv correlated to 'CN_CNMF', 'MRNASEQ_CNMF', and 'MRNASEQ_CHIERARCHICAL'.
-
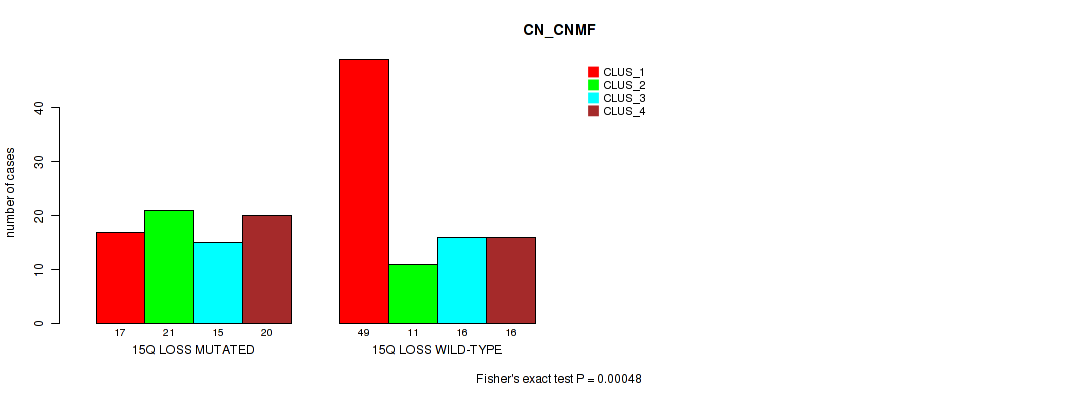
15q loss cnv correlated to 'CN_CNMF'.
-
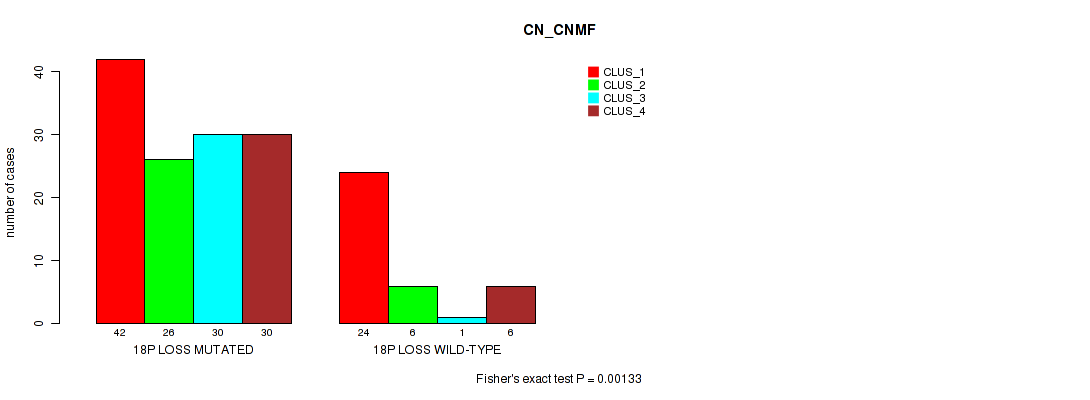
18p loss cnv correlated to 'CN_CNMF'.
-
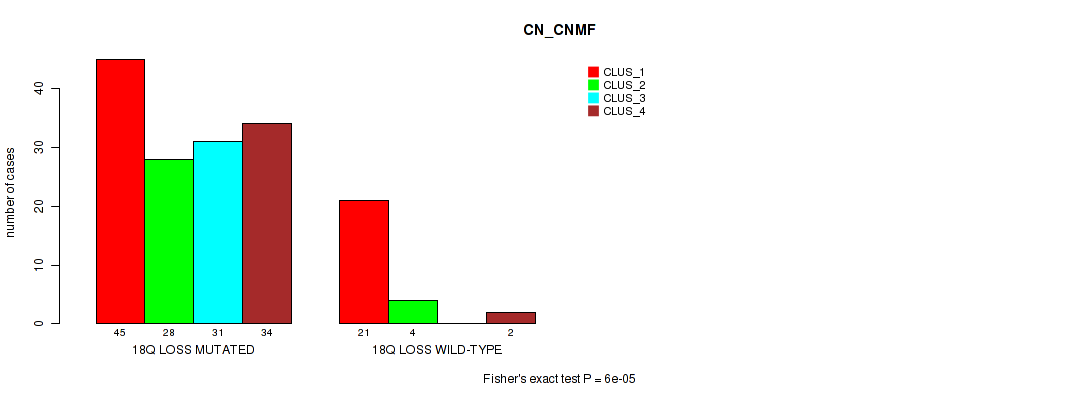
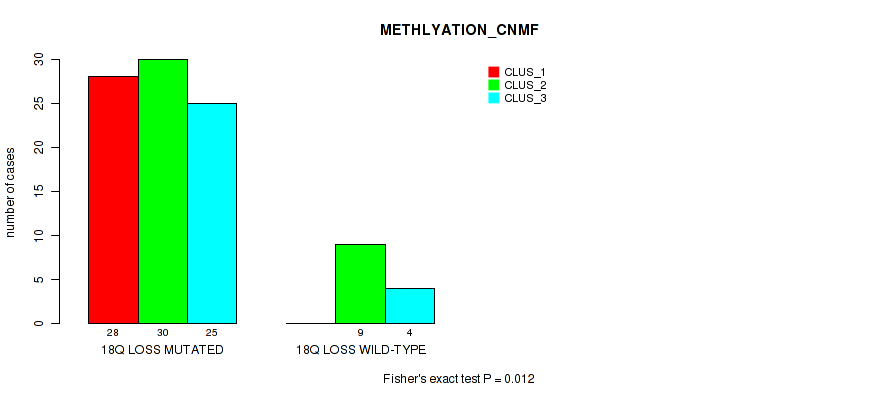
18q loss cnv correlated to 'CN_CNMF' and 'METHLYATION_CNMF'.
-
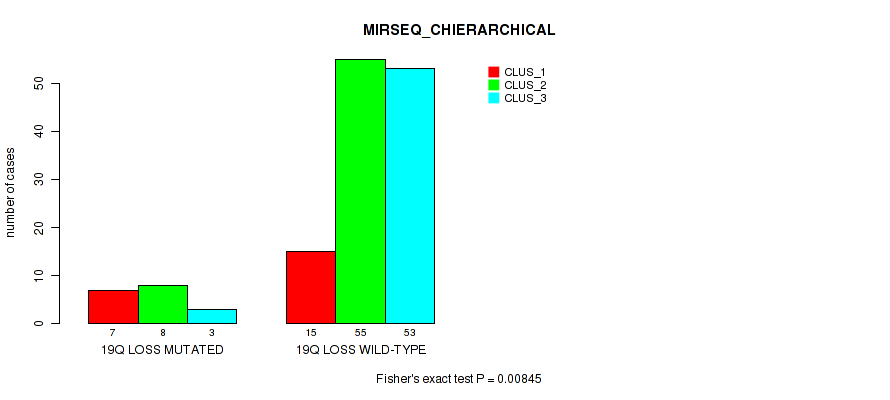
19q loss cnv correlated to 'MIRSEQ_CHIERARCHICAL'.
-
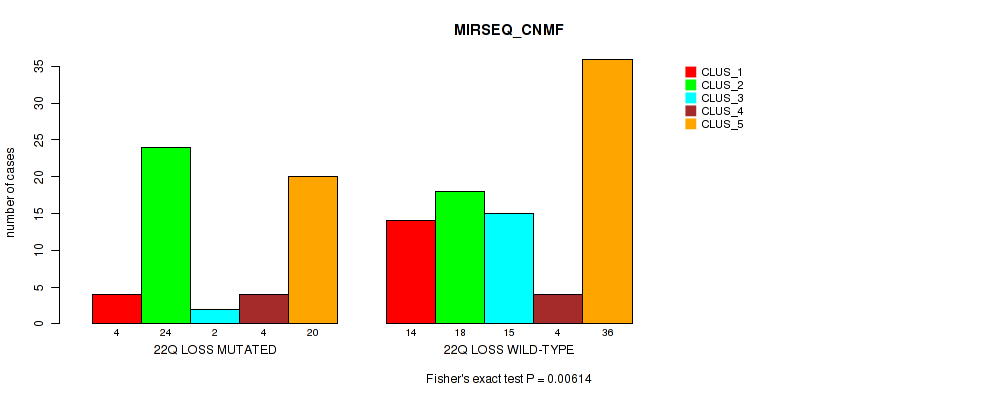
22q loss cnv correlated to 'MIRSEQ_CNMF'.
Table 1. Get Full Table Overview of the association between significant copy number variation of 80 arm-level events and 12 molecular subtypes. Shown in the table are P values (Q values). Thresholded by P value < 0.05 and Q value < 0.25, 54 significant findings detected.
|
Clinical Features |
MRNA CNMF |
MRNA CHIERARCHICAL |
CN CNMF |
METHLYATION CNMF |
RPPA CNMF |
RPPA CHIERARCHICAL |
MRNASEQ CNMF |
MRNASEQ CHIERARCHICAL |
MIRSEQ CNMF |
MIRSEQ CHIERARCHICAL |
MIRSEQ MATURE CNMF |
MIRSEQ MATURE CHIERARCHICAL |
||
| nCNV (%) | nWild-Type | Fisher's exact test | Fisher's exact test | Fisher's exact test | Fisher's exact test | Fisher's exact test | Fisher's exact test | Fisher's exact test | Fisher's exact test | Fisher's exact test | Fisher's exact test | Fisher's exact test | Fisher's exact test | |
| 7p gain | 102 (62%) | 63 |
0.00229 (0.0828) |
0.00261 (0.0835) |
1e-05 (0.0048) |
0.00316 (0.0979) |
0.486 (0.899) |
0.376 (0.826) |
0.00024 (0.023) |
2e-05 (0.0048) |
0.0415 (0.419) |
0.0979 (0.556) |
0.594 (0.929) |
0.814 (1.00) |
| 7q gain | 85 (52%) | 80 |
0.046 (0.439) |
0.00813 (0.174) |
2e-05 (0.0048) |
0.14 (0.619) |
0.619 (0.941) |
0.948 (1.00) |
0.0045 (0.123) |
0.00213 (0.0828) |
0.501 (0.899) |
0.827 (1.00) |
0.856 (1.00) |
0.856 (1.00) |
| 13q gain | 113 (68%) | 52 |
0.285 (0.749) |
0.376 (0.826) |
1e-05 (0.0048) |
0.0713 (0.5) |
0.836 (1.00) |
0.317 (0.777) |
0.00051 (0.035) |
0.00047 (0.035) |
0.00351 (0.102) |
0.066 (0.494) |
0.711 (0.984) |
0.476 (0.897) |
| 11q gain | 26 (16%) | 139 |
0.237 (0.71) |
0.428 (0.87) |
0.00202 (0.0828) |
0.0195 (0.267) |
0.574 (0.917) |
0.302 (0.766) |
0.00249 (0.0828) |
0.00043 (0.035) |
0.0253 (0.311) |
0.589 (0.929) |
0.119 (0.596) |
0.158 (0.652) |
| 20q gain | 145 (88%) | 20 |
0.0074 (0.169) |
0.161 (0.661) |
0.00072 (0.0432) |
0.233 (0.71) |
0.162 (0.662) |
0.338 (0.802) |
0.443 (0.881) |
0.00247 (0.0828) |
0.0447 (0.438) |
0.361 (0.826) |
0.362 (0.826) |
1 (1.00) |
| 11q loss | 30 (18%) | 135 |
0.0554 (0.47) |
0.205 (0.71) |
0.00698 (0.169) |
0.026 (0.315) |
0.606 (0.934) |
0.385 (0.829) |
0.00839 (0.174) |
0.00838 (0.174) |
0.203 (0.71) |
0.377 (0.826) |
0.415 (0.866) |
0.668 (0.957) |
| 5p gain | 36 (22%) | 129 |
0.204 (0.71) |
0.098 (0.556) |
0.00174 (0.0795) |
0.0985 (0.556) |
0.215 (0.71) |
0.689 (0.967) |
0.113 (0.582) |
6e-05 (0.0072) |
0.19 (0.703) |
0.923 (1.00) |
0.492 (0.899) |
0.627 (0.947) |
| 6p gain | 41 (25%) | 124 |
0.335 (0.801) |
0.565 (0.912) |
0.0089 (0.178) |
0.00328 (0.0984) |
0.773 (1.00) |
0.257 (0.721) |
0.797 (1.00) |
0.467 (0.892) |
0.241 (0.715) |
0.298 (0.763) |
0.278 (0.745) |
0.811 (1.00) |
| 16q gain | 41 (25%) | 124 |
0.0514 (0.457) |
0.594 (0.929) |
3e-05 (0.00576) |
0.233 (0.71) |
1 (1.00) |
0.67 (0.957) |
0.01 (0.193) |
0.107 (0.572) |
0.0197 (0.267) |
0.245 (0.717) |
0.233 (0.71) |
0.916 (1.00) |
| 18q loss | 138 (84%) | 27 |
0.0201 (0.267) |
0.174 (0.672) |
6e-05 (0.0072) |
0.012 (0.218) |
0.796 (1.00) |
0.484 (0.899) |
0.0712 (0.5) |
0.0198 (0.267) |
0.427 (0.867) |
0.0279 (0.315) |
0.516 (0.899) |
0.538 (0.908) |
| 2q gain | 43 (26%) | 122 |
0.093 (0.553) |
0.0575 (0.481) |
0.121 (0.597) |
0.061 (0.488) |
0.721 (0.987) |
0.828 (1.00) |
0.0881 (0.551) |
0.0025 (0.0828) |
0.219 (0.71) |
0.307 (0.768) |
0.158 (0.652) |
0.188 (0.698) |
| 3p gain | 27 (16%) | 138 |
1 (1.00) |
0.902 (1.00) |
0.00062 (0.0397) |
0.655 (0.951) |
0.0874 (0.551) |
0.459 (0.889) |
0.11 (0.581) |
0.928 (1.00) |
0.378 (0.826) |
0.361 (0.826) |
0.654 (0.951) |
0.825 (1.00) |
| 3q gain | 34 (21%) | 131 |
0.605 (0.934) |
0.612 (0.938) |
0.00018 (0.0192) |
0.868 (1.00) |
0.251 (0.717) |
0.423 (0.866) |
0.103 (0.567) |
0.738 (0.989) |
0.22 (0.71) |
0.315 (0.776) |
0.659 (0.951) |
0.896 (1.00) |
| 5q gain | 24 (15%) | 141 |
0.244 (0.717) |
0.0878 (0.551) |
0.00721 (0.169) |
0.0739 (0.51) |
0.186 (0.697) |
0.961 (1.00) |
0.449 (0.885) |
0.0911 (0.553) |
0.248 (0.717) |
0.522 (0.902) |
1 (1.00) |
0.652 (0.951) |
| 6q gain | 36 (22%) | 129 |
0.671 (0.957) |
0.23 (0.71) |
0.0174 (0.267) |
0.00671 (0.169) |
0.842 (1.00) |
0.47 (0.894) |
0.673 (0.958) |
0.509 (0.899) |
0.341 (0.803) |
0.582 (0.923) |
0.202 (0.71) |
0.563 (0.912) |
| 8p gain | 42 (25%) | 123 |
0.422 (0.866) |
0.236 (0.71) |
0.00224 (0.0828) |
0.517 (0.899) |
0.453 (0.885) |
0.0933 (0.553) |
0.514 (0.899) |
0.341 (0.803) |
0.814 (1.00) |
0.287 (0.749) |
0.918 (1.00) |
0.14 (0.619) |
| 8q gain | 89 (54%) | 76 |
0.0364 (0.384) |
0.277 (0.745) |
5e-05 (0.0072) |
0.21 (0.71) |
0.548 (0.912) |
0.788 (1.00) |
0.604 (0.934) |
0.22 (0.71) |
0.244 (0.717) |
0.0675 (0.494) |
0.0208 (0.27) |
0.373 (0.826) |
| 11p gain | 32 (19%) | 133 |
0.134 (0.618) |
0.389 (0.836) |
0.00852 (0.174) |
0.419 (0.866) |
0.72 (0.987) |
0.359 (0.826) |
0.133 (0.618) |
0.141 (0.62) |
0.0205 (0.27) |
0.209 (0.71) |
0.657 (0.951) |
0.532 (0.907) |
| 16p gain | 41 (25%) | 124 |
0.144 (0.621) |
0.853 (1.00) |
0.00108 (0.0576) |
0.27 (0.743) |
0.924 (1.00) |
1 (1.00) |
0.116 (0.593) |
0.369 (0.826) |
0.151 (0.647) |
0.675 (0.958) |
0.335 (0.801) |
0.981 (1.00) |
| 17q gain | 32 (19%) | 133 |
0.199 (0.71) |
0.943 (1.00) |
0.00703 (0.169) |
0.421 (0.866) |
0.879 (1.00) |
0.94 (1.00) |
0.366 (0.826) |
0.493 (0.899) |
0.0537 (0.464) |
0.46 (0.889) |
0.12 (0.597) |
0.637 (0.951) |
| xp gain | 34 (21%) | 131 |
0.0109 (0.206) |
0.143 (0.621) |
0.111 (0.581) |
0.4 (0.853) |
0.593 (0.929) |
0.621 (0.941) |
0.271 (0.743) |
0.669 (0.957) |
0.81 (1.00) |
0.846 (1.00) |
0.831 (1.00) |
0.643 (0.951) |
| 2p loss | 11 (7%) | 154 |
0.638 (0.951) |
0.75 (0.989) |
0.00384 (0.108) |
0.483 (0.899) |
0.907 (1.00) |
0.542 (0.912) |
0.526 (0.905) |
0.0593 (0.487) |
0.435 (0.876) |
0.605 (0.934) |
||
| 3q loss | 10 (6%) | 155 |
0.518 (0.899) |
0.793 (1.00) |
0.195 (0.71) |
0.409 (0.863) |
0.326 (0.791) |
0.657 (0.951) |
0.104 (0.567) |
0.22 (0.71) |
0.494 (0.899) |
0.00942 (0.185) |
0.422 (0.866) |
0.365 (0.826) |
| 4p loss | 59 (36%) | 106 |
0.666 (0.957) |
0.375 (0.826) |
0.00196 (0.0828) |
0.0273 (0.315) |
0.971 (1.00) |
0.514 (0.899) |
0.713 (0.984) |
0.569 (0.912) |
0.974 (1.00) |
0.0998 (0.557) |
0.224 (0.71) |
0.211 (0.71) |
| 4q loss | 66 (40%) | 99 |
0.779 (1.00) |
0.27 (0.743) |
0.00106 (0.0576) |
0.0401 (0.409) |
0.82 (1.00) |
0.516 (0.899) |
0.768 (1.00) |
0.435 (0.876) |
0.812 (1.00) |
0.217 (0.71) |
0.567 (0.912) |
0.916 (1.00) |
| 5q loss | 40 (24%) | 125 |
0.0919 (0.553) |
0.0117 (0.215) |
0.216 (0.71) |
0.168 (0.67) |
1 (1.00) |
0.548 (0.912) |
0.926 (1.00) |
0.221 (0.71) |
0.912 (1.00) |
0.207 (0.71) |
0.113 (0.582) |
0.227 (0.71) |
| 6q loss | 22 (13%) | 143 |
0.17 (0.67) |
0.644 (0.951) |
0.155 (0.647) |
0.422 (0.866) |
0.452 (0.885) |
0.604 (0.934) |
0.153 (0.647) |
0.152 (0.647) |
0.264 (0.733) |
0.409 (0.863) |
0.0132 (0.235) |
0.553 (0.912) |
| 9q loss | 23 (14%) | 142 |
0.21 (0.71) |
0.447 (0.885) |
0.281 (0.745) |
0.138 (0.618) |
0.941 (1.00) |
0.905 (1.00) |
0.516 (0.899) |
0.195 (0.71) |
0.0713 (0.5) |
0.00166 (0.0795) |
0.46 (0.889) |
0.0151 (0.253) |
| 11p loss | 23 (14%) | 142 |
0.244 (0.717) |
0.371 (0.826) |
0.00603 (0.159) |
0.205 (0.71) |
0.224 (0.71) |
0.174 (0.672) |
0.0193 (0.267) |
0.234 (0.71) |
0.977 (1.00) |
0.741 (0.989) |
0.602 (0.934) |
0.291 (0.75) |
| 15q loss | 73 (44%) | 92 |
0.451 (0.885) |
0.111 (0.581) |
0.00048 (0.035) |
1 (1.00) |
0.0865 (0.551) |
0.249 (0.717) |
0.439 (0.88) |
0.477 (0.899) |
0.817 (1.00) |
0.631 (0.949) |
0.906 (1.00) |
0.746 (0.989) |
| 18p loss | 128 (78%) | 37 |
0.0601 (0.488) |
0.707 (0.984) |
0.00133 (0.0672) |
0.0263 (0.315) |
0.601 (0.934) |
0.152 (0.647) |
0.118 (0.593) |
0.0146 (0.251) |
0.168 (0.67) |
0.163 (0.662) |
0.619 (0.941) |
0.594 (0.929) |
| 19q loss | 20 (12%) | 145 |
0.829 (1.00) |
0.503 (0.899) |
0.0701 (0.5) |
0.0821 (0.533) |
0.82 (1.00) |
0.775 (1.00) |
0.553 (0.912) |
0.716 (0.985) |
0.0675 (0.494) |
0.00845 (0.174) |
1 (1.00) |
0.749 (0.989) |
| 22q loss | 58 (35%) | 107 |
0.853 (1.00) |
0.312 (0.771) |
0.0642 (0.494) |
0.776 (1.00) |
0.75 (0.989) |
0.297 (0.763) |
0.34 (0.803) |
0.169 (0.67) |
0.00614 (0.159) |
0.181 (0.688) |
0.126 (0.607) |
0.0186 (0.267) |
| 1p gain | 12 (7%) | 153 |
0.51 (0.899) |
0.941 (1.00) |
0.829 (1.00) |
0.527 (0.906) |
0.0309 (0.337) |
0.0173 (0.267) |
0.332 (0.8) |
0.595 (0.929) |
0.941 (1.00) |
0.459 (0.889) |
0.87 (1.00) |
0.653 (0.951) |
| 1q gain | 34 (21%) | 131 |
0.583 (0.924) |
0.65 (0.951) |
0.136 (0.618) |
0.311 (0.771) |
0.0687 (0.496) |
0.212 (0.71) |
0.452 (0.885) |
0.996 (1.00) |
0.536 (0.907) |
0.879 (1.00) |
0.87 (1.00) |
0.366 (0.826) |
| 2p gain | 41 (25%) | 124 |
0.508 (0.899) |
0.0197 (0.267) |
0.259 (0.721) |
0.025 (0.311) |
0.669 (0.957) |
0.641 (0.951) |
0.0465 (0.439) |
0.0191 (0.267) |
0.188 (0.698) |
0.0761 (0.514) |
0.726 (0.987) |
0.501 (0.899) |
| 4p gain | 9 (5%) | 156 |
1 (1.00) |
0.791 (1.00) |
0.965 (1.00) |
0.765 (1.00) |
0.0897 (0.552) |
0.172 (0.672) |
0.488 (0.899) |
0.628 (0.947) |
0.223 (0.71) |
0.374 (0.826) |
0.744 (0.989) |
0.949 (1.00) |
| 4q gain | 5 (3%) | 160 |
0.298 (0.763) |
0.648 (0.951) |
0.675 (0.958) |
0.219 (0.71) |
0.488 (0.899) |
0.712 (0.984) |
1 (1.00) |
0.889 (1.00) |
1 (1.00) |
|||
| 9p gain | 42 (25%) | 123 |
0.0176 (0.267) |
0.196 (0.71) |
0.442 (0.881) |
0.163 (0.662) |
0.652 (0.951) |
0.229 (0.71) |
0.0512 (0.457) |
0.278 (0.745) |
0.273 (0.745) |
0.328 (0.792) |
0.864 (1.00) |
0.867 (1.00) |
| 9q gain | 33 (20%) | 132 |
0.0153 (0.253) |
0.211 (0.71) |
0.28 (0.745) |
0.468 (0.892) |
0.561 (0.912) |
0.0979 (0.556) |
0.371 (0.826) |
0.0909 (0.553) |
0.786 (1.00) |
0.622 (0.942) |
0.83 (1.00) |
0.932 (1.00) |
| 10p gain | 13 (8%) | 152 |
1 (1.00) |
0.918 (1.00) |
0.336 (0.801) |
0.716 (0.985) |
0.666 (0.957) |
0.75 (0.989) |
0.522 (0.902) |
0.126 (0.607) |
0.653 (0.951) |
0.919 (1.00) |
0.616 (0.941) |
0.791 (1.00) |
| 10q gain | 7 (4%) | 158 |
0.518 (0.899) |
0.0817 (0.533) |
0.254 (0.72) |
1 (1.00) |
1 (1.00) |
0.872 (1.00) |
1 (1.00) |
0.503 (0.899) |
0.774 (1.00) |
0.864 (1.00) |
||
| 12p gain | 33 (20%) | 132 |
0.692 (0.968) |
0.481 (0.899) |
0.235 (0.71) |
0.728 (0.987) |
0.181 (0.688) |
0.122 (0.598) |
0.084 (0.541) |
0.202 (0.71) |
0.374 (0.826) |
0.55 (0.912) |
0.281 (0.745) |
0.869 (1.00) |
| 12q gain | 24 (15%) | 141 |
0.776 (1.00) |
0.519 (0.899) |
0.74 (0.989) |
0.307 (0.768) |
0.265 (0.733) |
0.213 (0.71) |
0.042 (0.42) |
0.51 (0.899) |
0.224 (0.71) |
0.742 (0.989) |
0.0532 (0.464) |
0.949 (1.00) |
| 14q gain | 8 (5%) | 157 |
0.832 (1.00) |
0.916 (1.00) |
0.112 (0.582) |
0.223 (0.71) |
0.519 (0.899) |
0.544 (0.912) |
0.494 (0.899) |
0.913 (1.00) |
0.129 (0.614) |
0.862 (1.00) |
||
| 15q gain | 3 (2%) | 162 |
0.417 (0.866) |
0.481 (0.899) |
0.356 (0.826) |
0.644 (0.951) |
||||||||
| 17p gain | 8 (5%) | 157 |
0.108 (0.577) |
0.38 (0.826) |
0.233 (0.71) |
0.466 (0.892) |
1 (1.00) |
0.872 (1.00) |
0.423 (0.866) |
0.685 (0.966) |
0.49 (0.899) |
0.443 (0.881) |
||
| 18p gain | 8 (5%) | 157 |
0.516 (0.899) |
0.391 (0.837) |
0.216 (0.71) |
0.728 (0.987) |
0.807 (1.00) |
0.738 (0.989) |
0.678 (0.959) |
0.383 (0.827) |
0.5 (0.899) |
0.558 (0.912) |
1 (1.00) |
0.893 (1.00) |
| 18q gain | 6 (4%) | 159 |
0.792 (1.00) |
0.379 (0.826) |
0.492 (0.899) |
0.893 (1.00) |
0.534 (0.907) |
0.227 (0.71) |
0.654 (0.951) |
0.632 (0.949) |
1 (1.00) |
0.892 (1.00) |
||
| 19p gain | 33 (20%) | 132 |
0.0652 (0.494) |
0.417 (0.866) |
0.106 (0.572) |
0.766 (1.00) |
0.544 (0.912) |
0.463 (0.89) |
0.566 (0.912) |
0.0277 (0.315) |
0.138 (0.618) |
0.957 (1.00) |
1 (1.00) |
0.973 (1.00) |
| 19q gain | 32 (19%) | 133 |
0.082 (0.533) |
0.533 (0.907) |
0.0748 (0.513) |
0.53 (0.907) |
0.958 (1.00) |
0.594 (0.929) |
0.226 (0.71) |
0.128 (0.613) |
0.353 (0.826) |
0.581 (0.923) |
1 (1.00) |
0.973 (1.00) |
| 20p gain | 109 (66%) | 56 |
0.0954 (0.556) |
0.726 (0.987) |
0.138 (0.618) |
0.251 (0.717) |
0.134 (0.618) |
0.831 (1.00) |
0.604 (0.934) |
0.566 (0.912) |
0.0973 (0.556) |
0.0468 (0.439) |
0.304 (0.766) |
0.0777 (0.514) |
| 21q gain | 10 (6%) | 155 |
0.535 (0.907) |
0.659 (0.951) |
0.637 (0.951) |
1 (1.00) |
0.62 (0.941) |
0.792 (1.00) |
0.947 (1.00) |
0.921 (1.00) |
0.289 (0.75) |
0.724 (0.987) |
||
| 22q gain | 9 (5%) | 156 |
0.729 (0.987) |
0.0608 (0.488) |
0.0754 (0.513) |
1 (1.00) |
0.422 (0.866) |
0.234 (0.71) |
0.351 (0.823) |
0.201 (0.71) |
1 (1.00) |
1 (1.00) |
||
| xq gain | 34 (21%) | 131 |
0.156 (0.647) |
0.382 (0.826) |
0.0454 (0.439) |
0.288 (0.749) |
0.818 (1.00) |
0.302 (0.766) |
0.104 (0.567) |
0.647 (0.951) |
0.981 (1.00) |
1 (1.00) |
0.453 (0.885) |
0.212 (0.71) |
| 1p loss | 46 (28%) | 119 |
0.69 (0.967) |
0.0273 (0.315) |
0.0508 (0.457) |
0.185 (0.693) |
0.935 (1.00) |
0.207 (0.71) |
0.366 (0.826) |
0.169 (0.67) |
0.442 (0.881) |
0.61 (0.937) |
0.559 (0.912) |
0.567 (0.912) |
| 1q loss | 26 (16%) | 139 |
0.912 (1.00) |
0.0576 (0.481) |
0.257 (0.721) |
0.0288 (0.321) |
0.843 (1.00) |
0.532 (0.907) |
0.0654 (0.494) |
0.463 (0.89) |
0.561 (0.912) |
0.226 (0.71) |
0.5 (0.899) |
0.275 (0.745) |
| 2q loss | 6 (4%) | 159 |
1 (1.00) |
0.569 (0.912) |
0.0523 (0.461) |
0.103 (0.567) |
0.304 (0.766) |
0.81 (1.00) |
0.0656 (0.494) |
0.203 (0.71) |
0.466 (0.892) |
|||
| 3p loss | 15 (9%) | 150 |
1 (1.00) |
0.365 (0.826) |
0.203 (0.71) |
0.774 (1.00) |
0.258 (0.721) |
0.895 (1.00) |
0.154 (0.647) |
0.557 (0.912) |
0.453 (0.885) |
0.134 (0.618) |
0.0983 (0.556) |
0.0445 (0.438) |
| 5p loss | 26 (16%) | 139 |
0.239 (0.713) |
0.816 (1.00) |
0.137 (0.618) |
0.178 (0.68) |
0.525 (0.904) |
0.0652 (0.494) |
0.878 (1.00) |
0.125 (0.607) |
0.724 (0.987) |
0.577 (0.921) |
0.174 (0.672) |
0.246 (0.717) |
| 6p loss | 13 (8%) | 152 |
0.546 (0.912) |
0.931 (1.00) |
0.7 (0.975) |
0.121 (0.597) |
0.311 (0.771) |
0.359 (0.826) |
0.749 (0.989) |
0.278 (0.745) |
0.566 (0.912) |
0.256 (0.721) |
||
| 7q loss | 3 (2%) | 162 |
0.357 (0.826) |
0.785 (1.00) |
0.773 (1.00) |
0.0375 (0.391) |
0.759 (0.996) |
0.858 (1.00) |
1 (1.00) |
|||||
| 8p loss | 73 (44%) | 92 |
0.123 (0.6) |
0.246 (0.717) |
0.134 (0.618) |
0.964 (1.00) |
0.785 (1.00) |
0.252 (0.719) |
0.024 (0.303) |
0.117 (0.593) |
0.894 (1.00) |
0.973 (1.00) |
0.733 (0.989) |
0.229 (0.71) |
| 8q loss | 11 (7%) | 154 |
0.687 (0.966) |
0.714 (0.984) |
0.41 (0.863) |
0.468 (0.892) |
0.794 (1.00) |
0.279 (0.745) |
0.545 (0.912) |
0.326 (0.791) |
0.866 (1.00) |
0.302 (0.766) |
0.169 (0.67) |
0.405 (0.858) |
| 9p loss | 23 (14%) | 142 |
0.634 (0.95) |
0.616 (0.941) |
0.321 (0.782) |
0.141 (0.62) |
0.749 (0.989) |
0.564 (0.912) |
0.811 (1.00) |
0.515 (0.899) |
0.308 (0.769) |
0.0481 (0.444) |
0.713 (0.984) |
0.0391 (0.404) |
| 10p loss | 33 (20%) | 132 |
0.144 (0.621) |
0.172 (0.672) |
0.137 (0.618) |
0.0672 (0.494) |
0.144 (0.621) |
0.24 (0.715) |
0.201 (0.71) |
0.455 (0.886) |
0.837 (1.00) |
0.117 (0.593) |
0.816 (1.00) |
0.749 (0.989) |
| 10q loss | 38 (23%) | 127 |
0.177 (0.68) |
0.155 (0.647) |
0.0593 (0.487) |
0.0934 (0.553) |
0.13 (0.615) |
0.0324 (0.348) |
0.374 (0.826) |
0.0734 (0.51) |
0.682 (0.963) |
0.0884 (0.551) |
0.899 (1.00) |
0.537 (0.908) |
| 12p loss | 22 (13%) | 143 |
0.424 (0.866) |
0.278 (0.745) |
0.654 (0.951) |
0.401 (0.853) |
0.693 (0.969) |
0.0775 (0.514) |
0.752 (0.99) |
0.433 (0.875) |
0.45 (0.885) |
0.775 (1.00) |
0.0662 (0.494) |
0.512 (0.899) |
| 12q loss | 19 (12%) | 146 |
0.502 (0.899) |
0.771 (1.00) |
0.237 (0.71) |
0.93 (1.00) |
0.555 (0.912) |
0.258 (0.721) |
0.834 (1.00) |
0.254 (0.72) |
0.379 (0.826) |
0.317 (0.777) |
0.274 (0.745) |
0.868 (1.00) |
| 13q loss | 8 (5%) | 157 |
0.518 (0.899) |
1 (1.00) |
0.657 (0.951) |
0.107 (0.572) |
0.0544 (0.466) |
0.431 (0.873) |
1 (1.00) |
0.492 (0.899) |
0.174 (0.672) |
1 (1.00) |
||
| 14q loss | 67 (41%) | 98 |
0.501 (0.899) |
0.25 (0.717) |
0.02 (0.267) |
0.567 (0.912) |
0.802 (1.00) |
0.493 (0.899) |
0.382 (0.826) |
0.0777 (0.514) |
0.335 (0.801) |
0.202 (0.71) |
0.748 (0.989) |
0.781 (1.00) |
| 16p loss | 9 (5%) | 156 |
0.378 (0.826) |
0.756 (0.995) |
0.0996 (0.557) |
0.0624 (0.494) |
0.654 (0.951) |
0.632 (0.949) |
0.184 (0.693) |
0.913 (1.00) |
0.563 (0.912) |
1 (1.00) |
0.25 (0.717) |
0.486 (0.899) |
| 16q loss | 15 (9%) | 150 |
0.282 (0.745) |
0.678 (0.959) |
0.0471 (0.439) |
0.334 (0.801) |
0.723 (0.987) |
0.898 (1.00) |
0.402 (0.855) |
0.996 (1.00) |
0.869 (1.00) |
1 (1.00) |
0.939 (1.00) |
0.964 (1.00) |
| 17p loss | 107 (65%) | 58 |
0.206 (0.71) |
0.376 (0.826) |
0.0946 (0.556) |
0.199 (0.71) |
0.971 (1.00) |
0.319 (0.78) |
0.617 (0.941) |
0.593 (0.929) |
0.981 (1.00) |
0.398 (0.851) |
0.288 (0.749) |
0.664 (0.957) |
| 17q loss | 26 (16%) | 139 |
0.904 (1.00) |
0.737 (0.989) |
0.0278 (0.315) |
0.0894 (0.552) |
0.746 (0.989) |
0.974 (1.00) |
0.113 (0.582) |
0.34 (0.803) |
0.87 (1.00) |
0.947 (1.00) |
0.423 (0.866) |
0.476 (0.897) |
| 19p loss | 21 (13%) | 144 |
0.729 (0.987) |
0.834 (1.00) |
0.135 (0.618) |
0.0304 (0.335) |
0.65 (0.951) |
0.808 (1.00) |
0.591 (0.929) |
0.566 (0.912) |
0.377 (0.826) |
0.0183 (0.267) |
0.964 (1.00) |
0.74 (0.989) |
| 20p loss | 23 (14%) | 142 |
1 (1.00) |
0.952 (1.00) |
0.0507 (0.457) |
0.284 (0.749) |
0.378 (0.826) |
0.985 (1.00) |
0.439 (0.88) |
0.674 (0.958) |
0.0326 (0.348) |
0.0227 (0.291) |
0.304 (0.766) |
0.0145 (0.251) |
| 21q loss | 68 (41%) | 97 |
0.285 (0.749) |
0.247 (0.717) |
0.413 (0.866) |
1 (1.00) |
0.973 (1.00) |
0.531 (0.907) |
0.82 (1.00) |
0.687 (0.966) |
0.0157 (0.256) |
0.183 (0.69) |
0.224 (0.71) |
0.068 (0.494) |
| xp loss | 25 (15%) | 140 |
0.29 (0.75) |
0.899 (1.00) |
0.305 (0.766) |
0.475 (0.897) |
0.504 (0.899) |
0.84 (1.00) |
0.426 (0.867) |
0.858 (1.00) |
0.977 (1.00) |
0.579 (0.921) |
0.571 (0.913) |
0.78 (1.00) |
| xq loss | 24 (15%) | 141 |
0.609 (0.937) |
0.478 (0.899) |
0.709 (0.984) |
0.315 (0.776) |
0.695 (0.969) |
0.901 (1.00) |
0.563 (0.912) |
0.954 (1.00) |
0.841 (1.00) |
0.366 (0.826) |
0.474 (0.897) |
0.806 (1.00) |
P value = 0.0025 (Fisher's exact test), Q value = 0.083
Table S1. Gene #4: '2q gain' versus Molecular Subtype #8: 'MRNASEQ_CHIERARCHICAL'
| nPatients | CLUS_1 | CLUS_2 | CLUS_3 | CLUS_4 | CLUS_5 | CLUS_6 | CLUS_7 |
|---|---|---|---|---|---|---|---|
| ALL | 27 | 36 | 12 | 19 | 32 | 18 | 20 |
| 2Q GAIN MUTATED | 14 | 6 | 2 | 6 | 10 | 0 | 4 |
| 2Q GAIN WILD-TYPE | 13 | 30 | 10 | 13 | 22 | 18 | 16 |
Figure S1. Get High-res Image Gene #4: '2q gain' versus Molecular Subtype #8: 'MRNASEQ_CHIERARCHICAL'
P value = 0.00062 (Fisher's exact test), Q value = 0.04
Table S2. Gene #5: '3p gain' versus Molecular Subtype #3: 'CN_CNMF'
| nPatients | CLUS_1 | CLUS_2 | CLUS_3 | CLUS_4 |
|---|---|---|---|---|
| ALL | 66 | 32 | 31 | 36 |
| 3P GAIN MUTATED | 3 | 10 | 9 | 5 |
| 3P GAIN WILD-TYPE | 63 | 22 | 22 | 31 |
Figure S2. Get High-res Image Gene #5: '3p gain' versus Molecular Subtype #3: 'CN_CNMF'
P value = 0.00018 (Fisher's exact test), Q value = 0.019
Table S3. Gene #6: '3q gain' versus Molecular Subtype #3: 'CN_CNMF'
| nPatients | CLUS_1 | CLUS_2 | CLUS_3 | CLUS_4 |
|---|---|---|---|---|
| ALL | 66 | 32 | 31 | 36 |
| 3Q GAIN MUTATED | 4 | 12 | 11 | 7 |
| 3Q GAIN WILD-TYPE | 62 | 20 | 20 | 29 |
Figure S3. Get High-res Image Gene #6: '3q gain' versus Molecular Subtype #3: 'CN_CNMF'
P value = 0.00174 (Fisher's exact test), Q value = 0.08
Table S4. Gene #9: '5p gain' versus Molecular Subtype #3: 'CN_CNMF'
| nPatients | CLUS_1 | CLUS_2 | CLUS_3 | CLUS_4 |
|---|---|---|---|---|
| ALL | 66 | 32 | 31 | 36 |
| 5P GAIN MUTATED | 5 | 10 | 9 | 12 |
| 5P GAIN WILD-TYPE | 61 | 22 | 22 | 24 |
Figure S4. Get High-res Image Gene #9: '5p gain' versus Molecular Subtype #3: 'CN_CNMF'
P value = 6e-05 (Fisher's exact test), Q value = 0.0072
Table S5. Gene #9: '5p gain' versus Molecular Subtype #8: 'MRNASEQ_CHIERARCHICAL'
| nPatients | CLUS_1 | CLUS_2 | CLUS_3 | CLUS_4 | CLUS_5 | CLUS_6 | CLUS_7 |
|---|---|---|---|---|---|---|---|
| ALL | 27 | 36 | 12 | 19 | 32 | 18 | 20 |
| 5P GAIN MUTATED | 8 | 2 | 9 | 2 | 10 | 2 | 3 |
| 5P GAIN WILD-TYPE | 19 | 34 | 3 | 17 | 22 | 16 | 17 |
Figure S5. Get High-res Image Gene #9: '5p gain' versus Molecular Subtype #8: 'MRNASEQ_CHIERARCHICAL'
P value = 0.00721 (Fisher's exact test), Q value = 0.17
Table S6. Gene #10: '5q gain' versus Molecular Subtype #3: 'CN_CNMF'
| nPatients | CLUS_1 | CLUS_2 | CLUS_3 | CLUS_4 |
|---|---|---|---|---|
| ALL | 66 | 32 | 31 | 36 |
| 5Q GAIN MUTATED | 3 | 6 | 5 | 10 |
| 5Q GAIN WILD-TYPE | 63 | 26 | 26 | 26 |
Figure S6. Get High-res Image Gene #10: '5q gain' versus Molecular Subtype #3: 'CN_CNMF'
P value = 0.0089 (Fisher's exact test), Q value = 0.18
Table S7. Gene #11: '6p gain' versus Molecular Subtype #3: 'CN_CNMF'
| nPatients | CLUS_1 | CLUS_2 | CLUS_3 | CLUS_4 |
|---|---|---|---|---|
| ALL | 66 | 32 | 31 | 36 |
| 6P GAIN MUTATED | 11 | 15 | 9 | 6 |
| 6P GAIN WILD-TYPE | 55 | 17 | 22 | 30 |
Figure S7. Get High-res Image Gene #11: '6p gain' versus Molecular Subtype #3: 'CN_CNMF'
P value = 0.00328 (Fisher's exact test), Q value = 0.098
Table S8. Gene #11: '6p gain' versus Molecular Subtype #4: 'METHLYATION_CNMF'
| nPatients | CLUS_1 | CLUS_2 | CLUS_3 |
|---|---|---|---|
| ALL | 28 | 39 | 29 |
| 6P GAIN MUTATED | 14 | 5 | 7 |
| 6P GAIN WILD-TYPE | 14 | 34 | 22 |
Figure S8. Get High-res Image Gene #11: '6p gain' versus Molecular Subtype #4: 'METHLYATION_CNMF'
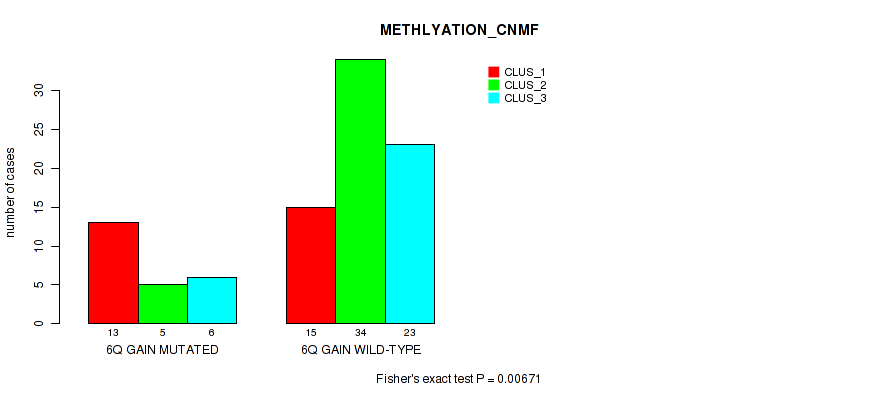
P value = 0.00671 (Fisher's exact test), Q value = 0.17
Table S9. Gene #12: '6q gain' versus Molecular Subtype #4: 'METHLYATION_CNMF'
| nPatients | CLUS_1 | CLUS_2 | CLUS_3 |
|---|---|---|---|
| ALL | 28 | 39 | 29 |
| 6Q GAIN MUTATED | 13 | 5 | 6 |
| 6Q GAIN WILD-TYPE | 15 | 34 | 23 |
Figure S9. Get High-res Image Gene #12: '6q gain' versus Molecular Subtype #4: 'METHLYATION_CNMF'
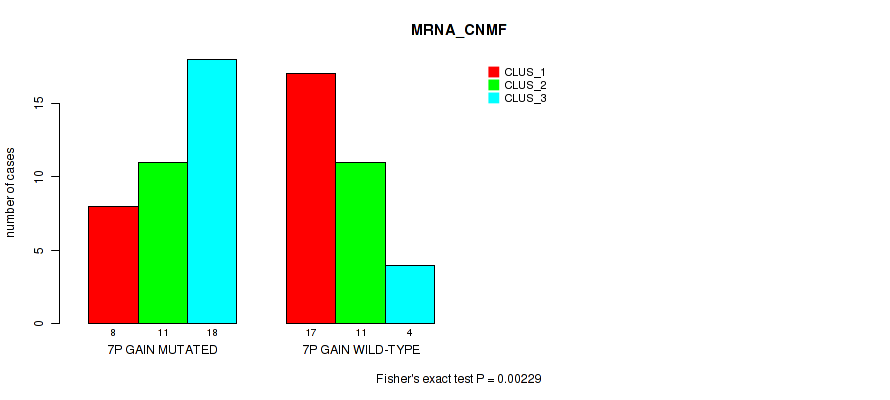
P value = 0.00229 (Fisher's exact test), Q value = 0.083
Table S10. Gene #13: '7p gain' versus Molecular Subtype #1: 'MRNA_CNMF'
| nPatients | CLUS_1 | CLUS_2 | CLUS_3 |
|---|---|---|---|
| ALL | 25 | 22 | 22 |
| 7P GAIN MUTATED | 8 | 11 | 18 |
| 7P GAIN WILD-TYPE | 17 | 11 | 4 |
Figure S10. Get High-res Image Gene #13: '7p gain' versus Molecular Subtype #1: 'MRNA_CNMF'
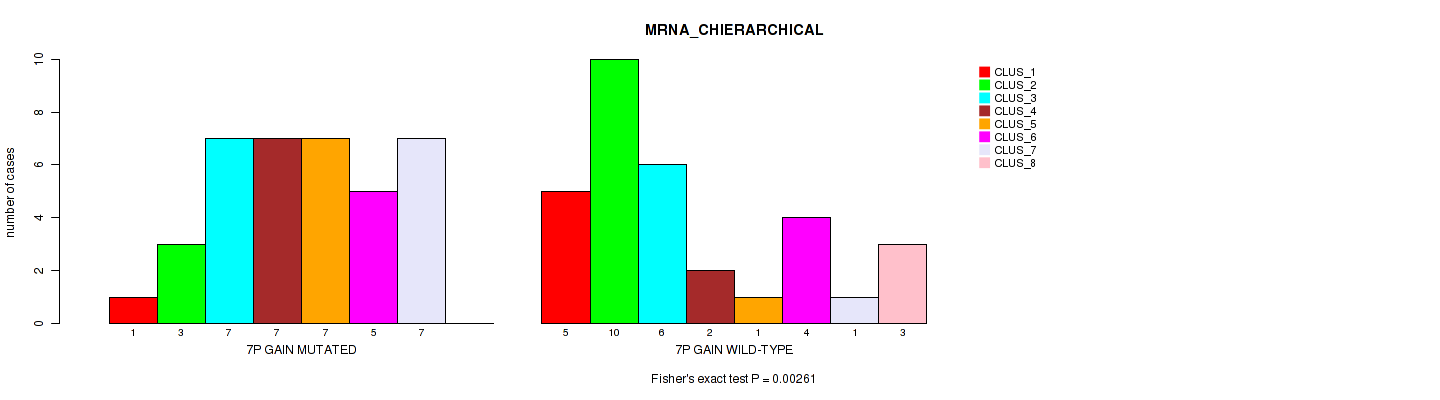
P value = 0.00261 (Fisher's exact test), Q value = 0.084
Table S11. Gene #13: '7p gain' versus Molecular Subtype #2: 'MRNA_CHIERARCHICAL'
| nPatients | CLUS_1 | CLUS_2 | CLUS_3 | CLUS_4 | CLUS_5 | CLUS_6 | CLUS_7 | CLUS_8 |
|---|---|---|---|---|---|---|---|---|
| ALL | 6 | 13 | 13 | 9 | 8 | 9 | 8 | 3 |
| 7P GAIN MUTATED | 1 | 3 | 7 | 7 | 7 | 5 | 7 | 0 |
| 7P GAIN WILD-TYPE | 5 | 10 | 6 | 2 | 1 | 4 | 1 | 3 |
Figure S11. Get High-res Image Gene #13: '7p gain' versus Molecular Subtype #2: 'MRNA_CHIERARCHICAL'
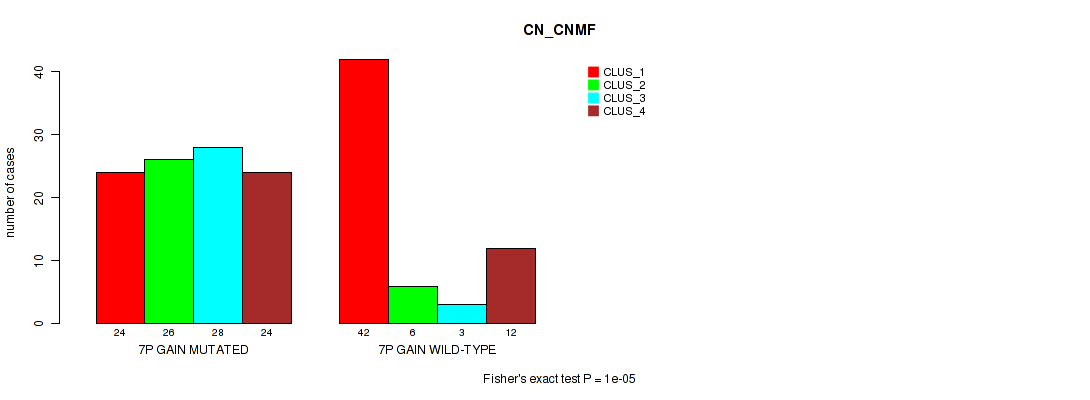
P value = 1e-05 (Fisher's exact test), Q value = 0.0048
Table S12. Gene #13: '7p gain' versus Molecular Subtype #3: 'CN_CNMF'
| nPatients | CLUS_1 | CLUS_2 | CLUS_3 | CLUS_4 |
|---|---|---|---|---|
| ALL | 66 | 32 | 31 | 36 |
| 7P GAIN MUTATED | 24 | 26 | 28 | 24 |
| 7P GAIN WILD-TYPE | 42 | 6 | 3 | 12 |
Figure S12. Get High-res Image Gene #13: '7p gain' versus Molecular Subtype #3: 'CN_CNMF'
P value = 0.00316 (Fisher's exact test), Q value = 0.098
Table S13. Gene #13: '7p gain' versus Molecular Subtype #4: 'METHLYATION_CNMF'
| nPatients | CLUS_1 | CLUS_2 | CLUS_3 |
|---|---|---|---|
| ALL | 28 | 39 | 29 |
| 7P GAIN MUTATED | 24 | 19 | 22 |
| 7P GAIN WILD-TYPE | 4 | 20 | 7 |
Figure S13. Get High-res Image Gene #13: '7p gain' versus Molecular Subtype #4: 'METHLYATION_CNMF'
P value = 0.00024 (Fisher's exact test), Q value = 0.023
Table S14. Gene #13: '7p gain' versus Molecular Subtype #7: 'MRNASEQ_CNMF'
| nPatients | CLUS_1 | CLUS_2 | CLUS_3 | CLUS_4 | CLUS_5 |
|---|---|---|---|---|---|
| ALL | 29 | 14 | 33 | 28 | 60 |
| 7P GAIN MUTATED | 24 | 7 | 13 | 24 | 33 |
| 7P GAIN WILD-TYPE | 5 | 7 | 20 | 4 | 27 |
Figure S14. Get High-res Image Gene #13: '7p gain' versus Molecular Subtype #7: 'MRNASEQ_CNMF'
P value = 2e-05 (Fisher's exact test), Q value = 0.0048
Table S15. Gene #13: '7p gain' versus Molecular Subtype #8: 'MRNASEQ_CHIERARCHICAL'
| nPatients | CLUS_1 | CLUS_2 | CLUS_3 | CLUS_4 | CLUS_5 | CLUS_6 | CLUS_7 |
|---|---|---|---|---|---|---|---|
| ALL | 27 | 36 | 12 | 19 | 32 | 18 | 20 |
| 7P GAIN MUTATED | 25 | 17 | 9 | 13 | 20 | 3 | 14 |
| 7P GAIN WILD-TYPE | 2 | 19 | 3 | 6 | 12 | 15 | 6 |
Figure S15. Get High-res Image Gene #13: '7p gain' versus Molecular Subtype #8: 'MRNASEQ_CHIERARCHICAL'
P value = 0.00813 (Fisher's exact test), Q value = 0.17
Table S16. Gene #14: '7q gain' versus Molecular Subtype #2: 'MRNA_CHIERARCHICAL'
| nPatients | CLUS_1 | CLUS_2 | CLUS_3 | CLUS_4 | CLUS_5 | CLUS_6 | CLUS_7 | CLUS_8 |
|---|---|---|---|---|---|---|---|---|
| ALL | 6 | 13 | 13 | 9 | 8 | 9 | 8 | 3 |
| 7Q GAIN MUTATED | 1 | 3 | 7 | 4 | 7 | 4 | 7 | 0 |
| 7Q GAIN WILD-TYPE | 5 | 10 | 6 | 5 | 1 | 5 | 1 | 3 |
Figure S16. Get High-res Image Gene #14: '7q gain' versus Molecular Subtype #2: 'MRNA_CHIERARCHICAL'
P value = 2e-05 (Fisher's exact test), Q value = 0.0048
Table S17. Gene #14: '7q gain' versus Molecular Subtype #3: 'CN_CNMF'
| nPatients | CLUS_1 | CLUS_2 | CLUS_3 | CLUS_4 |
|---|---|---|---|---|
| ALL | 66 | 32 | 31 | 36 |
| 7Q GAIN MUTATED | 18 | 23 | 22 | 22 |
| 7Q GAIN WILD-TYPE | 48 | 9 | 9 | 14 |
Figure S17. Get High-res Image Gene #14: '7q gain' versus Molecular Subtype #3: 'CN_CNMF'
P value = 0.0045 (Fisher's exact test), Q value = 0.12
Table S18. Gene #14: '7q gain' versus Molecular Subtype #7: 'MRNASEQ_CNMF'
| nPatients | CLUS_1 | CLUS_2 | CLUS_3 | CLUS_4 | CLUS_5 |
|---|---|---|---|---|---|
| ALL | 29 | 14 | 33 | 28 | 60 |
| 7Q GAIN MUTATED | 17 | 5 | 11 | 22 | 29 |
| 7Q GAIN WILD-TYPE | 12 | 9 | 22 | 6 | 31 |
Figure S18. Get High-res Image Gene #14: '7q gain' versus Molecular Subtype #7: 'MRNASEQ_CNMF'
P value = 0.00213 (Fisher's exact test), Q value = 0.083
Table S19. Gene #14: '7q gain' versus Molecular Subtype #8: 'MRNASEQ_CHIERARCHICAL'
| nPatients | CLUS_1 | CLUS_2 | CLUS_3 | CLUS_4 | CLUS_5 | CLUS_6 | CLUS_7 |
|---|---|---|---|---|---|---|---|
| ALL | 27 | 36 | 12 | 19 | 32 | 18 | 20 |
| 7Q GAIN MUTATED | 19 | 12 | 8 | 12 | 18 | 3 | 12 |
| 7Q GAIN WILD-TYPE | 8 | 24 | 4 | 7 | 14 | 15 | 8 |
Figure S19. Get High-res Image Gene #14: '7q gain' versus Molecular Subtype #8: 'MRNASEQ_CHIERARCHICAL'
P value = 0.00224 (Fisher's exact test), Q value = 0.083
Table S20. Gene #15: '8p gain' versus Molecular Subtype #3: 'CN_CNMF'
| nPatients | CLUS_1 | CLUS_2 | CLUS_3 | CLUS_4 |
|---|---|---|---|---|
| ALL | 66 | 32 | 31 | 36 |
| 8P GAIN MUTATED | 10 | 8 | 6 | 18 |
| 8P GAIN WILD-TYPE | 56 | 24 | 25 | 18 |
Figure S20. Get High-res Image Gene #15: '8p gain' versus Molecular Subtype #3: 'CN_CNMF'
P value = 5e-05 (Fisher's exact test), Q value = 0.0072
Table S21. Gene #16: '8q gain' versus Molecular Subtype #3: 'CN_CNMF'
| nPatients | CLUS_1 | CLUS_2 | CLUS_3 | CLUS_4 |
|---|---|---|---|---|
| ALL | 66 | 32 | 31 | 36 |
| 8Q GAIN MUTATED | 29 | 13 | 15 | 32 |
| 8Q GAIN WILD-TYPE | 37 | 19 | 16 | 4 |
Figure S21. Get High-res Image Gene #16: '8q gain' versus Molecular Subtype #3: 'CN_CNMF'
P value = 0.00852 (Fisher's exact test), Q value = 0.17
Table S22. Gene #21: '11p gain' versus Molecular Subtype #3: 'CN_CNMF'
| nPatients | CLUS_1 | CLUS_2 | CLUS_3 | CLUS_4 |
|---|---|---|---|---|
| ALL | 66 | 32 | 31 | 36 |
| 11P GAIN MUTATED | 8 | 6 | 13 | 5 |
| 11P GAIN WILD-TYPE | 58 | 26 | 18 | 31 |
Figure S22. Get High-res Image Gene #21: '11p gain' versus Molecular Subtype #3: 'CN_CNMF'
P value = 0.00202 (Fisher's exact test), Q value = 0.083
Table S23. Gene #22: '11q gain' versus Molecular Subtype #3: 'CN_CNMF'
| nPatients | CLUS_1 | CLUS_2 | CLUS_3 | CLUS_4 |
|---|---|---|---|---|
| ALL | 66 | 32 | 31 | 36 |
| 11Q GAIN MUTATED | 7 | 5 | 12 | 2 |
| 11Q GAIN WILD-TYPE | 59 | 27 | 19 | 34 |
Figure S23. Get High-res Image Gene #22: '11q gain' versus Molecular Subtype #3: 'CN_CNMF'
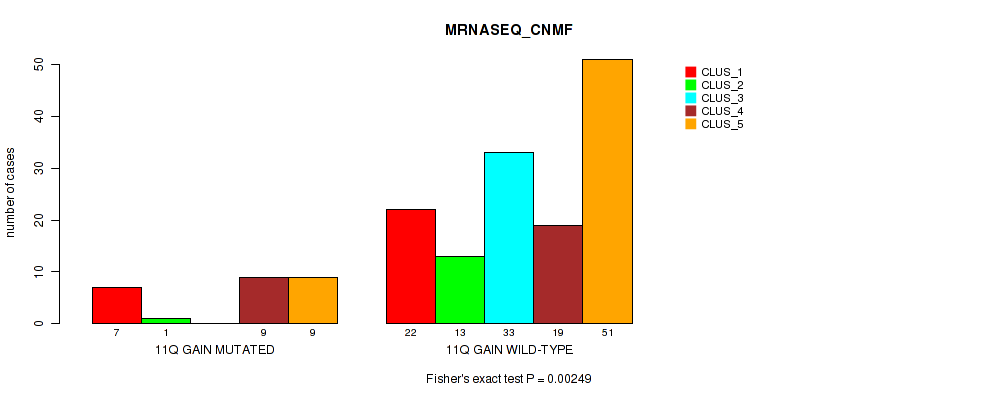
P value = 0.00249 (Fisher's exact test), Q value = 0.083
Table S24. Gene #22: '11q gain' versus Molecular Subtype #7: 'MRNASEQ_CNMF'
| nPatients | CLUS_1 | CLUS_2 | CLUS_3 | CLUS_4 | CLUS_5 |
|---|---|---|---|---|---|
| ALL | 29 | 14 | 33 | 28 | 60 |
| 11Q GAIN MUTATED | 7 | 1 | 0 | 9 | 9 |
| 11Q GAIN WILD-TYPE | 22 | 13 | 33 | 19 | 51 |
Figure S24. Get High-res Image Gene #22: '11q gain' versus Molecular Subtype #7: 'MRNASEQ_CNMF'
P value = 0.00043 (Fisher's exact test), Q value = 0.035
Table S25. Gene #22: '11q gain' versus Molecular Subtype #8: 'MRNASEQ_CHIERARCHICAL'
| nPatients | CLUS_1 | CLUS_2 | CLUS_3 | CLUS_4 | CLUS_5 | CLUS_6 | CLUS_7 |
|---|---|---|---|---|---|---|---|
| ALL | 27 | 36 | 12 | 19 | 32 | 18 | 20 |
| 11Q GAIN MUTATED | 9 | 1 | 0 | 7 | 7 | 1 | 1 |
| 11Q GAIN WILD-TYPE | 18 | 35 | 12 | 12 | 25 | 17 | 19 |
Figure S25. Get High-res Image Gene #22: '11q gain' versus Molecular Subtype #8: 'MRNASEQ_CHIERARCHICAL'
P value = 1e-05 (Fisher's exact test), Q value = 0.0048
Table S26. Gene #25: '13q gain' versus Molecular Subtype #3: 'CN_CNMF'
| nPatients | CLUS_1 | CLUS_2 | CLUS_3 | CLUS_4 |
|---|---|---|---|---|
| ALL | 66 | 32 | 31 | 36 |
| 13Q GAIN MUTATED | 32 | 30 | 26 | 25 |
| 13Q GAIN WILD-TYPE | 34 | 2 | 5 | 11 |
Figure S26. Get High-res Image Gene #25: '13q gain' versus Molecular Subtype #3: 'CN_CNMF'
P value = 0.00051 (Fisher's exact test), Q value = 0.035
Table S27. Gene #25: '13q gain' versus Molecular Subtype #7: 'MRNASEQ_CNMF'
| nPatients | CLUS_1 | CLUS_2 | CLUS_3 | CLUS_4 | CLUS_5 |
|---|---|---|---|---|---|
| ALL | 29 | 14 | 33 | 28 | 60 |
| 13Q GAIN MUTATED | 19 | 11 | 16 | 27 | 39 |
| 13Q GAIN WILD-TYPE | 10 | 3 | 17 | 1 | 21 |
Figure S27. Get High-res Image Gene #25: '13q gain' versus Molecular Subtype #7: 'MRNASEQ_CNMF'
P value = 0.00047 (Fisher's exact test), Q value = 0.035
Table S28. Gene #25: '13q gain' versus Molecular Subtype #8: 'MRNASEQ_CHIERARCHICAL'
| nPatients | CLUS_1 | CLUS_2 | CLUS_3 | CLUS_4 | CLUS_5 | CLUS_6 | CLUS_7 |
|---|---|---|---|---|---|---|---|
| ALL | 27 | 36 | 12 | 19 | 32 | 18 | 20 |
| 13Q GAIN MUTATED | 21 | 25 | 7 | 17 | 25 | 4 | 13 |
| 13Q GAIN WILD-TYPE | 6 | 11 | 5 | 2 | 7 | 14 | 7 |
Figure S28. Get High-res Image Gene #25: '13q gain' versus Molecular Subtype #8: 'MRNASEQ_CHIERARCHICAL'
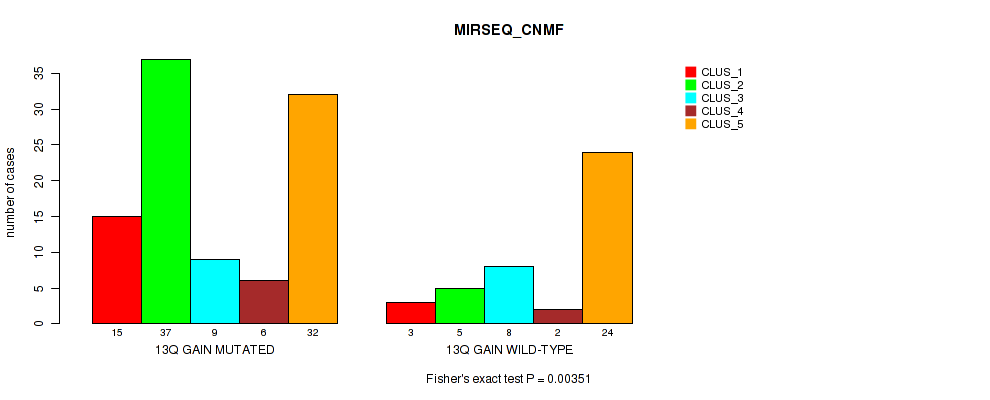
P value = 0.00351 (Fisher's exact test), Q value = 0.1
Table S29. Gene #25: '13q gain' versus Molecular Subtype #9: 'MIRSEQ_CNMF'
| nPatients | CLUS_1 | CLUS_2 | CLUS_3 | CLUS_4 | CLUS_5 |
|---|---|---|---|---|---|
| ALL | 18 | 42 | 17 | 8 | 56 |
| 13Q GAIN MUTATED | 15 | 37 | 9 | 6 | 32 |
| 13Q GAIN WILD-TYPE | 3 | 5 | 8 | 2 | 24 |
Figure S29. Get High-res Image Gene #25: '13q gain' versus Molecular Subtype #9: 'MIRSEQ_CNMF'
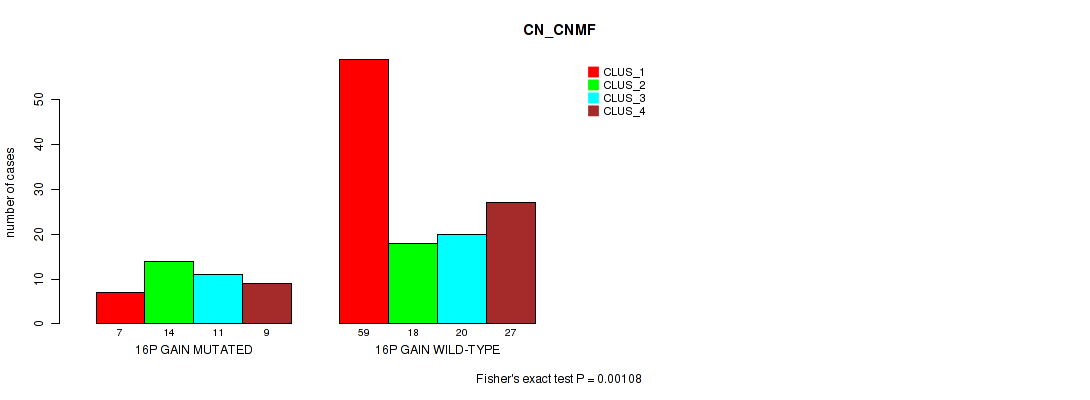
P value = 0.00108 (Fisher's exact test), Q value = 0.058
Table S30. Gene #28: '16p gain' versus Molecular Subtype #3: 'CN_CNMF'
| nPatients | CLUS_1 | CLUS_2 | CLUS_3 | CLUS_4 |
|---|---|---|---|---|
| ALL | 66 | 32 | 31 | 36 |
| 16P GAIN MUTATED | 7 | 14 | 11 | 9 |
| 16P GAIN WILD-TYPE | 59 | 18 | 20 | 27 |
Figure S30. Get High-res Image Gene #28: '16p gain' versus Molecular Subtype #3: 'CN_CNMF'
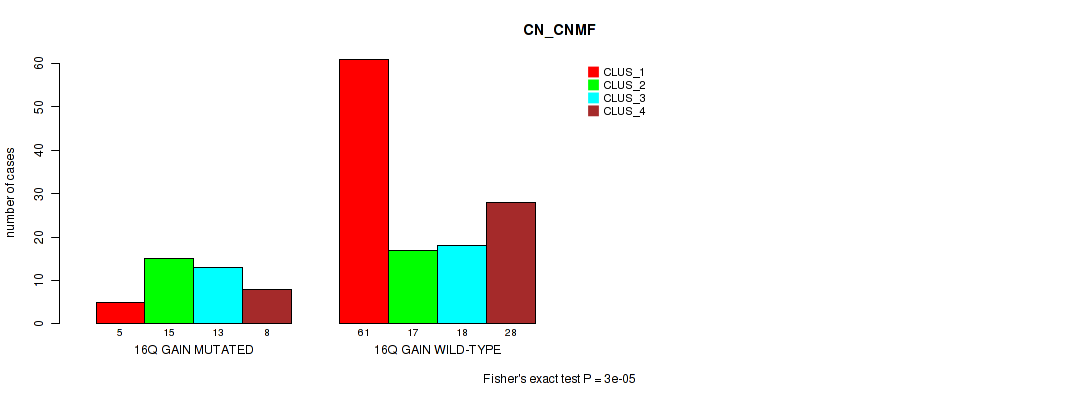
P value = 3e-05 (Fisher's exact test), Q value = 0.0058
Table S31. Gene #29: '16q gain' versus Molecular Subtype #3: 'CN_CNMF'
| nPatients | CLUS_1 | CLUS_2 | CLUS_3 | CLUS_4 |
|---|---|---|---|---|
| ALL | 66 | 32 | 31 | 36 |
| 16Q GAIN MUTATED | 5 | 15 | 13 | 8 |
| 16Q GAIN WILD-TYPE | 61 | 17 | 18 | 28 |
Figure S31. Get High-res Image Gene #29: '16q gain' versus Molecular Subtype #3: 'CN_CNMF'
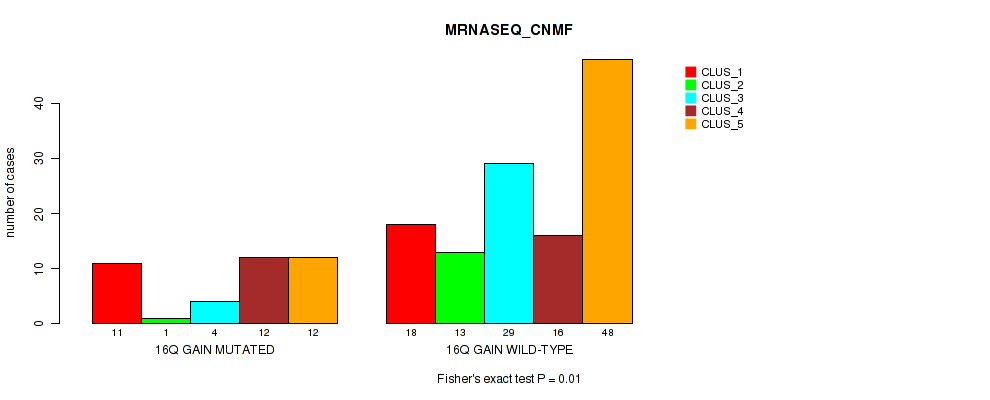
P value = 0.01 (Fisher's exact test), Q value = 0.19
Table S32. Gene #29: '16q gain' versus Molecular Subtype #7: 'MRNASEQ_CNMF'
| nPatients | CLUS_1 | CLUS_2 | CLUS_3 | CLUS_4 | CLUS_5 |
|---|---|---|---|---|---|
| ALL | 29 | 14 | 33 | 28 | 60 |
| 16Q GAIN MUTATED | 11 | 1 | 4 | 12 | 12 |
| 16Q GAIN WILD-TYPE | 18 | 13 | 29 | 16 | 48 |
Figure S32. Get High-res Image Gene #29: '16q gain' versus Molecular Subtype #7: 'MRNASEQ_CNMF'
P value = 0.00703 (Fisher's exact test), Q value = 0.17
Table S33. Gene #31: '17q gain' versus Molecular Subtype #3: 'CN_CNMF'
| nPatients | CLUS_1 | CLUS_2 | CLUS_3 | CLUS_4 |
|---|---|---|---|---|
| ALL | 66 | 32 | 31 | 36 |
| 17Q GAIN MUTATED | 9 | 3 | 13 | 7 |
| 17Q GAIN WILD-TYPE | 57 | 29 | 18 | 29 |
Figure S33. Get High-res Image Gene #31: '17q gain' versus Molecular Subtype #3: 'CN_CNMF'

P value = 0.0074 (Fisher's exact test), Q value = 0.17
Table S34. Gene #37: '20q gain' versus Molecular Subtype #1: 'MRNA_CNMF'
| nPatients | CLUS_1 | CLUS_2 | CLUS_3 |
|---|---|---|---|
| ALL | 25 | 22 | 22 |
| 20Q GAIN MUTATED | 22 | 15 | 22 |
| 20Q GAIN WILD-TYPE | 3 | 7 | 0 |
Figure S34. Get High-res Image Gene #37: '20q gain' versus Molecular Subtype #1: 'MRNA_CNMF'
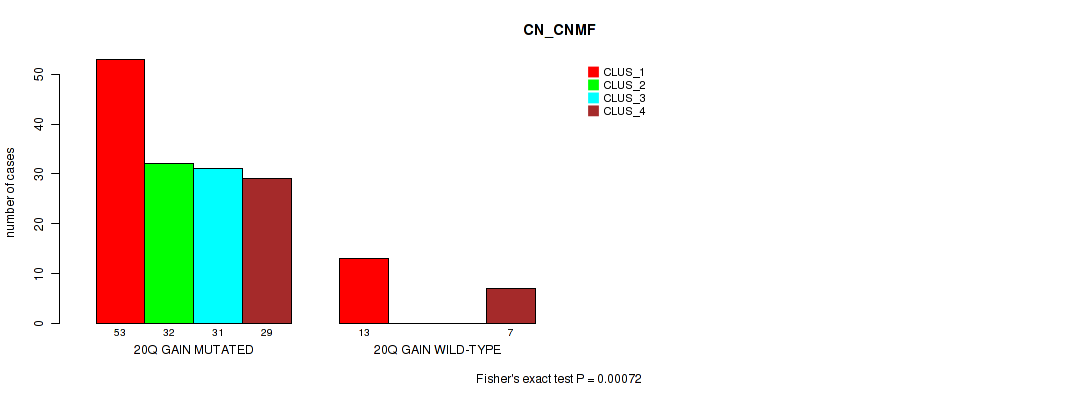
P value = 0.00072 (Fisher's exact test), Q value = 0.043
Table S35. Gene #37: '20q gain' versus Molecular Subtype #3: 'CN_CNMF'
| nPatients | CLUS_1 | CLUS_2 | CLUS_3 | CLUS_4 |
|---|---|---|---|---|
| ALL | 66 | 32 | 31 | 36 |
| 20Q GAIN MUTATED | 53 | 32 | 31 | 29 |
| 20Q GAIN WILD-TYPE | 13 | 0 | 0 | 7 |
Figure S35. Get High-res Image Gene #37: '20q gain' versus Molecular Subtype #3: 'CN_CNMF'
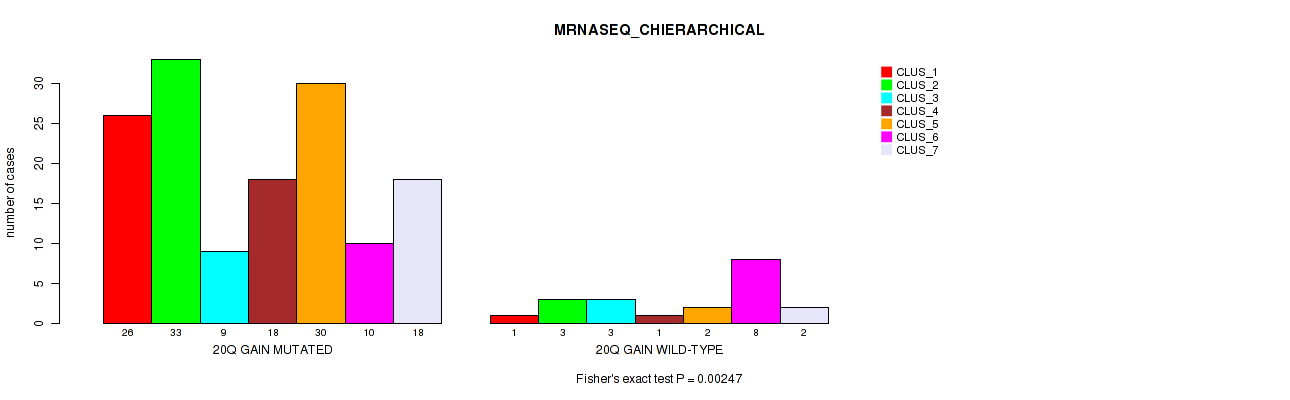
P value = 0.00247 (Fisher's exact test), Q value = 0.083
Table S36. Gene #37: '20q gain' versus Molecular Subtype #8: 'MRNASEQ_CHIERARCHICAL'
| nPatients | CLUS_1 | CLUS_2 | CLUS_3 | CLUS_4 | CLUS_5 | CLUS_6 | CLUS_7 |
|---|---|---|---|---|---|---|---|
| ALL | 27 | 36 | 12 | 19 | 32 | 18 | 20 |
| 20Q GAIN MUTATED | 26 | 33 | 9 | 18 | 30 | 10 | 18 |
| 20Q GAIN WILD-TYPE | 1 | 3 | 3 | 1 | 2 | 8 | 2 |
Figure S36. Get High-res Image Gene #37: '20q gain' versus Molecular Subtype #8: 'MRNASEQ_CHIERARCHICAL'
P value = 0.0109 (Fisher's exact test), Q value = 0.21
Table S37. Gene #40: 'xp gain' versus Molecular Subtype #1: 'MRNA_CNMF'
| nPatients | CLUS_1 | CLUS_2 | CLUS_3 |
|---|---|---|---|
| ALL | 25 | 22 | 22 |
| XP GAIN MUTATED | 4 | 1 | 9 |
| XP GAIN WILD-TYPE | 21 | 21 | 13 |
Figure S37. Get High-res Image Gene #40: 'xp gain' versus Molecular Subtype #1: 'MRNA_CNMF'
P value = 0.00384 (Fisher's exact test), Q value = 0.11
Table S38. Gene #44: '2p loss' versus Molecular Subtype #3: 'CN_CNMF'
| nPatients | CLUS_1 | CLUS_2 | CLUS_3 | CLUS_4 |
|---|---|---|---|---|
| ALL | 66 | 32 | 31 | 36 |
| 2P LOSS MUTATED | 0 | 5 | 2 | 4 |
| 2P LOSS WILD-TYPE | 66 | 27 | 29 | 32 |
Figure S38. Get High-res Image Gene #44: '2p loss' versus Molecular Subtype #3: 'CN_CNMF'
P value = 0.00942 (Fisher's exact test), Q value = 0.18
Table S39. Gene #47: '3q loss' versus Molecular Subtype #10: 'MIRSEQ_CHIERARCHICAL'
| nPatients | CLUS_1 | CLUS_2 | CLUS_3 |
|---|---|---|---|
| ALL | 22 | 63 | 56 |
| 3Q LOSS MUTATED | 5 | 4 | 1 |
| 3Q LOSS WILD-TYPE | 17 | 59 | 55 |
Figure S39. Get High-res Image Gene #47: '3q loss' versus Molecular Subtype #10: 'MIRSEQ_CHIERARCHICAL'
P value = 0.00196 (Fisher's exact test), Q value = 0.083
Table S40. Gene #48: '4p loss' versus Molecular Subtype #3: 'CN_CNMF'
| nPatients | CLUS_1 | CLUS_2 | CLUS_3 | CLUS_4 |
|---|---|---|---|---|
| ALL | 66 | 32 | 31 | 36 |
| 4P LOSS MUTATED | 15 | 20 | 12 | 12 |
| 4P LOSS WILD-TYPE | 51 | 12 | 19 | 24 |
Figure S40. Get High-res Image Gene #48: '4p loss' versus Molecular Subtype #3: 'CN_CNMF'
P value = 0.00106 (Fisher's exact test), Q value = 0.058
Table S41. Gene #49: '4q loss' versus Molecular Subtype #3: 'CN_CNMF'
| nPatients | CLUS_1 | CLUS_2 | CLUS_3 | CLUS_4 |
|---|---|---|---|---|
| ALL | 66 | 32 | 31 | 36 |
| 4Q LOSS MUTATED | 16 | 21 | 14 | 15 |
| 4Q LOSS WILD-TYPE | 50 | 11 | 17 | 21 |
Figure S41. Get High-res Image Gene #49: '4q loss' versus Molecular Subtype #3: 'CN_CNMF'
P value = 0.0117 (Fisher's exact test), Q value = 0.22
Table S42. Gene #51: '5q loss' versus Molecular Subtype #2: 'MRNA_CHIERARCHICAL'
| nPatients | CLUS_1 | CLUS_2 | CLUS_3 | CLUS_4 | CLUS_5 | CLUS_6 | CLUS_7 | CLUS_8 |
|---|---|---|---|---|---|---|---|---|
| ALL | 6 | 13 | 13 | 9 | 8 | 9 | 8 | 3 |
| 5Q LOSS MUTATED | 0 | 3 | 1 | 6 | 3 | 0 | 2 | 0 |
| 5Q LOSS WILD-TYPE | 6 | 10 | 12 | 3 | 5 | 9 | 6 | 3 |
Figure S42. Get High-res Image Gene #51: '5q loss' versus Molecular Subtype #2: 'MRNA_CHIERARCHICAL'
P value = 0.0132 (Fisher's exact test), Q value = 0.24
Table S43. Gene #53: '6q loss' versus Molecular Subtype #11: 'MIRSEQ_MATURE_CNMF'
| nPatients | CLUS_1 | CLUS_2 | CLUS_3 | CLUS_4 |
|---|---|---|---|---|
| ALL | 9 | 14 | 14 | 13 |
| 6Q LOSS MUTATED | 0 | 0 | 4 | 0 |
| 6Q LOSS WILD-TYPE | 9 | 14 | 10 | 13 |
Figure S43. Get High-res Image Gene #53: '6q loss' versus Molecular Subtype #11: 'MIRSEQ_MATURE_CNMF'
P value = 0.00166 (Fisher's exact test), Q value = 0.08
Table S44. Gene #58: '9q loss' versus Molecular Subtype #10: 'MIRSEQ_CHIERARCHICAL'
| nPatients | CLUS_1 | CLUS_2 | CLUS_3 |
|---|---|---|---|
| ALL | 22 | 63 | 56 |
| 9Q LOSS MUTATED | 9 | 5 | 7 |
| 9Q LOSS WILD-TYPE | 13 | 58 | 49 |
Figure S44. Get High-res Image Gene #58: '9q loss' versus Molecular Subtype #10: 'MIRSEQ_CHIERARCHICAL'
P value = 0.00603 (Fisher's exact test), Q value = 0.16
Table S45. Gene #61: '11p loss' versus Molecular Subtype #3: 'CN_CNMF'
| nPatients | CLUS_1 | CLUS_2 | CLUS_3 | CLUS_4 |
|---|---|---|---|---|
| ALL | 66 | 32 | 31 | 36 |
| 11P LOSS MUTATED | 5 | 8 | 1 | 9 |
| 11P LOSS WILD-TYPE | 61 | 24 | 30 | 27 |
Figure S45. Get High-res Image Gene #61: '11p loss' versus Molecular Subtype #3: 'CN_CNMF'
P value = 0.00698 (Fisher's exact test), Q value = 0.17
Table S46. Gene #62: '11q loss' versus Molecular Subtype #3: 'CN_CNMF'
| nPatients | CLUS_1 | CLUS_2 | CLUS_3 | CLUS_4 |
|---|---|---|---|---|
| ALL | 66 | 32 | 31 | 36 |
| 11Q LOSS MUTATED | 9 | 9 | 1 | 11 |
| 11Q LOSS WILD-TYPE | 57 | 23 | 30 | 25 |
Figure S46. Get High-res Image Gene #62: '11q loss' versus Molecular Subtype #3: 'CN_CNMF'
P value = 0.00839 (Fisher's exact test), Q value = 0.17
Table S47. Gene #62: '11q loss' versus Molecular Subtype #7: 'MRNASEQ_CNMF'
| nPatients | CLUS_1 | CLUS_2 | CLUS_3 | CLUS_4 | CLUS_5 |
|---|---|---|---|---|---|
| ALL | 29 | 14 | 33 | 28 | 60 |
| 11Q LOSS MUTATED | 3 | 5 | 11 | 1 | 10 |
| 11Q LOSS WILD-TYPE | 26 | 9 | 22 | 27 | 50 |
Figure S47. Get High-res Image Gene #62: '11q loss' versus Molecular Subtype #7: 'MRNASEQ_CNMF'
P value = 0.00838 (Fisher's exact test), Q value = 0.17
Table S48. Gene #62: '11q loss' versus Molecular Subtype #8: 'MRNASEQ_CHIERARCHICAL'
| nPatients | CLUS_1 | CLUS_2 | CLUS_3 | CLUS_4 | CLUS_5 | CLUS_6 | CLUS_7 |
|---|---|---|---|---|---|---|---|
| ALL | 27 | 36 | 12 | 19 | 32 | 18 | 20 |
| 11Q LOSS MUTATED | 1 | 11 | 4 | 2 | 2 | 6 | 4 |
| 11Q LOSS WILD-TYPE | 26 | 25 | 8 | 17 | 30 | 12 | 16 |
Figure S48. Get High-res Image Gene #62: '11q loss' versus Molecular Subtype #8: 'MRNASEQ_CHIERARCHICAL'
P value = 0.00048 (Fisher's exact test), Q value = 0.035
Table S49. Gene #67: '15q loss' versus Molecular Subtype #3: 'CN_CNMF'
| nPatients | CLUS_1 | CLUS_2 | CLUS_3 | CLUS_4 |
|---|---|---|---|---|
| ALL | 66 | 32 | 31 | 36 |
| 15Q LOSS MUTATED | 17 | 21 | 15 | 20 |
| 15Q LOSS WILD-TYPE | 49 | 11 | 16 | 16 |
Figure S49. Get High-res Image Gene #67: '15q loss' versus Molecular Subtype #3: 'CN_CNMF'
P value = 0.00133 (Fisher's exact test), Q value = 0.067
Table S50. Gene #72: '18p loss' versus Molecular Subtype #3: 'CN_CNMF'
| nPatients | CLUS_1 | CLUS_2 | CLUS_3 | CLUS_4 |
|---|---|---|---|---|
| ALL | 66 | 32 | 31 | 36 |
| 18P LOSS MUTATED | 42 | 26 | 30 | 30 |
| 18P LOSS WILD-TYPE | 24 | 6 | 1 | 6 |
Figure S50. Get High-res Image Gene #72: '18p loss' versus Molecular Subtype #3: 'CN_CNMF'
P value = 6e-05 (Fisher's exact test), Q value = 0.0072
Table S51. Gene #73: '18q loss' versus Molecular Subtype #3: 'CN_CNMF'
| nPatients | CLUS_1 | CLUS_2 | CLUS_3 | CLUS_4 |
|---|---|---|---|---|
| ALL | 66 | 32 | 31 | 36 |
| 18Q LOSS MUTATED | 45 | 28 | 31 | 34 |
| 18Q LOSS WILD-TYPE | 21 | 4 | 0 | 2 |
Figure S51. Get High-res Image Gene #73: '18q loss' versus Molecular Subtype #3: 'CN_CNMF'
P value = 0.012 (Fisher's exact test), Q value = 0.22
Table S52. Gene #73: '18q loss' versus Molecular Subtype #4: 'METHLYATION_CNMF'
| nPatients | CLUS_1 | CLUS_2 | CLUS_3 |
|---|---|---|---|
| ALL | 28 | 39 | 29 |
| 18Q LOSS MUTATED | 28 | 30 | 25 |
| 18Q LOSS WILD-TYPE | 0 | 9 | 4 |
Figure S52. Get High-res Image Gene #73: '18q loss' versus Molecular Subtype #4: 'METHLYATION_CNMF'
P value = 0.00845 (Fisher's exact test), Q value = 0.17
Table S53. Gene #75: '19q loss' versus Molecular Subtype #10: 'MIRSEQ_CHIERARCHICAL'
| nPatients | CLUS_1 | CLUS_2 | CLUS_3 |
|---|---|---|---|
| ALL | 22 | 63 | 56 |
| 19Q LOSS MUTATED | 7 | 8 | 3 |
| 19Q LOSS WILD-TYPE | 15 | 55 | 53 |
Figure S53. Get High-res Image Gene #75: '19q loss' versus Molecular Subtype #10: 'MIRSEQ_CHIERARCHICAL'
P value = 0.00614 (Fisher's exact test), Q value = 0.16
Table S54. Gene #78: '22q loss' versus Molecular Subtype #9: 'MIRSEQ_CNMF'
| nPatients | CLUS_1 | CLUS_2 | CLUS_3 | CLUS_4 | CLUS_5 |
|---|---|---|---|---|---|
| ALL | 18 | 42 | 17 | 8 | 56 |
| 22Q LOSS MUTATED | 4 | 24 | 2 | 4 | 20 |
| 22Q LOSS WILD-TYPE | 14 | 18 | 15 | 4 | 36 |
Figure S54. Get High-res Image Gene #78: '22q loss' versus Molecular Subtype #9: 'MIRSEQ_CNMF'
-
Copy number data file = broad_values_by_arm.txt from GISTIC pipeline
-
Processed Copy number data file = /xchip/cga/gdac-prod/tcga-gdac/jobResults/GDAC_Correlate_Genomic_Events_Preprocess/READ-TP/15096456/transformed.cor.cli.txt
-
Molecular subtypes file = /xchip/cga/gdac-prod/tcga-gdac/jobResults/GDAC_mergedClustering/READ-TP/15107799/READ-TP.transferedmergedcluster.txt
-
Number of patients = 165
-
Number of significantly arm-level cnvs = 80
-
Number of molecular subtypes = 12
-
Exclude genes that fewer than K tumors have mutations, K = 3
For binary or multi-class clinical features (nominal or ordinal), two-tailed Fisher's exact tests (Fisher 1922) were used to estimate the P values using the 'fisher.test' function in R
For multiple hypothesis correction, Q value is the False Discovery Rate (FDR) analogue of the P value (Benjamini and Hochberg 1995), defined as the minimum FDR at which the test may be called significant. We used the 'Benjamini and Hochberg' method of 'p.adjust' function in R to convert P values into Q values.
In addition to the links below, the full results of the analysis summarized in this report can also be downloaded programmatically using firehose_get, or interactively from either the Broad GDAC website or TCGA Data Coordination Center Portal.