This pipeline computes the correlation between significant arm-level copy number variations (cnvs) and selected clinical features.
Testing the association between copy number variation 74 arm-level events and 8 clinical features across 133 patients, 10 significant findings detected with Q value < 0.25.
-
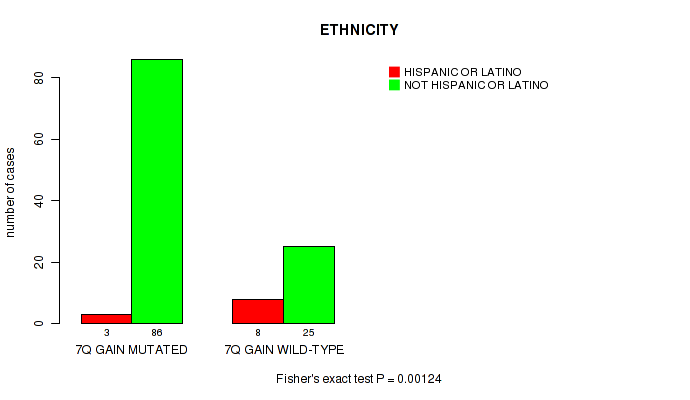
7q gain cnv correlated to 'ETHNICITY'.
-
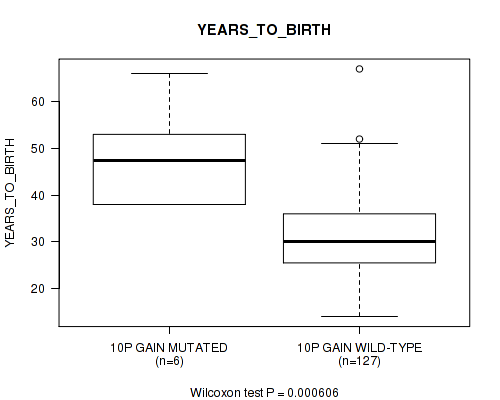
10p gain cnv correlated to 'YEARS_TO_BIRTH'.
-
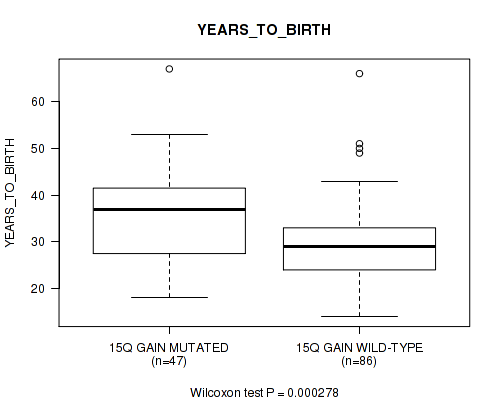
15q gain cnv correlated to 'YEARS_TO_BIRTH'.
-
19p gain cnv correlated to 'YEARS_TO_BIRTH'.
-
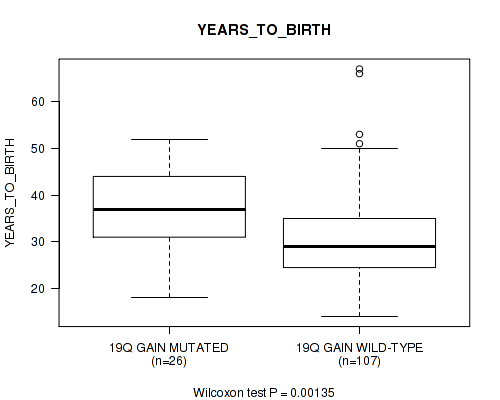
19q gain cnv correlated to 'YEARS_TO_BIRTH'.
-
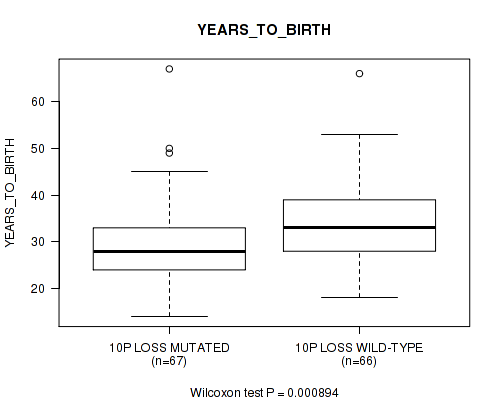
10p loss cnv correlated to 'YEARS_TO_BIRTH'.
-
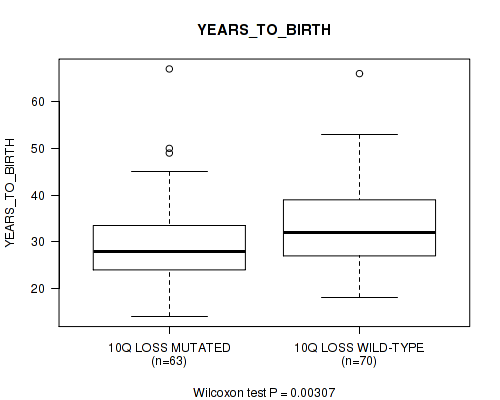
10q loss cnv correlated to 'YEARS_TO_BIRTH'.
-
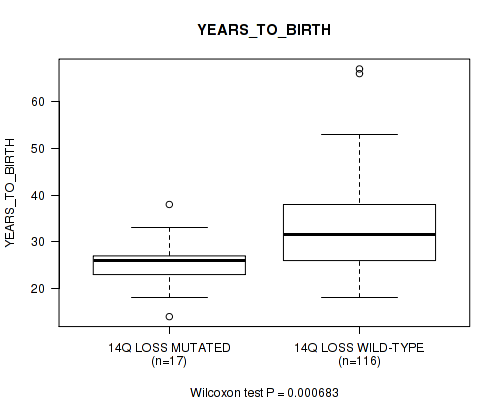
14q loss cnv correlated to 'YEARS_TO_BIRTH'.
-
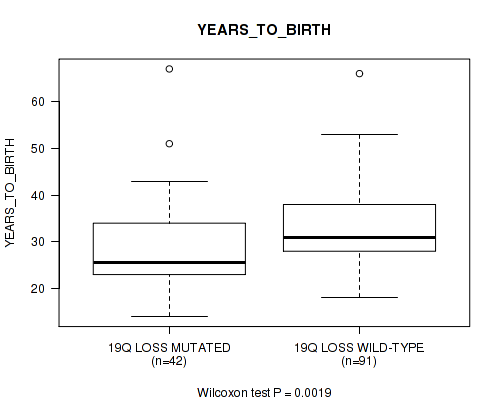
19q loss cnv correlated to 'YEARS_TO_BIRTH' and 'NEOPLASM_DISEASESTAGE'.
Table 1. Get Full Table Overview of the association between significant copy number variation of 74 arm-level events and 8 clinical features. Shown in the table are P values (Q values). Thresholded by Q value < 0.25, 10 significant findings detected.
|
Clinical Features |
Time to Death |
YEARS TO BIRTH |
NEOPLASM DISEASESTAGE |
PATHOLOGY T STAGE |
PATHOLOGY N STAGE |
PATHOLOGY M STAGE |
RACE | ETHNICITY | ||
| nCNV (%) | nWild-Type | logrank test | Wilcoxon-test | Fisher's exact test | Fisher's exact test | Fisher's exact test | Fisher's exact test | Fisher's exact test | Fisher's exact test | |
| 19q loss | 42 (32%) | 91 |
0.905 (1.00) |
0.0019 (0.125) |
0.00022 (0.0824) |
0.158 (1.00) |
0.105 (0.957) |
0.598 (1.00) |
1 (1.00) |
1 (1.00) |
| 7q gain | 96 (72%) | 37 |
0.825 (1.00) |
0.938 (1.00) |
0.275 (1.00) |
0.059 (0.76) |
1 (1.00) |
1 (1.00) |
0.859 (1.00) |
0.00124 (0.0997) |
| 10p gain | 6 (5%) | 127 |
0.769 (1.00) |
0.000606 (0.0882) |
0.95 (1.00) |
0.174 (1.00) |
1 (1.00) |
0.337 (1.00) |
1 (1.00) |
|
| 15q gain | 47 (35%) | 86 |
0.928 (1.00) |
0.000278 (0.0824) |
0.217 (1.00) |
0.95 (1.00) |
1 (1.00) |
0.295 (1.00) |
1 (1.00) |
0.325 (1.00) |
| 19p gain | 32 (24%) | 101 |
0.353 (1.00) |
0.000861 (0.0882) |
0.153 (1.00) |
0.467 (1.00) |
0.668 (1.00) |
0.571 (1.00) |
1 (1.00) |
0.461 (1.00) |
| 19q gain | 26 (20%) | 107 |
0.432 (1.00) |
0.00135 (0.0997) |
0.181 (1.00) |
0.296 (1.00) |
1 (1.00) |
1 (1.00) |
0.827 (1.00) |
0.224 (1.00) |
| 10p loss | 67 (50%) | 66 |
0.589 (1.00) |
0.000894 (0.0882) |
0.0532 (0.76) |
0.307 (1.00) |
0.0575 (0.76) |
0.619 (1.00) |
0.0889 (0.903) |
0.758 (1.00) |
| 10q loss | 63 (47%) | 70 |
0.524 (1.00) |
0.00307 (0.181) |
0.0584 (0.76) |
0.408 (1.00) |
0.0303 (0.718) |
0.337 (1.00) |
0.697 (1.00) |
0.0571 (0.76) |
| 14q loss | 17 (13%) | 116 |
0.489 (1.00) |
0.000683 (0.0882) |
0.222 (1.00) |
0.524 (1.00) |
0.0623 (0.768) |
0.377 (1.00) |
1 (1.00) |
0.614 (1.00) |
| 1p gain | 32 (24%) | 101 |
0.339 (1.00) |
0.123 (1.00) |
0.4 (1.00) |
0.0691 (0.786) |
0.187 (1.00) |
1 (1.00) |
0.713 (1.00) |
0.468 (1.00) |
| 1q gain | 54 (41%) | 79 |
0.774 (1.00) |
0.364 (1.00) |
0.249 (1.00) |
0.0169 (0.543) |
0.362 (1.00) |
0.636 (1.00) |
0.516 (1.00) |
0.0506 (0.76) |
| 2p gain | 39 (29%) | 94 |
0.889 (1.00) |
0.791 (1.00) |
0.982 (1.00) |
0.453 (1.00) |
0.517 (1.00) |
1 (1.00) |
1 (1.00) |
1 (1.00) |
| 2q gain | 38 (29%) | 95 |
0.841 (1.00) |
0.213 (1.00) |
0.995 (1.00) |
0.42 (1.00) |
0.735 (1.00) |
1 (1.00) |
0.858 (1.00) |
0.725 (1.00) |
| 3p gain | 23 (17%) | 110 |
0.447 (1.00) |
0.299 (1.00) |
0.928 (1.00) |
0.443 (1.00) |
1 (1.00) |
0.133 (1.00) |
0.64 (1.00) |
0.4 (1.00) |
| 3q gain | 31 (23%) | 102 |
0.635 (1.00) |
0.831 (1.00) |
0.454 (1.00) |
0.0336 (0.76) |
0.481 (1.00) |
0.21 (1.00) |
0.838 (1.00) |
1 (1.00) |
| 4p gain | 3 (2%) | 130 |
0.804 (1.00) |
0.611 (1.00) |
0.861 (1.00) |
0.366 (1.00) |
1 (1.00) |
0.219 (1.00) |
1 (1.00) |
|
| 5p gain | 6 (5%) | 127 |
0.694 (1.00) |
0.0205 (0.579) |
0.447 (1.00) |
0.413 (1.00) |
0.533 (1.00) |
1 (1.00) |
1 (1.00) |
0.44 (1.00) |
| 5q gain | 3 (2%) | 130 |
0.81 (1.00) |
0.103 (0.953) |
0.124 (1.00) |
1 (1.00) |
1 (1.00) |
0.249 (1.00) |
||
| 6p gain | 21 (16%) | 112 |
0.449 (1.00) |
0.345 (1.00) |
0.68 (1.00) |
0.594 (1.00) |
1 (1.00) |
0.529 (1.00) |
0.466 (1.00) |
0.386 (1.00) |
| 6q gain | 17 (13%) | 116 |
0.494 (1.00) |
0.613 (1.00) |
0.277 (1.00) |
0.326 (1.00) |
0.643 (1.00) |
0.468 (1.00) |
0.547 (1.00) |
0.182 (1.00) |
| 7p gain | 110 (83%) | 23 |
0.433 (1.00) |
0.981 (1.00) |
0.679 (1.00) |
1 (1.00) |
1 (1.00) |
0.529 (1.00) |
0.807 (1.00) |
0.0174 (0.543) |
| 8p gain | 101 (76%) | 32 |
0.339 (1.00) |
0.487 (1.00) |
0.708 (1.00) |
1 (1.00) |
1 (1.00) |
0.037 (0.76) |
0.843 (1.00) |
1 (1.00) |
| 8q gain | 103 (77%) | 30 |
0.333 (1.00) |
0.242 (1.00) |
0.393 (1.00) |
0.521 (1.00) |
1 (1.00) |
0.0295 (0.718) |
0.705 (1.00) |
0.245 (1.00) |
| 9p gain | 14 (11%) | 119 |
0.573 (1.00) |
0.552 (1.00) |
0.607 (1.00) |
0.335 (1.00) |
1 (1.00) |
1 (1.00) |
0.0767 (0.826) |
|
| 9q gain | 15 (11%) | 118 |
0.506 (1.00) |
0.279 (1.00) |
0.235 (1.00) |
0.896 (1.00) |
1 (1.00) |
0.353 (1.00) |
0.331 (1.00) |
1 (1.00) |
| 10q gain | 8 (6%) | 125 |
0.689 (1.00) |
0.00745 (0.314) |
0.927 (1.00) |
0.261 (1.00) |
1 (1.00) |
1 (1.00) |
1 (1.00) |
0.493 (1.00) |
| 11p gain | 9 (7%) | 124 |
0.62 (1.00) |
0.693 (1.00) |
0.327 (1.00) |
0.666 (1.00) |
1 (1.00) |
1 (1.00) |
1 (1.00) |
1 (1.00) |
| 11q gain | 4 (3%) | 129 |
0.75 (1.00) |
0.678 (1.00) |
0.149 (1.00) |
1 (1.00) |
1 (1.00) |
1 (1.00) |
1 (1.00) |
|
| 12p gain | 129 (97%) | 4 |
0.765 (1.00) |
0.958 (1.00) |
0.173 (1.00) |
0.709 (1.00) |
1 (1.00) |
1 (1.00) |
1 (1.00) |
|
| 12q gain | 90 (68%) | 43 |
0.166 (1.00) |
0.0529 (0.76) |
0.239 (1.00) |
0.468 (1.00) |
0.738 (1.00) |
1 (1.00) |
0.571 (1.00) |
0.5 (1.00) |
| 14q gain | 45 (34%) | 88 |
0.182 (1.00) |
0.092 (0.908) |
0.186 (1.00) |
0.95 (1.00) |
0.307 (1.00) |
1 (1.00) |
1 (1.00) |
0.325 (1.00) |
| 16p gain | 13 (10%) | 120 |
0.195 (1.00) |
0.585 (1.00) |
0.684 (1.00) |
0.0891 (0.903) |
0.643 (1.00) |
0.328 (1.00) |
0.671 (1.00) |
0.259 (1.00) |
| 16q gain | 13 (10%) | 120 |
0.224 (1.00) |
0.262 (1.00) |
0.682 (1.00) |
0.168 (1.00) |
0.643 (1.00) |
0.328 (1.00) |
0.673 (1.00) |
0.259 (1.00) |
| 17p gain | 32 (24%) | 101 |
0.84 (1.00) |
0.216 (1.00) |
0.143 (1.00) |
0.164 (1.00) |
0.513 (1.00) |
0.282 (1.00) |
0.608 (1.00) |
0.728 (1.00) |
| 17q gain | 43 (32%) | 90 |
0.259 (1.00) |
0.355 (1.00) |
0.27 (1.00) |
0.337 (1.00) |
1 (1.00) |
0.598 (1.00) |
0.314 (1.00) |
1 (1.00) |
| 18p gain | 4 (3%) | 129 |
0.815 (1.00) |
0.812 (1.00) |
0.371 (1.00) |
1 (1.00) |
1 (1.00) |
1 (1.00) |
0.129 (1.00) |
1 (1.00) |
| 20p gain | 30 (23%) | 103 |
0.678 (1.00) |
0.614 (1.00) |
0.144 (1.00) |
0.00795 (0.314) |
0.426 (1.00) |
0.197 (1.00) |
0.839 (1.00) |
1 (1.00) |
| 20q gain | 33 (25%) | 100 |
0.804 (1.00) |
0.673 (1.00) |
0.0567 (0.76) |
0.0364 (0.76) |
0.712 (1.00) |
0.224 (1.00) |
0.604 (1.00) |
0.454 (1.00) |
| 21q gain | 112 (84%) | 21 |
0.0291 (0.718) |
0.0454 (0.76) |
0.467 (1.00) |
0.307 (1.00) |
0.713 (1.00) |
0.489 (1.00) |
0.325 (1.00) |
1 (1.00) |
| 22q gain | 34 (26%) | 99 |
0.321 (1.00) |
0.0661 (0.777) |
0.388 (1.00) |
0.217 (1.00) |
0.426 (1.00) |
0.572 (1.00) |
0.716 (1.00) |
0.726 (1.00) |
| xp gain | 18 (14%) | 115 |
0.469 (1.00) |
0.153 (1.00) |
0.732 (1.00) |
0.681 (1.00) |
0.185 (1.00) |
0.11 (0.984) |
1 (1.00) |
0.665 (1.00) |
| xq gain | 18 (14%) | 115 |
0.469 (1.00) |
0.09 (0.903) |
0.622 (1.00) |
0.431 (1.00) |
0.0979 (0.934) |
0.489 (1.00) |
1 (1.00) |
0.665 (1.00) |
| 1p loss | 17 (13%) | 116 |
0.00484 (0.26) |
0.713 (1.00) |
0.905 (1.00) |
0.361 (1.00) |
0.671 (1.00) |
1 (1.00) |
0.229 (1.00) |
1 (1.00) |
| 1q loss | 8 (6%) | 125 |
0.061 (0.768) |
0.529 (1.00) |
0.908 (1.00) |
0.15 (1.00) |
0.576 (1.00) |
1 (1.00) |
0.0503 (0.76) |
1 (1.00) |
| 2p loss | 5 (4%) | 128 |
0.741 (1.00) |
0.749 (1.00) |
0.255 (1.00) |
0.266 (1.00) |
1 (1.00) |
1 (1.00) |
0.382 (1.00) |
|
| 2q loss | 6 (5%) | 127 |
0.683 (1.00) |
1 (1.00) |
0.103 (0.953) |
0.549 (1.00) |
0.119 (1.00) |
1 (1.00) |
1 (1.00) |
0.44 (1.00) |
| 3p loss | 30 (23%) | 103 |
0.691 (1.00) |
0.0537 (0.76) |
0.397 (1.00) |
0.592 (1.00) |
0.712 (1.00) |
0.577 (1.00) |
0.168 (1.00) |
0.706 (1.00) |
| 3q loss | 22 (17%) | 111 |
0.429 (1.00) |
0.146 (1.00) |
0.557 (1.00) |
0.553 (1.00) |
0.268 (1.00) |
1 (1.00) |
0.276 (1.00) |
1 (1.00) |
| 4p loss | 83 (62%) | 50 |
0.193 (1.00) |
0.174 (1.00) |
0.312 (1.00) |
0.137 (1.00) |
0.334 (1.00) |
1 (1.00) |
0.875 (1.00) |
0.532 (1.00) |
| 4q loss | 98 (74%) | 35 |
0.301 (1.00) |
0.183 (1.00) |
0.32 (1.00) |
0.0457 (0.76) |
0.0259 (0.698) |
1 (1.00) |
0.117 (1.00) |
1 (1.00) |
| 5p loss | 92 (69%) | 41 |
0.983 (1.00) |
0.729 (1.00) |
0.398 (1.00) |
0.0184 (0.545) |
1 (1.00) |
0.585 (1.00) |
0.648 (1.00) |
0.734 (1.00) |
| 5q loss | 90 (68%) | 43 |
0.958 (1.00) |
0.763 (1.00) |
0.0506 (0.76) |
0.0076 (0.314) |
0.334 (1.00) |
0.598 (1.00) |
0.571 (1.00) |
0.749 (1.00) |
| 6p loss | 11 (8%) | 122 |
0.59 (1.00) |
0.0443 (0.76) |
0.872 (1.00) |
0.857 (1.00) |
0.322 (1.00) |
1 (1.00) |
0.608 (1.00) |
0.586 (1.00) |
| 6q loss | 14 (11%) | 119 |
0.54 (1.00) |
0.0866 (0.903) |
0.407 (1.00) |
0.696 (1.00) |
1 (1.00) |
0.328 (1.00) |
0.671 (1.00) |
1 (1.00) |
| 8p loss | 10 (8%) | 123 |
0.62 (1.00) |
0.642 (1.00) |
0.0582 (0.76) |
0.576 (1.00) |
0.119 (1.00) |
0.0172 (0.543) |
0.529 (1.00) |
1 (1.00) |
| 8q loss | 4 (3%) | 129 |
0.75 (1.00) |
0.854 (1.00) |
0.0661 (0.777) |
0.0725 (0.795) |
0.0669 (0.777) |
0.218 (1.00) |
1 (1.00) |
|
| 9p loss | 55 (41%) | 78 |
0.754 (1.00) |
0.371 (1.00) |
0.302 (1.00) |
0.617 (1.00) |
1 (1.00) |
0.306 (1.00) |
0.466 (1.00) |
0.356 (1.00) |
| 9q loss | 50 (38%) | 83 |
0.859 (1.00) |
0.688 (1.00) |
0.499 (1.00) |
0.904 (1.00) |
1 (1.00) |
0.635 (1.00) |
0.768 (1.00) |
0.528 (1.00) |
| 11p loss | 88 (66%) | 45 |
0.94 (1.00) |
0.156 (1.00) |
0.953 (1.00) |
0.482 (1.00) |
0.189 (1.00) |
1 (1.00) |
1 (1.00) |
1 (1.00) |
| 11q loss | 104 (78%) | 29 |
0.343 (1.00) |
0.565 (1.00) |
0.751 (1.00) |
0.515 (1.00) |
0.0523 (0.76) |
1 (1.00) |
0.133 (1.00) |
0.451 (1.00) |
| 13q loss | 103 (77%) | 30 |
0.341 (1.00) |
0.295 (1.00) |
0.886 (1.00) |
0.134 (1.00) |
0.26 (1.00) |
1 (1.00) |
0.379 (1.00) |
1 (1.00) |
| 15q loss | 22 (17%) | 111 |
0.393 (1.00) |
0.223 (1.00) |
0.118 (1.00) |
0.725 (1.00) |
0.455 (1.00) |
0.121 (1.00) |
0.353 (1.00) |
0.69 (1.00) |
| 16p loss | 43 (32%) | 90 |
0.273 (1.00) |
1 (1.00) |
0.665 (1.00) |
0.528 (1.00) |
0.721 (1.00) |
0.304 (1.00) |
0.866 (1.00) |
0.749 (1.00) |
| 16q loss | 46 (35%) | 87 |
0.247 (1.00) |
0.923 (1.00) |
0.711 (1.00) |
0.273 (1.00) |
1 (1.00) |
0.297 (1.00) |
0.671 (1.00) |
1 (1.00) |
| 17p loss | 34 (26%) | 99 |
0.704 (1.00) |
0.194 (1.00) |
0.771 (1.00) |
0.838 (1.00) |
0.693 (1.00) |
0.571 (1.00) |
0.199 (1.00) |
0.468 (1.00) |
| 17q loss | 14 (11%) | 119 |
0.554 (1.00) |
0.357 (1.00) |
0.594 (1.00) |
0.386 (1.00) |
0.605 (1.00) |
1 (1.00) |
0.699 (1.00) |
0.605 (1.00) |
| 18p loss | 103 (77%) | 30 |
0.361 (1.00) |
0.259 (1.00) |
0.844 (1.00) |
0.241 (1.00) |
0.26 (1.00) |
1 (1.00) |
0.477 (1.00) |
1 (1.00) |
| 18q loss | 109 (82%) | 24 |
0.395 (1.00) |
0.151 (1.00) |
0.618 (1.00) |
0.0939 (0.911) |
0.432 (1.00) |
0.567 (1.00) |
0.646 (1.00) |
1 (1.00) |
| 19p loss | 40 (30%) | 93 |
0.984 (1.00) |
0.0133 (0.493) |
0.0071 (0.314) |
0.185 (1.00) |
0.0549 (0.76) |
0.585 (1.00) |
1 (1.00) |
1 (1.00) |
| 20p loss | 28 (21%) | 105 |
0.376 (1.00) |
0.697 (1.00) |
0.259 (1.00) |
0.583 (1.00) |
0.135 (1.00) |
0.21 (1.00) |
0.578 (1.00) |
0.706 (1.00) |
| 20q loss | 15 (11%) | 118 |
0.583 (1.00) |
0.237 (1.00) |
0.457 (1.00) |
0.273 (1.00) |
0.605 (1.00) |
0.424 (1.00) |
1 (1.00) |
0.624 (1.00) |
| 22q loss | 38 (29%) | 95 |
0.824 (1.00) |
0.512 (1.00) |
0.0388 (0.76) |
0.0714 (0.795) |
0.509 (1.00) |
0.311 (1.00) |
0.231 (1.00) |
0.497 (1.00) |
| xp loss | 23 (17%) | 110 |
0.449 (1.00) |
0.71 (1.00) |
0.23 (1.00) |
0.617 (1.00) |
0.185 (1.00) |
1 (1.00) |
0.808 (1.00) |
0.4 (1.00) |
| xq loss | 23 (17%) | 110 |
0.449 (1.00) |
0.896 (1.00) |
0.327 (1.00) |
0.404 (1.00) |
0.18 (1.00) |
0.529 (1.00) |
0.808 (1.00) |
0.4 (1.00) |
P value = 0.00124 (Fisher's exact test), Q value = 0.1
Table S1. Gene #13: '7q gain' versus Clinical Feature #8: 'ETHNICITY'
| nPatients | HISPANIC OR LATINO | NOT HISPANIC OR LATINO |
|---|---|---|
| ALL | 11 | 111 |
| 7Q GAIN MUTATED | 3 | 86 |
| 7Q GAIN WILD-TYPE | 8 | 25 |
Figure S1. Get High-res Image Gene #13: '7q gain' versus Clinical Feature #8: 'ETHNICITY'
P value = 0.000606 (Wilcoxon-test), Q value = 0.088
Table S2. Gene #18: '10p gain' versus Clinical Feature #2: 'YEARS_TO_BIRTH'
| nPatients | Mean (Std.Dev) | |
|---|---|---|
| ALL | 133 | 32.0 (9.3) |
| 10P GAIN MUTATED | 6 | 48.3 (10.7) |
| 10P GAIN WILD-TYPE | 127 | 31.2 (8.6) |
Figure S2. Get High-res Image Gene #18: '10p gain' versus Clinical Feature #2: 'YEARS_TO_BIRTH'
P value = 0.000278 (Wilcoxon-test), Q value = 0.082
Table S3. Gene #25: '15q gain' versus Clinical Feature #2: 'YEARS_TO_BIRTH'
| nPatients | Mean (Std.Dev) | |
|---|---|---|
| ALL | 133 | 32.0 (9.3) |
| 15Q GAIN MUTATED | 47 | 35.9 (10.3) |
| 15Q GAIN WILD-TYPE | 86 | 29.8 (8.1) |
Figure S3. Get High-res Image Gene #25: '15q gain' versus Clinical Feature #2: 'YEARS_TO_BIRTH'
P value = 0.000861 (Wilcoxon-test), Q value = 0.088
Table S4. Gene #31: '19p gain' versus Clinical Feature #2: 'YEARS_TO_BIRTH'
| nPatients | Mean (Std.Dev) | |
|---|---|---|
| ALL | 133 | 32.0 (9.3) |
| 19P GAIN MUTATED | 32 | 35.9 (8.4) |
| 19P GAIN WILD-TYPE | 101 | 30.7 (9.3) |
Figure S4. Get High-res Image Gene #31: '19p gain' versus Clinical Feature #2: 'YEARS_TO_BIRTH'

P value = 0.00135 (Wilcoxon-test), Q value = 0.1
Table S5. Gene #32: '19q gain' versus Clinical Feature #2: 'YEARS_TO_BIRTH'
| nPatients | Mean (Std.Dev) | |
|---|---|---|
| ALL | 133 | 32.0 (9.3) |
| 19Q GAIN MUTATED | 26 | 36.3 (8.5) |
| 19Q GAIN WILD-TYPE | 107 | 30.9 (9.3) |
Figure S5. Get High-res Image Gene #32: '19q gain' versus Clinical Feature #2: 'YEARS_TO_BIRTH'
P value = 0.000894 (Wilcoxon-test), Q value = 0.088
Table S6. Gene #55: '10p loss' versus Clinical Feature #2: 'YEARS_TO_BIRTH'
| nPatients | Mean (Std.Dev) | |
|---|---|---|
| ALL | 133 | 32.0 (9.3) |
| 10P LOSS MUTATED | 67 | 29.5 (8.7) |
| 10P LOSS WILD-TYPE | 66 | 34.4 (9.4) |
Figure S6. Get High-res Image Gene #55: '10p loss' versus Clinical Feature #2: 'YEARS_TO_BIRTH'
P value = 0.00307 (Wilcoxon-test), Q value = 0.18
Table S7. Gene #56: '10q loss' versus Clinical Feature #2: 'YEARS_TO_BIRTH'
| nPatients | Mean (Std.Dev) | |
|---|---|---|
| ALL | 133 | 32.0 (9.3) |
| 10Q LOSS MUTATED | 63 | 29.6 (8.8) |
| 10Q LOSS WILD-TYPE | 70 | 34.1 (9.4) |
Figure S7. Get High-res Image Gene #56: '10q loss' versus Clinical Feature #2: 'YEARS_TO_BIRTH'
P value = 0.000683 (Wilcoxon-test), Q value = 0.088
Table S8. Gene #60: '14q loss' versus Clinical Feature #2: 'YEARS_TO_BIRTH'
| nPatients | Mean (Std.Dev) | |
|---|---|---|
| ALL | 133 | 32.0 (9.3) |
| 14Q LOSS MUTATED | 17 | 25.4 (5.7) |
| 14Q LOSS WILD-TYPE | 116 | 32.9 (9.4) |
Figure S8. Get High-res Image Gene #60: '14q loss' versus Clinical Feature #2: 'YEARS_TO_BIRTH'
P value = 0.0019 (Wilcoxon-test), Q value = 0.12
Table S9. Gene #69: '19q loss' versus Clinical Feature #2: 'YEARS_TO_BIRTH'
| nPatients | Mean (Std.Dev) | |
|---|---|---|
| ALL | 133 | 32.0 (9.3) |
| 19Q LOSS MUTATED | 42 | 29.0 (10.1) |
| 19Q LOSS WILD-TYPE | 91 | 33.4 (8.7) |
Figure S9. Get High-res Image Gene #69: '19q loss' versus Clinical Feature #2: 'YEARS_TO_BIRTH'
P value = 0.00022 (Fisher's exact test), Q value = 0.082
Table S10. Gene #69: '19q loss' versus Clinical Feature #3: 'NEOPLASM_DISEASESTAGE'
| nPatients | STAGE I | STAGE IA | STAGE IB | STAGE II | STAGE IIA | STAGE IIB | STAGE IIC | STAGE III | STAGE IIIA | STAGE IIIB | STAGE IIIC | STAGE IS |
|---|---|---|---|---|---|---|---|---|---|---|---|---|
| ALL | 19 | 25 | 11 | 5 | 6 | 1 | 1 | 2 | 1 | 6 | 5 | 46 |
| 19Q LOSS MUTATED | 3 | 2 | 3 | 5 | 4 | 0 | 0 | 1 | 0 | 4 | 3 | 16 |
| 19Q LOSS WILD-TYPE | 16 | 23 | 8 | 0 | 2 | 1 | 1 | 1 | 1 | 2 | 2 | 30 |
Figure S10. Get High-res Image Gene #69: '19q loss' versus Clinical Feature #3: 'NEOPLASM_DISEASESTAGE'

-
Copy number data file = broad_values_by_arm.txt from GISTIC pipeline
-
Processed Copy number data file = /xchip/cga/gdac-prod/tcga-gdac/jobResults/GDAC_Correlate_Genomic_Events_Preprocess/TGCT-TP/15101914/transformed.cor.cli.txt
-
Clinical data file = /xchip/cga/gdac-prod/tcga-gdac/jobResults/Append_Data/TGCT-TP/15092576/TGCT-TP.merged_data.txt
-
Number of patients = 133
-
Number of significantly arm-level cnvs = 74
-
Number of selected clinical features = 8
-
Exclude regions that fewer than K tumors have mutations, K = 3
For survival clinical features, the Kaplan-Meier survival curves of tumors with and without gene mutations were plotted and the statistical significance P values were estimated by logrank test (Bland and Altman 2004) using the 'survdiff' function in R
For binary or multi-class clinical features (nominal or ordinal), two-tailed Fisher's exact tests (Fisher 1922) were used to estimate the P values using the 'fisher.test' function in R
For multiple hypothesis correction, Q value is the False Discovery Rate (FDR) analogue of the P value (Benjamini and Hochberg 1995), defined as the minimum FDR at which the test may be called significant. We used the 'Benjamini and Hochberg' method of 'p.adjust' function in R to convert P values into Q values.
In addition to the links below, the full results of the analysis summarized in this report can also be downloaded programmatically using firehose_get, or interactively from either the Broad GDAC website or TCGA Data Coordination Center Portal.