This pipeline computes the correlation between significant copy number variation (cnv focal) genes and selected clinical features.
Testing the association between copy number variation 47 focal events and 8 clinical features across 133 patients, 6 significant findings detected with Q value < 0.25.
-
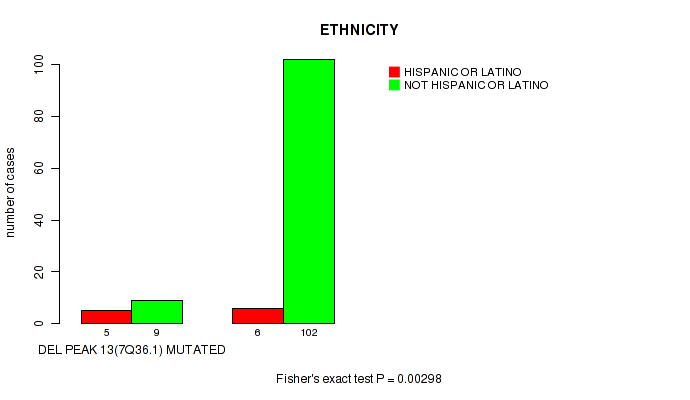
del_7q36.1 cnv correlated to 'ETHNICITY'.
-
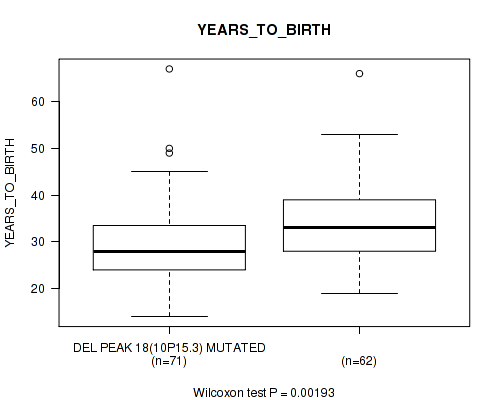
del_10p15.3 cnv correlated to 'YEARS_TO_BIRTH'.
-
del_10q23.1 cnv correlated to 'YEARS_TO_BIRTH'.
-
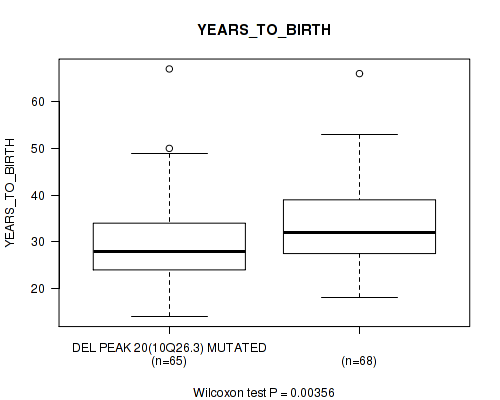
del_10q26.3 cnv correlated to 'YEARS_TO_BIRTH'.
-
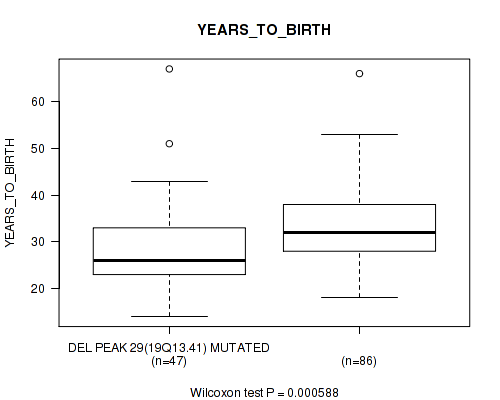
del_19q13.41 cnv correlated to 'YEARS_TO_BIRTH' and 'NEOPLASM_DISEASESTAGE'.
Table 1. Get Full Table Overview of the association between significant copy number variation of 47 focal events and 8 clinical features. Shown in the table are P values (Q values). Thresholded by Q value < 0.25, 6 significant findings detected.
|
Clinical Features |
Time to Death |
YEARS TO BIRTH |
NEOPLASM DISEASESTAGE |
PATHOLOGY T STAGE |
PATHOLOGY N STAGE |
PATHOLOGY M STAGE |
RACE | ETHNICITY | ||
| nCNV (%) | nWild-Type | logrank test | Wilcoxon-test | Fisher's exact test | Fisher's exact test | Fisher's exact test | Fisher's exact test | Fisher's exact test | Fisher's exact test | |
| del 19q13 41 | 47 (35%) | 86 |
0.341 (1.00) |
0.000588 (0.122) |
0.00065 (0.122) |
0.372 (1.00) |
0.128 (1.00) |
0.622 (1.00) |
0.766 (1.00) |
1 (1.00) |
| del 7q36 1 | 14 (11%) | 119 |
0.533 (1.00) |
0.403 (1.00) |
0.157 (1.00) |
0.888 (1.00) |
0.302 (1.00) |
1 (1.00) |
1 (1.00) |
0.00298 (0.223) |
| del 10p15 3 | 71 (53%) | 62 |
0.687 (1.00) |
0.00193 (0.217) |
0.0974 (0.964) |
0.428 (1.00) |
0.203 (1.00) |
0.124 (0.992) |
0.0523 (0.836) |
0.541 (1.00) |
| del 10q23 1 | 62 (47%) | 71 |
0.518 (1.00) |
0.00231 (0.217) |
0.0542 (0.836) |
0.338 (1.00) |
0.0303 (0.671) |
0.331 (1.00) |
0.477 (1.00) |
0.216 (1.00) |
| del 10q26 3 | 65 (49%) | 68 |
0.524 (1.00) |
0.00356 (0.223) |
0.00602 (0.309) |
0.371 (1.00) |
0.0262 (0.671) |
0.36 (1.00) |
0.787 (1.00) |
0.205 (1.00) |
| amp 1q21 2 | 62 (47%) | 71 |
0.628 (1.00) |
0.181 (1.00) |
0.479 (1.00) |
0.911 (1.00) |
0.532 (1.00) |
0.619 (1.00) |
0.268 (1.00) |
0.114 (0.992) |
| amp 2p24 1 | 53 (40%) | 80 |
0.861 (1.00) |
0.932 (1.00) |
0.909 (1.00) |
0.246 (1.00) |
0.351 (1.00) |
0.642 (1.00) |
0.673 (1.00) |
0.524 (1.00) |
| amp 3q27 3 | 40 (30%) | 93 |
0.847 (1.00) |
0.705 (1.00) |
0.697 (1.00) |
0.0919 (0.964) |
1 (1.00) |
0.581 (1.00) |
0.563 (1.00) |
0.73 (1.00) |
| amp 4q12 | 19 (14%) | 114 |
0.519 (1.00) |
0.266 (1.00) |
0.556 (1.00) |
0.84 (1.00) |
1 (1.00) |
1 (1.00) |
1 (1.00) |
1 (1.00) |
| amp 7p22 1 | 115 (86%) | 18 |
0.275 (1.00) |
0.56 (1.00) |
0.685 (1.00) |
0.834 (1.00) |
0.668 (1.00) |
0.424 (1.00) |
0.394 (1.00) |
0.135 (1.00) |
| amp 7q11 22 | 109 (82%) | 24 |
0.472 (1.00) |
0.684 (1.00) |
0.293 (1.00) |
0.238 (1.00) |
1 (1.00) |
0.548 (1.00) |
0.816 (1.00) |
0.0952 (0.964) |
| amp 8q11 23 | 113 (85%) | 20 |
0.449 (1.00) |
0.95 (1.00) |
0.448 (1.00) |
0.706 (1.00) |
0.668 (1.00) |
0.0882 (0.964) |
0.303 (1.00) |
0.637 (1.00) |
| amp 8q23 3 | 100 (75%) | 33 |
0.313 (1.00) |
0.598 (1.00) |
0.334 (1.00) |
0.286 (1.00) |
0.713 (1.00) |
0.224 (1.00) |
0.846 (1.00) |
0.273 (1.00) |
| amp 12p13 33 | 128 (96%) | 5 |
0.754 (1.00) |
0.594 (1.00) |
0.39 (1.00) |
0.723 (1.00) |
1 (1.00) |
1 (1.00) |
1 (1.00) |
|
| amp 12p12 1 | 130 (98%) | 3 |
0.81 (1.00) |
0.564 (1.00) |
0.273 (1.00) |
1 (1.00) |
1 (1.00) |
1 (1.00) |
1 (1.00) |
|
| amp 12p11 21 | 127 (95%) | 6 |
0.754 (1.00) |
0.664 (1.00) |
0.893 (1.00) |
0.766 (1.00) |
1 (1.00) |
1 (1.00) |
0.382 (1.00) |
|
| amp 12q15 | 89 (67%) | 44 |
0.167 (1.00) |
0.0259 (0.671) |
0.579 (1.00) |
0.563 (1.00) |
0.481 (1.00) |
1 (1.00) |
0.57 (1.00) |
0.326 (1.00) |
| amp 16q21 | 18 (14%) | 115 |
0.364 (1.00) |
0.289 (1.00) |
0.21 (1.00) |
0.343 (1.00) |
1 (1.00) |
0.446 (1.00) |
1 (1.00) |
0.158 (1.00) |
| amp 20q11 21 | 41 (31%) | 92 |
0.973 (1.00) |
0.184 (1.00) |
0.049 (0.836) |
0.0143 (0.539) |
0.481 (1.00) |
0.311 (1.00) |
0.481 (1.00) |
1 (1.00) |
| amp 22q11 21 | 53 (40%) | 80 |
0.879 (1.00) |
0.117 (0.992) |
0.0582 (0.836) |
0.865 (1.00) |
0.152 (1.00) |
0.155 (1.00) |
0.778 (1.00) |
0.75 (1.00) |
| del 1p36 31 | 29 (22%) | 104 |
0.0601 (0.836) |
0.806 (1.00) |
0.16 (1.00) |
0.868 (1.00) |
1 (1.00) |
1 (1.00) |
0.697 (1.00) |
0.0394 (0.822) |
| del 1p31 1 | 26 (20%) | 107 |
0.0295 (0.671) |
0.836 (1.00) |
0.697 (1.00) |
0.61 (1.00) |
0.712 (1.00) |
0.529 (1.00) |
0.428 (1.00) |
1 (1.00) |
| del 1q42 12 | 9 (7%) | 124 |
0.0575 (0.836) |
0.504 (1.00) |
0.37 (1.00) |
0.451 (1.00) |
1 (1.00) |
1 (1.00) |
0.08 (0.964) |
0.493 (1.00) |
| del 2q37 3 | 13 (10%) | 120 |
0.185 (1.00) |
0.614 (1.00) |
0.75 (1.00) |
0.433 (1.00) |
0.643 (1.00) |
1 (1.00) |
0.0163 (0.557) |
0.0767 (0.964) |
| del 3p26 2 | 40 (30%) | 93 |
0.935 (1.00) |
0.358 (1.00) |
0.406 (1.00) |
0.0576 (0.836) |
0.509 (1.00) |
0.578 (1.00) |
0.296 (1.00) |
0.734 (1.00) |
| del 4q22 2 | 99 (74%) | 34 |
0.292 (1.00) |
0.112 (0.992) |
0.245 (1.00) |
0.0709 (0.952) |
0.026 (0.671) |
1 (1.00) |
0.355 (1.00) |
1 (1.00) |
| del 5p15 2 | 91 (68%) | 42 |
0.987 (1.00) |
0.76 (1.00) |
0.352 (1.00) |
0.0942 (0.964) |
1 (1.00) |
0.589 (1.00) |
0.566 (1.00) |
0.738 (1.00) |
| del 5p14 3 | 92 (69%) | 41 |
0.983 (1.00) |
0.821 (1.00) |
0.397 (1.00) |
0.0425 (0.836) |
1 (1.00) |
0.585 (1.00) |
0.648 (1.00) |
0.734 (1.00) |
| del 5q12 1 | 94 (71%) | 39 |
0.923 (1.00) |
0.588 (1.00) |
0.121 (0.992) |
0.00658 (0.309) |
0.738 (1.00) |
0.581 (1.00) |
0.728 (1.00) |
0.73 (1.00) |
| del 6p22 3 | 19 (14%) | 114 |
0.473 (1.00) |
0.336 (1.00) |
0.678 (1.00) |
0.622 (1.00) |
0.668 (1.00) |
0.468 (1.00) |
0.776 (1.00) |
0.651 (1.00) |
| del 6q26 | 22 (17%) | 111 |
0.41 (1.00) |
0.0788 (0.964) |
0.186 (1.00) |
0.662 (1.00) |
1 (1.00) |
0.133 (1.00) |
1 (1.00) |
0.69 (1.00) |
| del 7q11 22 | 3 (2%) | 130 |
0.76 (1.00) |
0.934 (1.00) |
0.802 (1.00) |
1 (1.00) |
1 (1.00) |
1 (1.00) |
0.249 (1.00) |
|
| del 9p24 3 | 62 (47%) | 71 |
0.58 (1.00) |
0.548 (1.00) |
0.227 (1.00) |
1 (1.00) |
0.54 (1.00) |
0.345 (1.00) |
0.692 (1.00) |
1 (1.00) |
| del 9p23 | 58 (44%) | 75 |
0.678 (1.00) |
0.64 (1.00) |
0.321 (1.00) |
0.914 (1.00) |
1 (1.00) |
0.319 (1.00) |
0.594 (1.00) |
1 (1.00) |
| del 9q33 3 | 52 (39%) | 81 |
0.343 (1.00) |
0.584 (1.00) |
0.443 (1.00) |
0.676 (1.00) |
0.755 (1.00) |
0.642 (1.00) |
0.453 (1.00) |
0.524 (1.00) |
| del 9q34 2 | 52 (39%) | 81 |
0.343 (1.00) |
0.402 (1.00) |
0.362 (1.00) |
0.677 (1.00) |
0.755 (1.00) |
0.642 (1.00) |
0.452 (1.00) |
0.198 (1.00) |
| del 11p15 5 | 84 (63%) | 49 |
0.897 (1.00) |
0.232 (1.00) |
0.944 (1.00) |
0.677 (1.00) |
0.184 (1.00) |
1 (1.00) |
0.767 (1.00) |
0.747 (1.00) |
| del 11p12 | 89 (67%) | 44 |
0.998 (1.00) |
0.195 (1.00) |
0.994 (1.00) |
0.378 (1.00) |
0.0838 (0.964) |
1 (1.00) |
0.66 (1.00) |
1 (1.00) |
| del 11q12 3 | 103 (77%) | 30 |
0.703 (1.00) |
0.351 (1.00) |
0.997 (1.00) |
0.257 (1.00) |
0.159 (1.00) |
1 (1.00) |
0.147 (1.00) |
0.694 (1.00) |
| del 11q24 2 | 109 (82%) | 24 |
0.472 (1.00) |
0.57 (1.00) |
0.721 (1.00) |
0.459 (1.00) |
0.1 (0.966) |
1 (1.00) |
0.00809 (0.338) |
0.207 (1.00) |
| del 13q34 | 101 (76%) | 32 |
0.314 (1.00) |
0.172 (1.00) |
0.64 (1.00) |
0.165 (1.00) |
0.159 (1.00) |
1 (1.00) |
0.334 (1.00) |
1 (1.00) |
| del 16q23 1 | 60 (45%) | 73 |
0.123 (0.992) |
0.62 (1.00) |
0.465 (1.00) |
0.274 (1.00) |
1 (1.00) |
0.124 (0.992) |
0.686 (1.00) |
1 (1.00) |
| del 18p11 32 | 105 (79%) | 28 |
0.38 (1.00) |
0.246 (1.00) |
0.636 (1.00) |
0.248 (1.00) |
0.426 (1.00) |
1 (1.00) |
0.569 (1.00) |
1 (1.00) |
| del 18q22 2 | 112 (84%) | 21 |
0.431 (1.00) |
0.248 (1.00) |
0.442 (1.00) |
0.0846 (0.964) |
0.671 (1.00) |
0.509 (1.00) |
0.787 (1.00) |
0.681 (1.00) |
| del 20p12 1 | 27 (20%) | 106 |
0.391 (1.00) |
0.871 (1.00) |
0.361 (1.00) |
0.574 (1.00) |
0.113 (0.992) |
0.197 (1.00) |
0.572 (1.00) |
0.7 (1.00) |
| del xp21 1 | 23 (17%) | 110 |
0.43 (1.00) |
0.741 (1.00) |
0.34 (1.00) |
0.184 (1.00) |
0.185 (1.00) |
1 (1.00) |
0.0514 (0.836) |
0.386 (1.00) |
| del xq27 3 | 25 (19%) | 108 |
0.382 (1.00) |
0.309 (1.00) |
0.028 (0.671) |
0.366 (1.00) |
0.426 (1.00) |
0.567 (1.00) |
0.827 (1.00) |
0.216 (1.00) |
P value = 0.00298 (Fisher's exact test), Q value = 0.22
Table S1. Gene #28: 'del_7q36.1' versus Clinical Feature #8: 'ETHNICITY'
| nPatients | HISPANIC OR LATINO | NOT HISPANIC OR LATINO |
|---|---|---|
| ALL | 11 | 111 |
| DEL PEAK 13(7Q36.1) MUTATED | 5 | 9 |
| DEL PEAK 13(7Q36.1) WILD-TYPE | 6 | 102 |
Figure S1. Get High-res Image Gene #28: 'del_7q36.1' versus Clinical Feature #8: 'ETHNICITY'
P value = 0.00193 (Wilcoxon-test), Q value = 0.22
Table S2. Gene #33: 'del_10p15.3' versus Clinical Feature #2: 'YEARS_TO_BIRTH'
| nPatients | Mean (Std.Dev) | |
|---|---|---|
| ALL | 133 | 32.0 (9.3) |
| DEL PEAK 18(10P15.3) MUTATED | 71 | 29.7 (8.7) |
| DEL PEAK 18(10P15.3) WILD-TYPE | 62 | 34.5 (9.5) |
Figure S2. Get High-res Image Gene #33: 'del_10p15.3' versus Clinical Feature #2: 'YEARS_TO_BIRTH'
P value = 0.00231 (Wilcoxon-test), Q value = 0.22
Table S3. Gene #34: 'del_10q23.1' versus Clinical Feature #2: 'YEARS_TO_BIRTH'
| nPatients | Mean (Std.Dev) | |
|---|---|---|
| ALL | 133 | 32.0 (9.3) |
| DEL PEAK 19(10Q23.1) MUTATED | 62 | 29.6 (8.9) |
| DEL PEAK 19(10Q23.1) WILD-TYPE | 71 | 34.0 (9.3) |
Figure S3. Get High-res Image Gene #34: 'del_10q23.1' versus Clinical Feature #2: 'YEARS_TO_BIRTH'

P value = 0.00356 (Wilcoxon-test), Q value = 0.22
Table S4. Gene #35: 'del_10q26.3' versus Clinical Feature #2: 'YEARS_TO_BIRTH'
| nPatients | Mean (Std.Dev) | |
|---|---|---|
| ALL | 133 | 32.0 (9.3) |
| DEL PEAK 20(10Q26.3) MUTATED | 65 | 29.8 (8.9) |
| DEL PEAK 20(10Q26.3) WILD-TYPE | 68 | 34.1 (9.4) |
Figure S4. Get High-res Image Gene #35: 'del_10q26.3' versus Clinical Feature #2: 'YEARS_TO_BIRTH'
P value = 0.000588 (Wilcoxon-test), Q value = 0.12
Table S5. Gene #44: 'del_19q13.41' versus Clinical Feature #2: 'YEARS_TO_BIRTH'
| nPatients | Mean (Std.Dev) | |
|---|---|---|
| ALL | 133 | 32.0 (9.3) |
| DEL PEAK 29(19Q13.41) MUTATED | 47 | 28.8 (9.5) |
| DEL PEAK 29(19Q13.41) WILD-TYPE | 86 | 33.7 (8.8) |
Figure S5. Get High-res Image Gene #44: 'del_19q13.41' versus Clinical Feature #2: 'YEARS_TO_BIRTH'
P value = 0.00065 (Fisher's exact test), Q value = 0.12
Table S6. Gene #44: 'del_19q13.41' versus Clinical Feature #3: 'NEOPLASM_DISEASESTAGE'
| nPatients | STAGE I | STAGE IA | STAGE IB | STAGE II | STAGE IIA | STAGE IIB | STAGE IIC | STAGE III | STAGE IIIA | STAGE IIIB | STAGE IIIC | STAGE IS |
|---|---|---|---|---|---|---|---|---|---|---|---|---|
| ALL | 19 | 25 | 11 | 5 | 6 | 1 | 1 | 2 | 1 | 6 | 5 | 46 |
| DEL PEAK 29(19Q13.41) MUTATED | 3 | 3 | 3 | 5 | 4 | 0 | 0 | 1 | 0 | 4 | 3 | 19 |
| DEL PEAK 29(19Q13.41) WILD-TYPE | 16 | 22 | 8 | 0 | 2 | 1 | 1 | 1 | 1 | 2 | 2 | 27 |
Figure S6. Get High-res Image Gene #44: 'del_19q13.41' versus Clinical Feature #3: 'NEOPLASM_DISEASESTAGE'

-
Copy number data file = all_lesions.txt from GISTIC pipeline
-
Processed Copy number data file = /xchip/cga/gdac-prod/tcga-gdac/jobResults/GDAC_Correlate_Genomic_Events_Preprocess/TGCT-TP/15101915/transformed.cor.cli.txt
-
Clinical data file = /xchip/cga/gdac-prod/tcga-gdac/jobResults/Append_Data/TGCT-TP/15092576/TGCT-TP.merged_data.txt
-
Number of patients = 133
-
Number of significantly focal cnvs = 47
-
Number of selected clinical features = 8
-
Exclude genes that fewer than K tumors have mutations, K = 3
For survival clinical features, the Kaplan-Meier survival curves of tumors with and without gene mutations were plotted and the statistical significance P values were estimated by logrank test (Bland and Altman 2004) using the 'survdiff' function in R
For binary or multi-class clinical features (nominal or ordinal), two-tailed Fisher's exact tests (Fisher 1922) were used to estimate the P values using the 'fisher.test' function in R
For multiple hypothesis correction, Q value is the False Discovery Rate (FDR) analogue of the P value (Benjamini and Hochberg 1995), defined as the minimum FDR at which the test may be called significant. We used the 'Benjamini and Hochberg' method of 'p.adjust' function in R to convert P values into Q values.
In addition to the links below, the full results of the analysis summarized in this report can also be downloaded programmatically using firehose_get, or interactively from either the Broad GDAC website or TCGA Data Coordination Center Portal.