This pipeline computes the correlation between cancer subtypes identified by different molecular patterns and selected clinical features.
Testing the association between subtypes identified by 10 different clustering approaches and 8 clinical features across 133 patients, 32 significant findings detected with P value < 0.05 and Q value < 0.25.
-
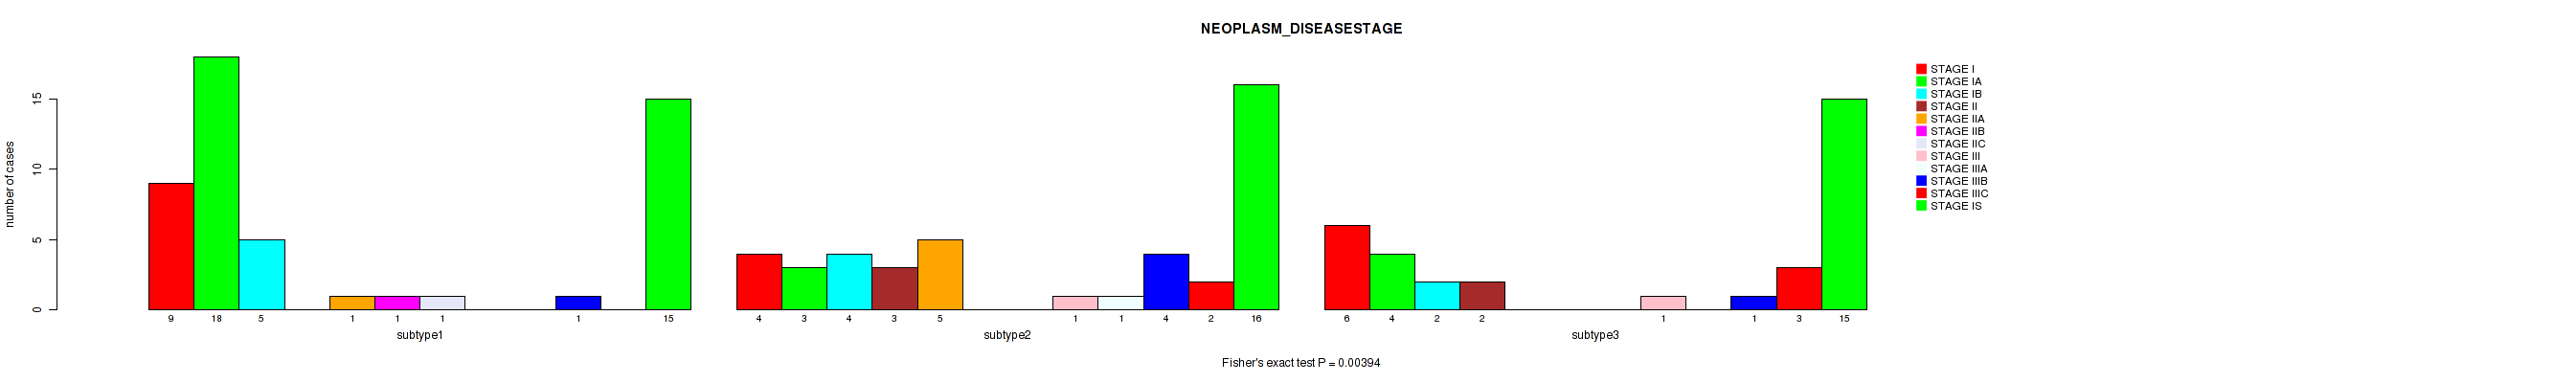
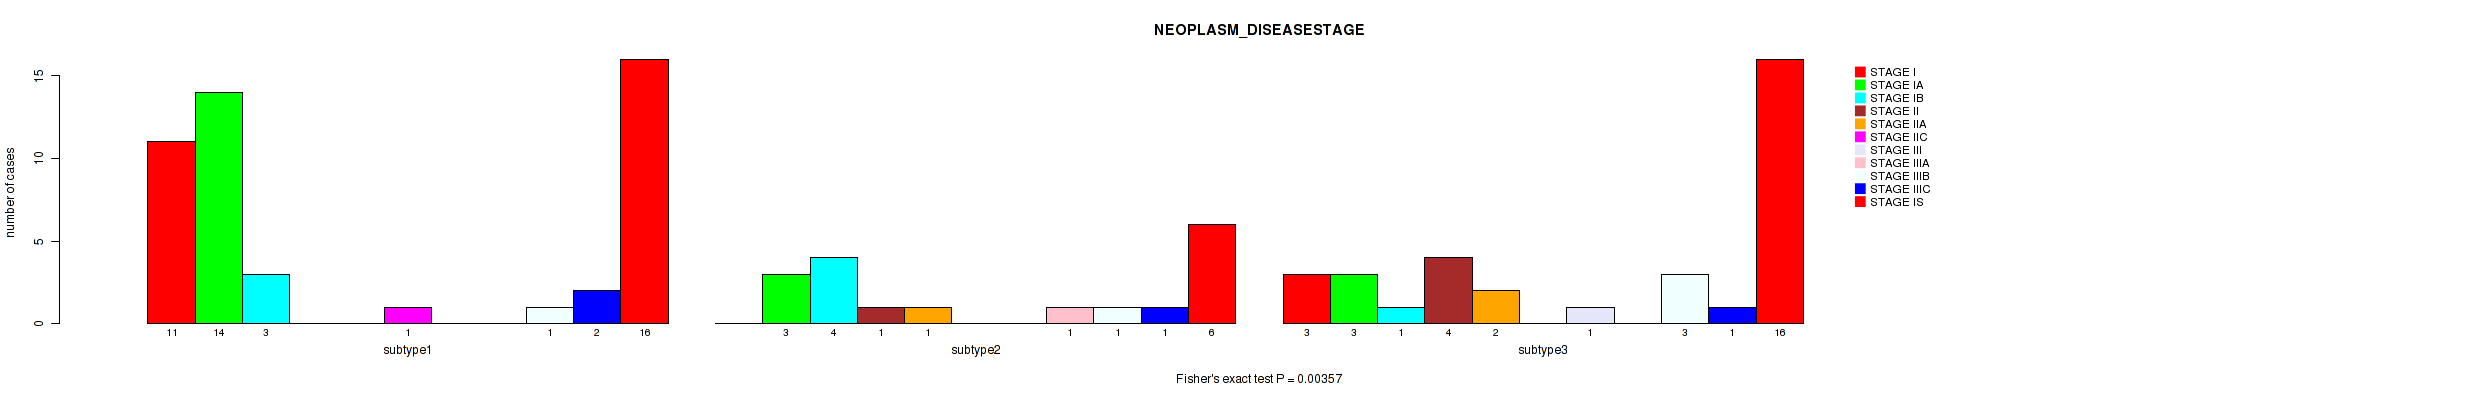
3 subtypes identified in current cancer cohort by 'Copy Number Ratio CNMF subtypes'. These subtypes correlate to 'NEOPLASM_DISEASESTAGE'.
-
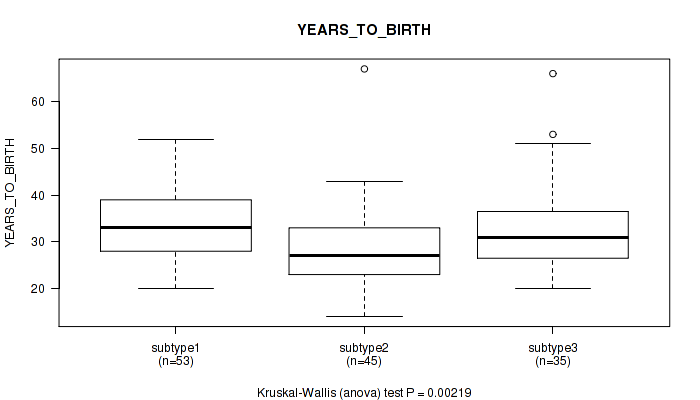
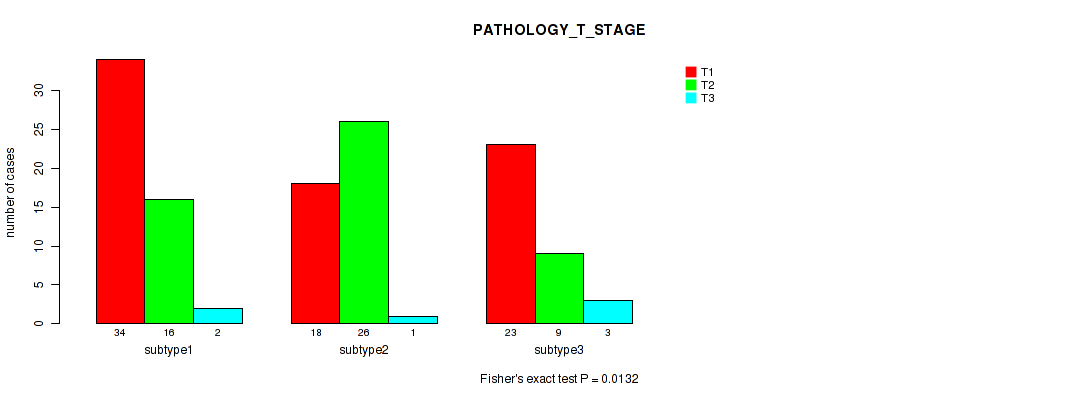
3 subtypes identified in current cancer cohort by 'METHLYATION CNMF'. These subtypes correlate to 'YEARS_TO_BIRTH', 'NEOPLASM_DISEASESTAGE', and 'PATHOLOGY_T_STAGE'.
-
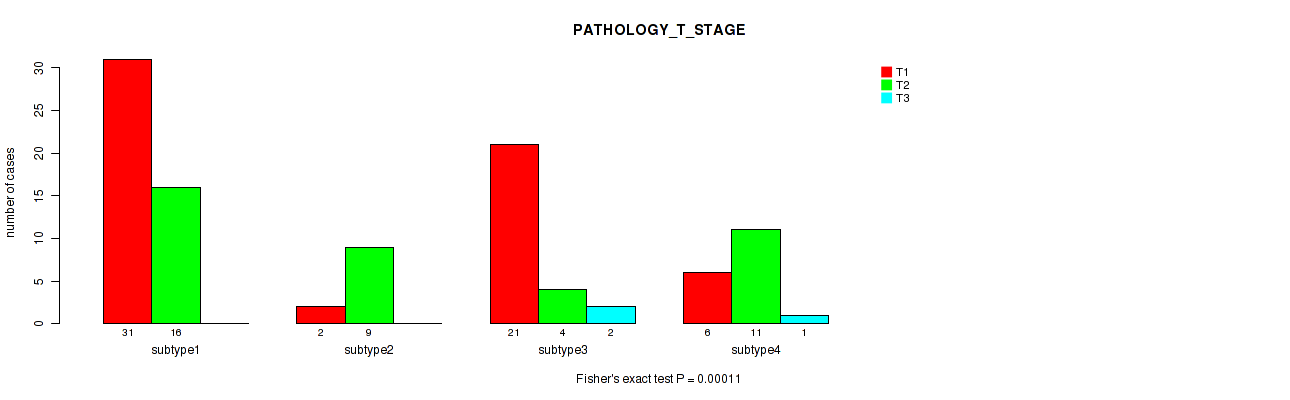
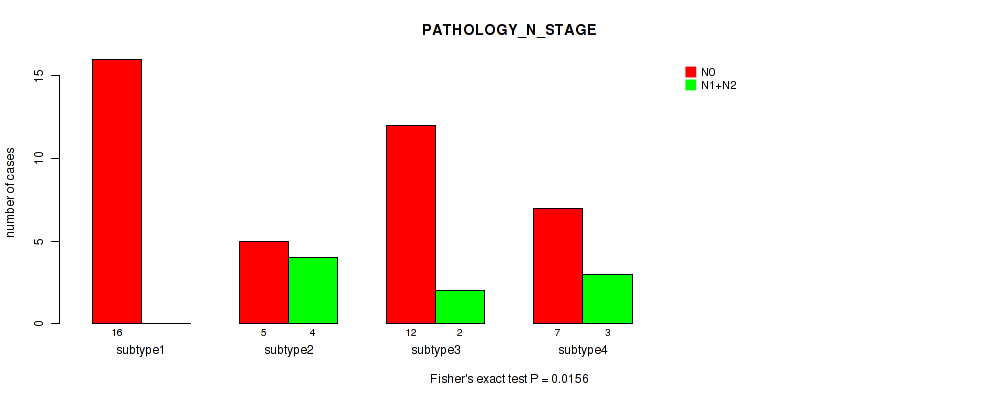
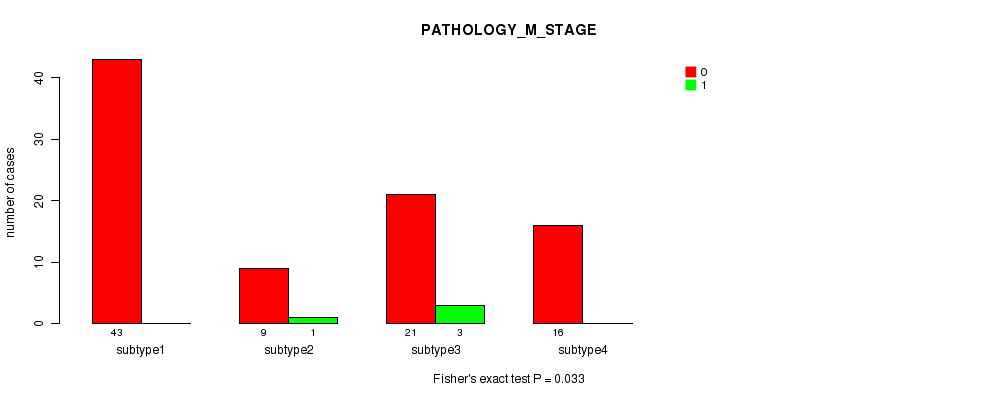
CNMF clustering analysis on RPPA data identified 4 subtypes that correlate to 'YEARS_TO_BIRTH', 'NEOPLASM_DISEASESTAGE', 'PATHOLOGY_T_STAGE', 'PATHOLOGY_N_STAGE', and 'PATHOLOGY_M_STAGE'.
-
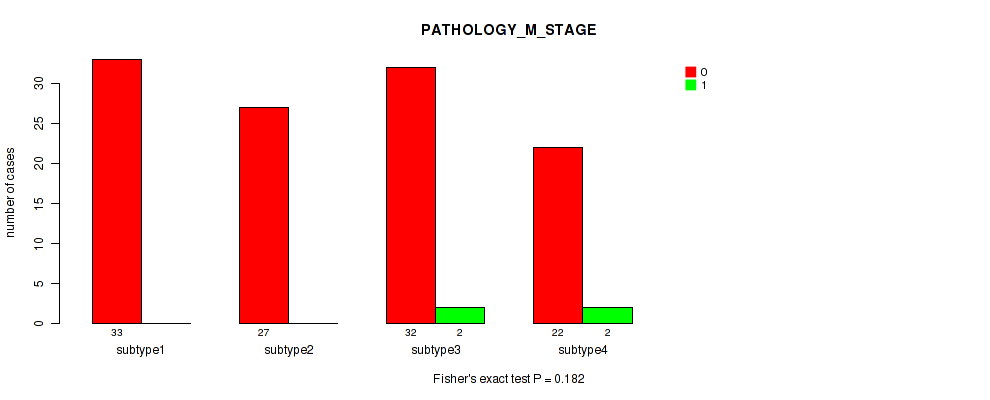
Consensus hierarchical clustering analysis on RPPA data identified 3 subtypes that correlate to 'YEARS_TO_BIRTH', 'NEOPLASM_DISEASESTAGE', and 'PATHOLOGY_M_STAGE'.
-
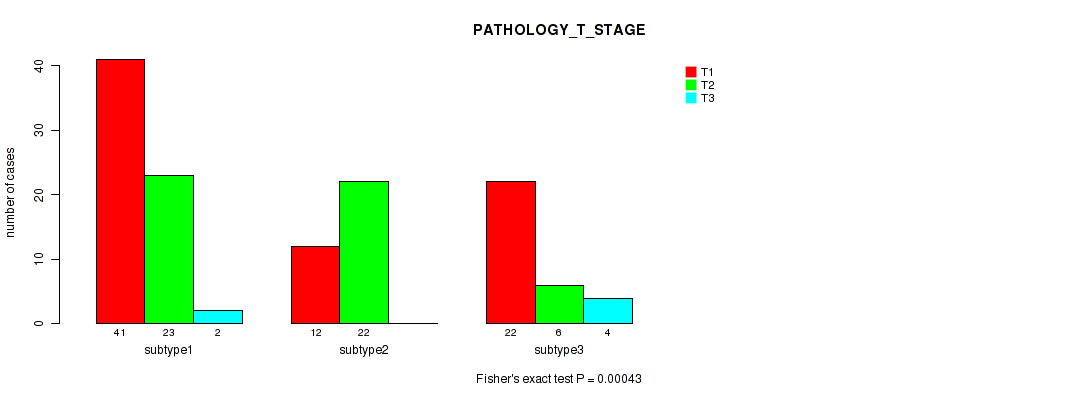
CNMF clustering analysis on sequencing-based mRNA expression data identified 3 subtypes that correlate to 'YEARS_TO_BIRTH', 'NEOPLASM_DISEASESTAGE', and 'PATHOLOGY_T_STAGE'.
-
Consensus hierarchical clustering analysis on sequencing-based mRNA expression data identified 7 subtypes that correlate to 'Time to Death', 'NEOPLASM_DISEASESTAGE', 'PATHOLOGY_T_STAGE', and 'PATHOLOGY_M_STAGE'.
-
3 subtypes identified in current cancer cohort by 'MIRSEQ CNMF'. These subtypes correlate to 'NEOPLASM_DISEASESTAGE', 'PATHOLOGY_T_STAGE', and 'PATHOLOGY_M_STAGE'.
-
3 subtypes identified in current cancer cohort by 'MIRSEQ CHIERARCHICAL'. These subtypes correlate to 'YEARS_TO_BIRTH', 'NEOPLASM_DISEASESTAGE', 'PATHOLOGY_T_STAGE', and 'PATHOLOGY_M_STAGE'.
-
3 subtypes identified in current cancer cohort by 'MIRseq Mature CNMF subtypes'. These subtypes correlate to 'YEARS_TO_BIRTH', 'NEOPLASM_DISEASESTAGE', and 'PATHOLOGY_T_STAGE'.
-
4 subtypes identified in current cancer cohort by 'MIRseq Mature cHierClus subtypes'. These subtypes correlate to 'YEARS_TO_BIRTH', 'NEOPLASM_DISEASESTAGE', and 'PATHOLOGY_T_STAGE'.
Table 1. Get Full Table Overview of the association between subtypes identified by 10 different clustering approaches and 8 clinical features. Shown in the table are P values (Q values). Thresholded by P value < 0.05 and Q value < 0.25, 32 significant findings detected.
|
Clinical Features |
Time to Death |
YEARS TO BIRTH |
NEOPLASM DISEASESTAGE |
PATHOLOGY T STAGE |
PATHOLOGY N STAGE |
PATHOLOGY M STAGE |
RACE | ETHNICITY |
| Statistical Tests | logrank test | Kruskal-Wallis (anova) | Fisher's exact test | Fisher's exact test | Fisher's exact test | Fisher's exact test | Fisher's exact test | Fisher's exact test |
| Copy Number Ratio CNMF subtypes |
0.369 (0.534) |
0.134 (0.289) |
0.00222 (0.0197) |
0.744 (0.902) |
0.787 (0.918) |
0.325 (0.521) |
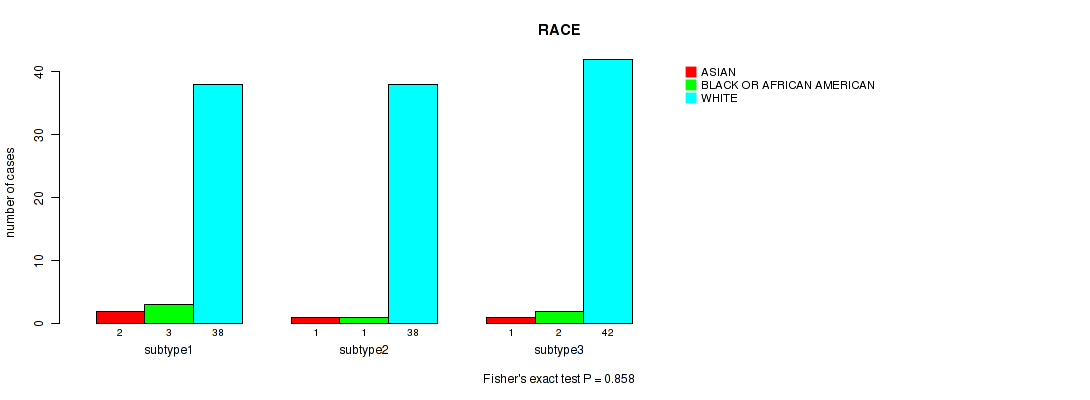
0.858 (0.918) |
0.623 (0.791) |
| METHLYATION CNMF |
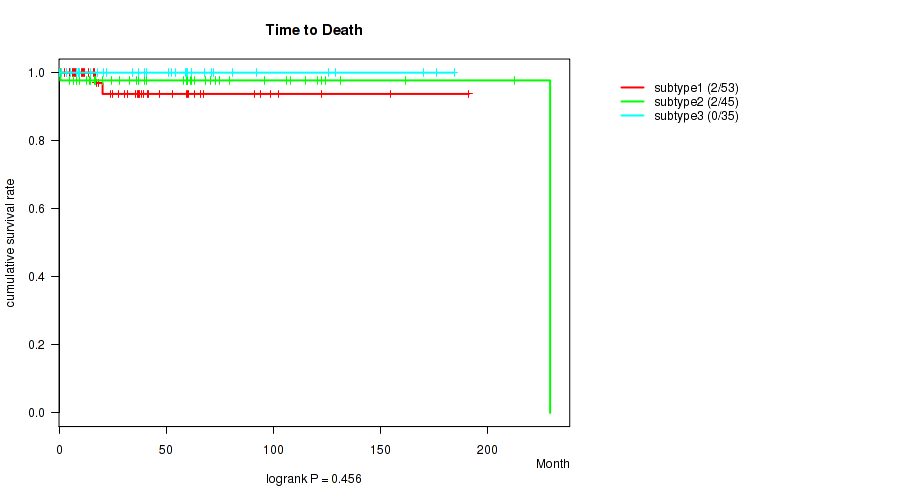
0.456 (0.639) |
0.00219 (0.0197) |
0.00394 (0.0287) |
0.0132 (0.0502) |
0.103 (0.229) |
0.171 (0.351) |
0.374 (0.534) |
0.662 (0.828) |
| RPPA CNMF subtypes |
0.854 (0.918) |
0.00661 (0.03) |
6e-05 (0.0044) |
0.00011 (0.0044) |
0.0156 (0.0532) |
0.033 (0.0851) |
0.587 (0.757) |
0.84 (0.918) |
| RPPA cHierClus subtypes |
0.545 (0.715) |
0.00928 (0.0391) |
0.00357 (0.0286) |
0.191 (0.373) |
0.205 (0.382) |
0.00674 (0.03) |
0.837 (0.918) |
0.719 (0.884) |
| RNAseq CNMF subtypes |
0.326 (0.521) |
0.00485 (0.0293) |
0.00061 (0.00976) |
0.00512 (0.0293) |
0.349 (0.534) |
0.0705 (0.166) |
0.861 (0.918) |
0.37 (0.534) |
| RNAseq cHierClus subtypes |
0.018 (0.0532) |
0.0583 (0.141) |
0.00571 (0.0298) |
0.0102 (0.041) |
0.218 (0.397) |
0.0257 (0.0694) |
0.963 (0.975) |
0.48 (0.651) |
| MIRSEQ CNMF |
0.918 (0.941) |
0.162 (0.342) |
0.0499 (0.125) |
0.0173 (0.0532) |
0.296 (0.494) |
0.026 (0.0694) |
0.978 (0.978) |
0.35 (0.534) |
| MIRSEQ CHIERARCHICAL |
0.884 (0.918) |
0.00597 (0.0298) |
0.00075 (0.01) |
0.00505 (0.0293) |
0.253 (0.441) |
0.0163 (0.0532) |
0.863 (0.918) |
0.366 (0.534) |
| MIRseq Mature CNMF subtypes |
0.237 (0.422) |
0.0167 (0.0532) |
0.00026 (0.00693) |
0.00043 (0.0086) |
0.293 (0.494) |
0.0782 (0.179) |
0.824 (0.918) |
0.489 (0.652) |
| MIRseq Mature cHierClus subtypes |
0.83 (0.918) |
0.0199 (0.0568) |
0.00221 (0.0197) |
0.0173 (0.0532) |
0.198 (0.377) |
0.182 (0.364) |
0.877 (0.918) |
0.48 (0.651) |
Table S1. Description of clustering approach #1: 'Copy Number Ratio CNMF subtypes'
| Cluster Labels | 1 | 2 | 3 |
|---|---|---|---|
| Number of samples | 44 | 43 | 46 |
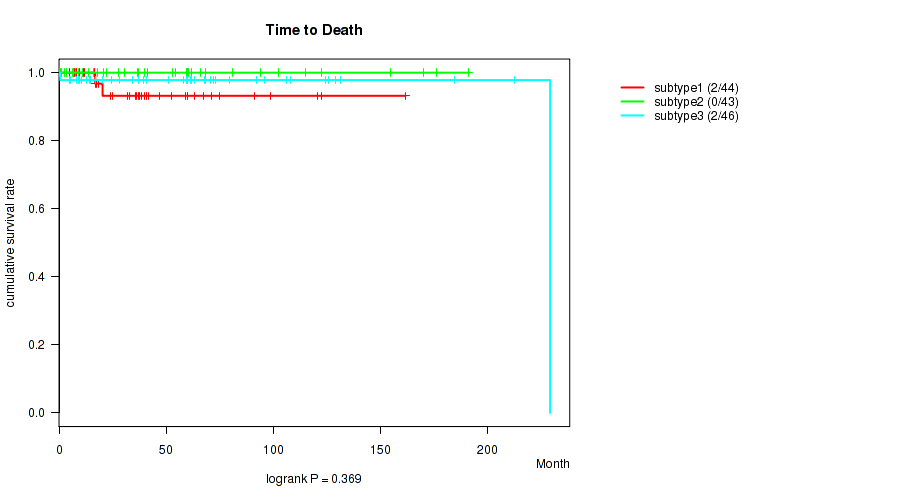
P value = 0.369 (logrank test), Q value = 0.53
Table S2. Clustering Approach #1: 'Copy Number Ratio CNMF subtypes' versus Clinical Feature #1: 'Time to Death'
| nPatients | nDeath | Duration Range (Median), Month | |
|---|---|---|---|
| ALL | 133 | 4 | 0.1 - 229.2 (37.7) |
| subtype1 | 44 | 2 | 0.1 - 161.7 (34.3) |
| subtype2 | 43 | 0 | 0.2 - 191.3 (36.8) |
| subtype3 | 46 | 2 | 0.6 - 229.2 (59.5) |
Figure S1. Get High-res Image Clustering Approach #1: 'Copy Number Ratio CNMF subtypes' versus Clinical Feature #1: 'Time to Death'
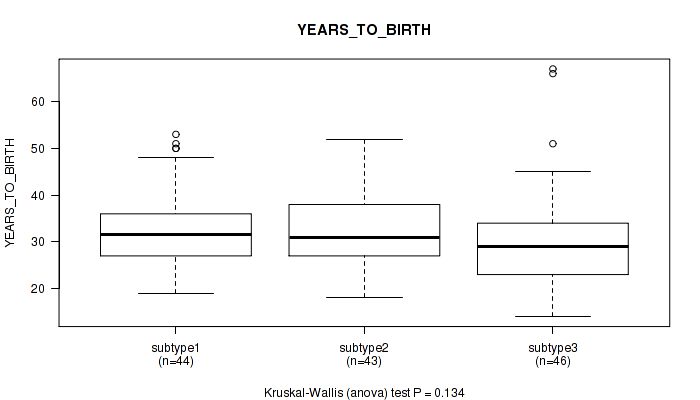
P value = 0.134 (Kruskal-Wallis (anova)), Q value = 0.29
Table S3. Clustering Approach #1: 'Copy Number Ratio CNMF subtypes' versus Clinical Feature #2: 'YEARS_TO_BIRTH'
| nPatients | Mean (Std.Dev) | |
|---|---|---|
| ALL | 133 | 32.0 (9.3) |
| subtype1 | 44 | 32.8 (8.3) |
| subtype2 | 43 | 32.6 (8.4) |
| subtype3 | 46 | 30.5 (11.0) |
Figure S2. Get High-res Image Clustering Approach #1: 'Copy Number Ratio CNMF subtypes' versus Clinical Feature #2: 'YEARS_TO_BIRTH'
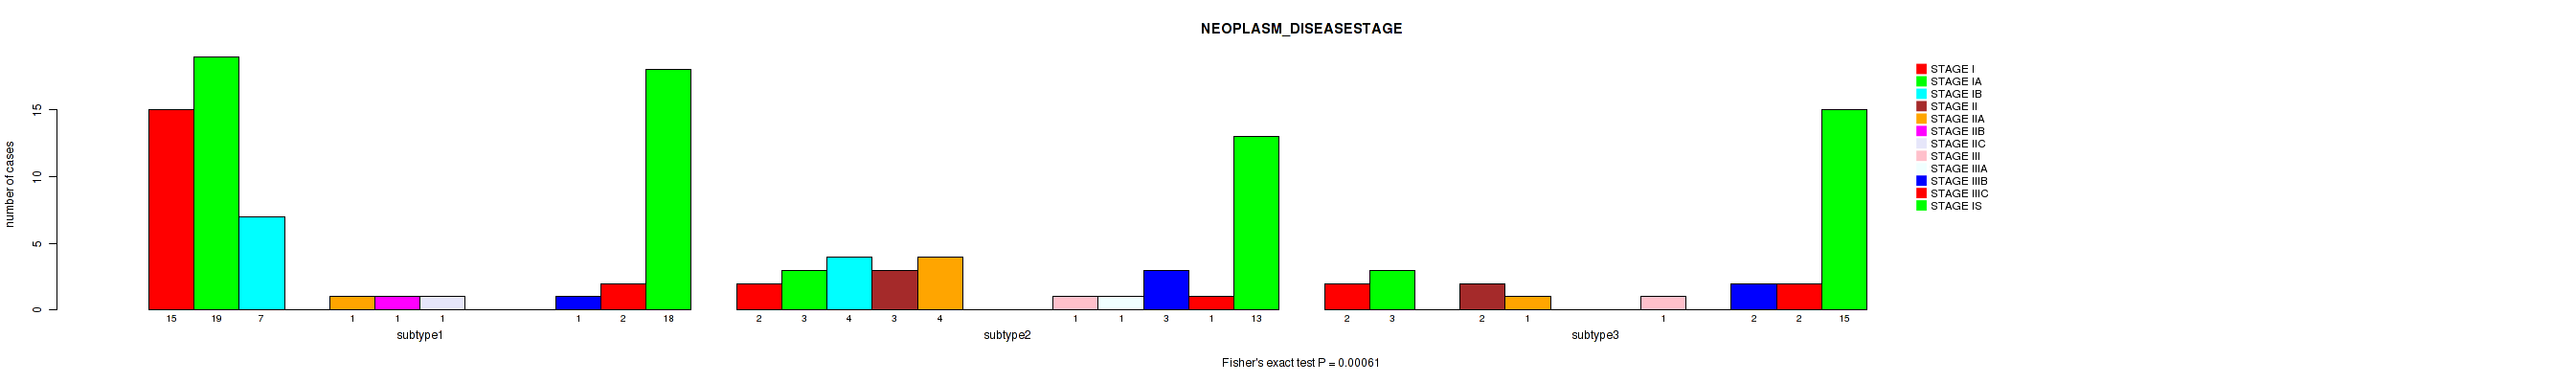
P value = 0.00222 (Fisher's exact test), Q value = 0.02
Table S4. Clustering Approach #1: 'Copy Number Ratio CNMF subtypes' versus Clinical Feature #3: 'NEOPLASM_DISEASESTAGE'
| nPatients | STAGE I | STAGE IA | STAGE IB | STAGE II | STAGE IIA | STAGE IIB | STAGE IIC | STAGE III | STAGE IIIA | STAGE IIIB | STAGE IIIC | STAGE IS |
|---|---|---|---|---|---|---|---|---|---|---|---|---|
| ALL | 19 | 25 | 11 | 5 | 6 | 1 | 1 | 2 | 1 | 6 | 5 | 46 |
| subtype1 | 4 | 15 | 5 | 1 | 4 | 0 | 1 | 0 | 1 | 1 | 1 | 10 |
| subtype2 | 10 | 6 | 4 | 0 | 2 | 1 | 0 | 1 | 0 | 0 | 1 | 15 |
| subtype3 | 5 | 4 | 2 | 4 | 0 | 0 | 0 | 1 | 0 | 5 | 3 | 21 |
Figure S3. Get High-res Image Clustering Approach #1: 'Copy Number Ratio CNMF subtypes' versus Clinical Feature #3: 'NEOPLASM_DISEASESTAGE'

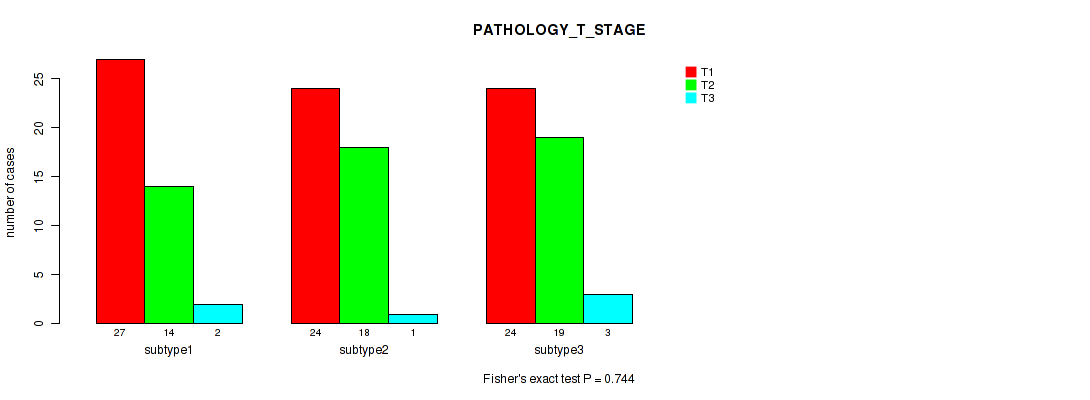
P value = 0.744 (Fisher's exact test), Q value = 0.9
Table S5. Clustering Approach #1: 'Copy Number Ratio CNMF subtypes' versus Clinical Feature #4: 'PATHOLOGY_T_STAGE'
| nPatients | T1 | T2 | T3 |
|---|---|---|---|
| ALL | 75 | 51 | 6 |
| subtype1 | 27 | 14 | 2 |
| subtype2 | 24 | 18 | 1 |
| subtype3 | 24 | 19 | 3 |
Figure S4. Get High-res Image Clustering Approach #1: 'Copy Number Ratio CNMF subtypes' versus Clinical Feature #4: 'PATHOLOGY_T_STAGE'
P value = 0.787 (Fisher's exact test), Q value = 0.92
Table S6. Clustering Approach #1: 'Copy Number Ratio CNMF subtypes' versus Clinical Feature #5: 'PATHOLOGY_N_STAGE'
| nPatients | N0 | N1+N2 |
|---|---|---|
| ALL | 46 | 13 |
| subtype1 | 13 | 5 |
| subtype2 | 13 | 3 |
| subtype3 | 20 | 5 |
Figure S5. Get High-res Image Clustering Approach #1: 'Copy Number Ratio CNMF subtypes' versus Clinical Feature #5: 'PATHOLOGY_N_STAGE'

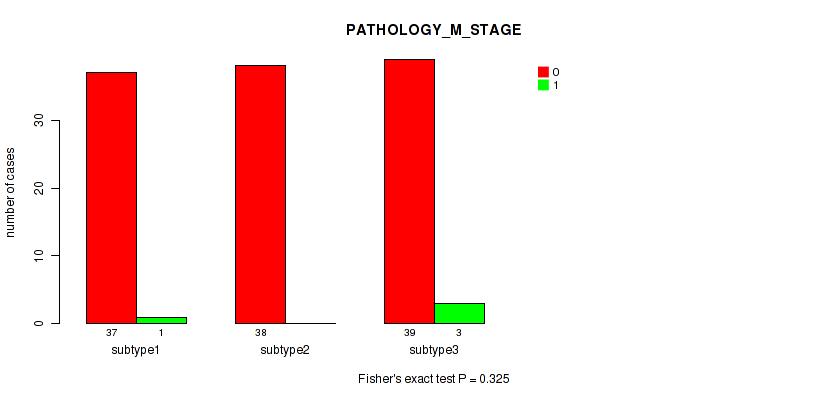
P value = 0.325 (Fisher's exact test), Q value = 0.52
Table S7. Clustering Approach #1: 'Copy Number Ratio CNMF subtypes' versus Clinical Feature #6: 'PATHOLOGY_M_STAGE'
| nPatients | 0 | 1 |
|---|---|---|
| ALL | 114 | 4 |
| subtype1 | 37 | 1 |
| subtype2 | 38 | 0 |
| subtype3 | 39 | 3 |
Figure S6. Get High-res Image Clustering Approach #1: 'Copy Number Ratio CNMF subtypes' versus Clinical Feature #6: 'PATHOLOGY_M_STAGE'
P value = 0.858 (Fisher's exact test), Q value = 0.92
Table S8. Clustering Approach #1: 'Copy Number Ratio CNMF subtypes' versus Clinical Feature #7: 'RACE'
| nPatients | ASIAN | BLACK OR AFRICAN AMERICAN | WHITE |
|---|---|---|---|
| ALL | 4 | 6 | 118 |
| subtype1 | 2 | 3 | 38 |
| subtype2 | 1 | 1 | 38 |
| subtype3 | 1 | 2 | 42 |
Figure S7. Get High-res Image Clustering Approach #1: 'Copy Number Ratio CNMF subtypes' versus Clinical Feature #7: 'RACE'
P value = 0.623 (Fisher's exact test), Q value = 0.79
Table S9. Clustering Approach #1: 'Copy Number Ratio CNMF subtypes' versus Clinical Feature #8: 'ETHNICITY'
| nPatients | HISPANIC OR LATINO | NOT HISPANIC OR LATINO |
|---|---|---|
| ALL | 11 | 111 |
| subtype1 | 2 | 37 |
| subtype2 | 4 | 37 |
| subtype3 | 5 | 37 |
Figure S8. Get High-res Image Clustering Approach #1: 'Copy Number Ratio CNMF subtypes' versus Clinical Feature #8: 'ETHNICITY'
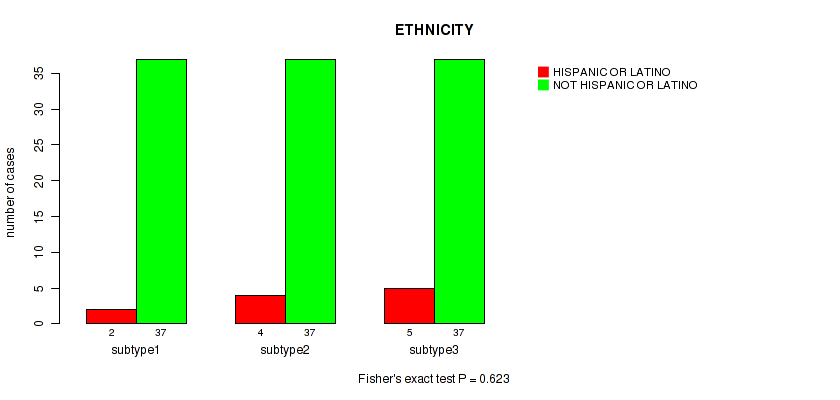
Table S10. Description of clustering approach #2: 'METHLYATION CNMF'
| Cluster Labels | 1 | 2 | 3 |
|---|---|---|---|
| Number of samples | 53 | 45 | 35 |
P value = 0.456 (logrank test), Q value = 0.64
Table S11. Clustering Approach #2: 'METHLYATION CNMF' versus Clinical Feature #1: 'Time to Death'
| nPatients | nDeath | Duration Range (Median), Month | |
|---|---|---|---|
| ALL | 133 | 4 | 0.1 - 229.2 (37.7) |
| subtype1 | 53 | 2 | 0.1 - 191.3 (27.6) |
| subtype2 | 45 | 2 | 0.5 - 229.2 (59.8) |
| subtype3 | 35 | 0 | 0.4 - 184.4 (51.0) |
Figure S9. Get High-res Image Clustering Approach #2: 'METHLYATION CNMF' versus Clinical Feature #1: 'Time to Death'
P value = 0.00219 (Kruskal-Wallis (anova)), Q value = 0.02
Table S12. Clustering Approach #2: 'METHLYATION CNMF' versus Clinical Feature #2: 'YEARS_TO_BIRTH'
| nPatients | Mean (Std.Dev) | |
|---|---|---|
| ALL | 133 | 32.0 (9.3) |
| subtype1 | 53 | 34.3 (8.3) |
| subtype2 | 45 | 28.6 (9.4) |
| subtype3 | 35 | 32.7 (9.8) |
Figure S10. Get High-res Image Clustering Approach #2: 'METHLYATION CNMF' versus Clinical Feature #2: 'YEARS_TO_BIRTH'
P value = 0.00394 (Fisher's exact test), Q value = 0.029
Table S13. Clustering Approach #2: 'METHLYATION CNMF' versus Clinical Feature #3: 'NEOPLASM_DISEASESTAGE'
| nPatients | STAGE I | STAGE IA | STAGE IB | STAGE II | STAGE IIA | STAGE IIB | STAGE IIC | STAGE III | STAGE IIIA | STAGE IIIB | STAGE IIIC | STAGE IS |
|---|---|---|---|---|---|---|---|---|---|---|---|---|
| ALL | 19 | 25 | 11 | 5 | 6 | 1 | 1 | 2 | 1 | 6 | 5 | 46 |
| subtype1 | 9 | 18 | 5 | 0 | 1 | 1 | 1 | 0 | 0 | 1 | 0 | 15 |
| subtype2 | 4 | 3 | 4 | 3 | 5 | 0 | 0 | 1 | 1 | 4 | 2 | 16 |
| subtype3 | 6 | 4 | 2 | 2 | 0 | 0 | 0 | 1 | 0 | 1 | 3 | 15 |
Figure S11. Get High-res Image Clustering Approach #2: 'METHLYATION CNMF' versus Clinical Feature #3: 'NEOPLASM_DISEASESTAGE'
P value = 0.0132 (Fisher's exact test), Q value = 0.05
Table S14. Clustering Approach #2: 'METHLYATION CNMF' versus Clinical Feature #4: 'PATHOLOGY_T_STAGE'
| nPatients | T1 | T2 | T3 |
|---|---|---|---|
| ALL | 75 | 51 | 6 |
| subtype1 | 34 | 16 | 2 |
| subtype2 | 18 | 26 | 1 |
| subtype3 | 23 | 9 | 3 |
Figure S12. Get High-res Image Clustering Approach #2: 'METHLYATION CNMF' versus Clinical Feature #4: 'PATHOLOGY_T_STAGE'
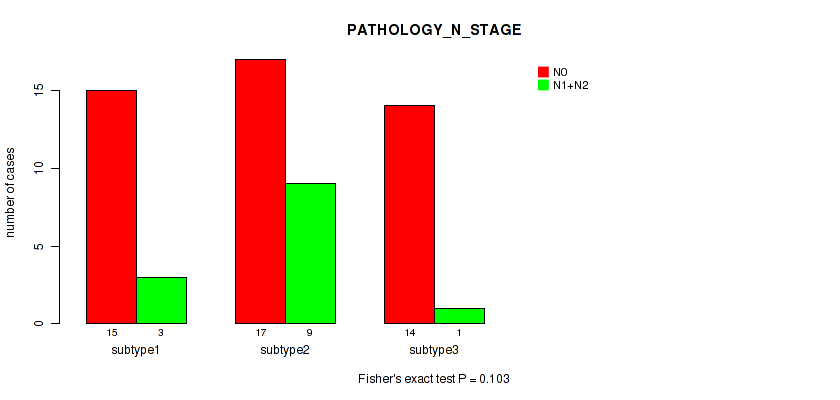
P value = 0.103 (Fisher's exact test), Q value = 0.23
Table S15. Clustering Approach #2: 'METHLYATION CNMF' versus Clinical Feature #5: 'PATHOLOGY_N_STAGE'
| nPatients | N0 | N1+N2 |
|---|---|---|
| ALL | 46 | 13 |
| subtype1 | 15 | 3 |
| subtype2 | 17 | 9 |
| subtype3 | 14 | 1 |
Figure S13. Get High-res Image Clustering Approach #2: 'METHLYATION CNMF' versus Clinical Feature #5: 'PATHOLOGY_N_STAGE'
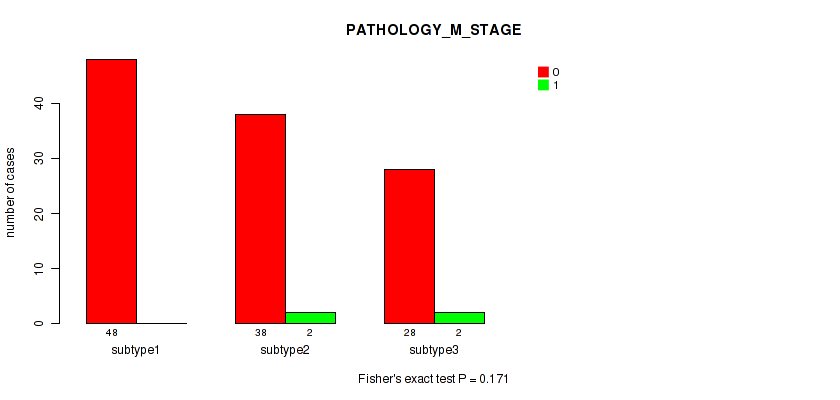
P value = 0.171 (Fisher's exact test), Q value = 0.35
Table S16. Clustering Approach #2: 'METHLYATION CNMF' versus Clinical Feature #6: 'PATHOLOGY_M_STAGE'
| nPatients | 0 | 1 |
|---|---|---|
| ALL | 114 | 4 |
| subtype1 | 48 | 0 |
| subtype2 | 38 | 2 |
| subtype3 | 28 | 2 |
Figure S14. Get High-res Image Clustering Approach #2: 'METHLYATION CNMF' versus Clinical Feature #6: 'PATHOLOGY_M_STAGE'
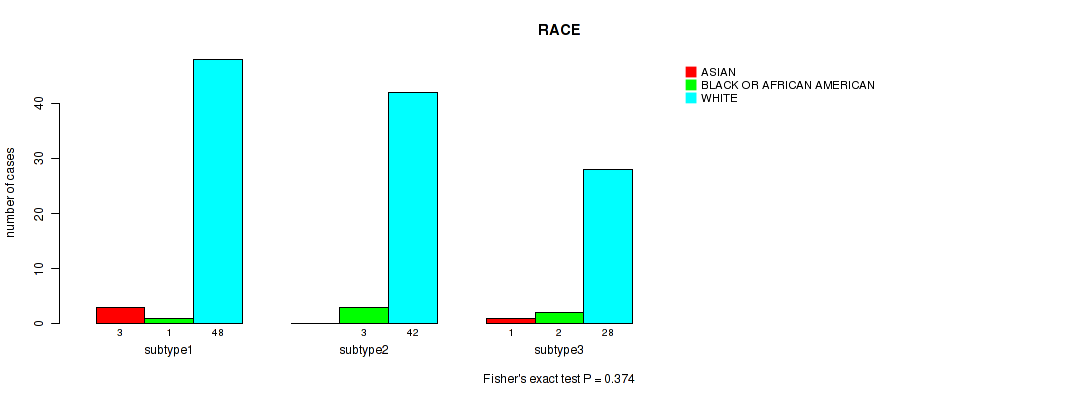
P value = 0.374 (Fisher's exact test), Q value = 0.53
Table S17. Clustering Approach #2: 'METHLYATION CNMF' versus Clinical Feature #7: 'RACE'
| nPatients | ASIAN | BLACK OR AFRICAN AMERICAN | WHITE |
|---|---|---|---|
| ALL | 4 | 6 | 118 |
| subtype1 | 3 | 1 | 48 |
| subtype2 | 0 | 3 | 42 |
| subtype3 | 1 | 2 | 28 |
Figure S15. Get High-res Image Clustering Approach #2: 'METHLYATION CNMF' versus Clinical Feature #7: 'RACE'
P value = 0.662 (Fisher's exact test), Q value = 0.83
Table S18. Clustering Approach #2: 'METHLYATION CNMF' versus Clinical Feature #8: 'ETHNICITY'
| nPatients | HISPANIC OR LATINO | NOT HISPANIC OR LATINO |
|---|---|---|
| ALL | 11 | 111 |
| subtype1 | 4 | 48 |
| subtype2 | 3 | 37 |
| subtype3 | 4 | 26 |
Figure S16. Get High-res Image Clustering Approach #2: 'METHLYATION CNMF' versus Clinical Feature #8: 'ETHNICITY'
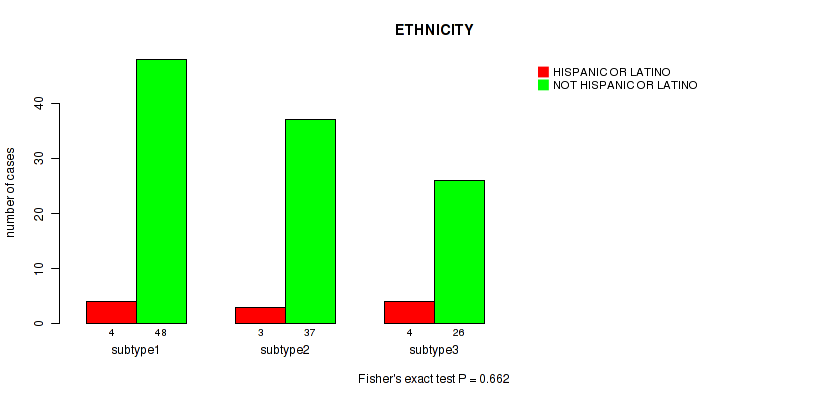
Table S19. Description of clustering approach #3: 'RPPA CNMF subtypes'
| Cluster Labels | 1 | 2 | 3 | 4 |
|---|---|---|---|---|
| Number of samples | 47 | 11 | 27 | 18 |
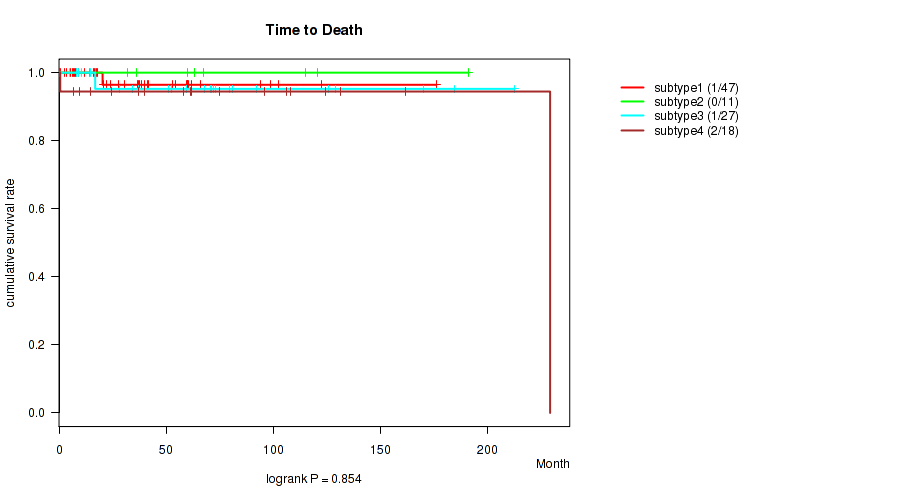
P value = 0.854 (logrank test), Q value = 0.92
Table S20. Clustering Approach #3: 'RPPA CNMF subtypes' versus Clinical Feature #1: 'Time to Death'
| nPatients | nDeath | Duration Range (Median), Month | |
|---|---|---|---|
| ALL | 103 | 4 | 0.1 - 229.2 (41.5) |
| subtype1 | 47 | 1 | 0.1 - 176.2 (27.6) |
| subtype2 | 11 | 0 | 14.1 - 191.3 (63.2) |
| subtype3 | 27 | 1 | 4.9 - 212.7 (59.6) |
| subtype4 | 18 | 2 | 0.6 - 229.2 (61.6) |
Figure S17. Get High-res Image Clustering Approach #3: 'RPPA CNMF subtypes' versus Clinical Feature #1: 'Time to Death'
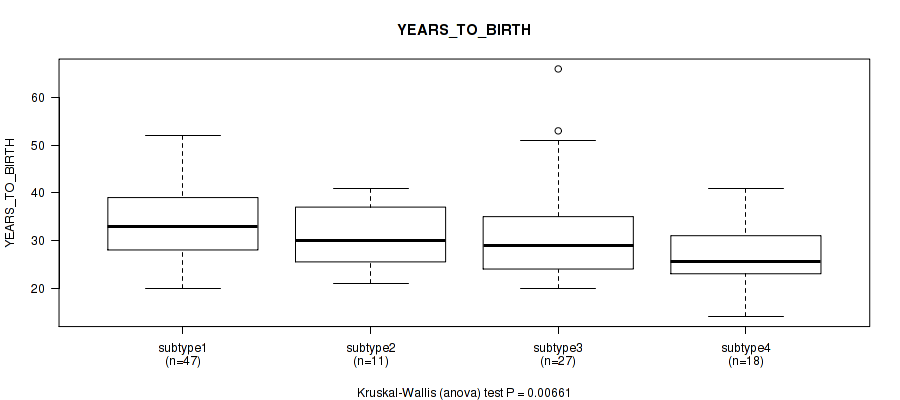
P value = 0.00661 (Kruskal-Wallis (anova)), Q value = 0.03
Table S21. Clustering Approach #3: 'RPPA CNMF subtypes' versus Clinical Feature #2: 'YEARS_TO_BIRTH'
| nPatients | Mean (Std.Dev) | |
|---|---|---|
| ALL | 103 | 32.0 (9.0) |
| subtype1 | 47 | 34.3 (8.2) |
| subtype2 | 11 | 31.1 (7.1) |
| subtype3 | 27 | 32.0 (10.8) |
| subtype4 | 18 | 26.3 (7.0) |
Figure S18. Get High-res Image Clustering Approach #3: 'RPPA CNMF subtypes' versus Clinical Feature #2: 'YEARS_TO_BIRTH'
P value = 6e-05 (Fisher's exact test), Q value = 0.0044
Table S22. Clustering Approach #3: 'RPPA CNMF subtypes' versus Clinical Feature #3: 'NEOPLASM_DISEASESTAGE'
| nPatients | STAGE I | STAGE IA | STAGE IB | STAGE II | STAGE IIA | STAGE IIC | STAGE III | STAGE IIIA | STAGE IIIB | STAGE IIIC | STAGE IS |
|---|---|---|---|---|---|---|---|---|---|---|---|
| ALL | 14 | 20 | 8 | 5 | 3 | 1 | 1 | 1 | 5 | 4 | 38 |
| subtype1 | 11 | 13 | 4 | 0 | 0 | 1 | 0 | 0 | 0 | 2 | 15 |
| subtype2 | 0 | 1 | 4 | 0 | 2 | 0 | 0 | 1 | 1 | 0 | 2 |
| subtype3 | 3 | 3 | 0 | 2 | 0 | 0 | 1 | 0 | 2 | 1 | 14 |
| subtype4 | 0 | 3 | 0 | 3 | 1 | 0 | 0 | 0 | 2 | 1 | 7 |
Figure S19. Get High-res Image Clustering Approach #3: 'RPPA CNMF subtypes' versus Clinical Feature #3: 'NEOPLASM_DISEASESTAGE'
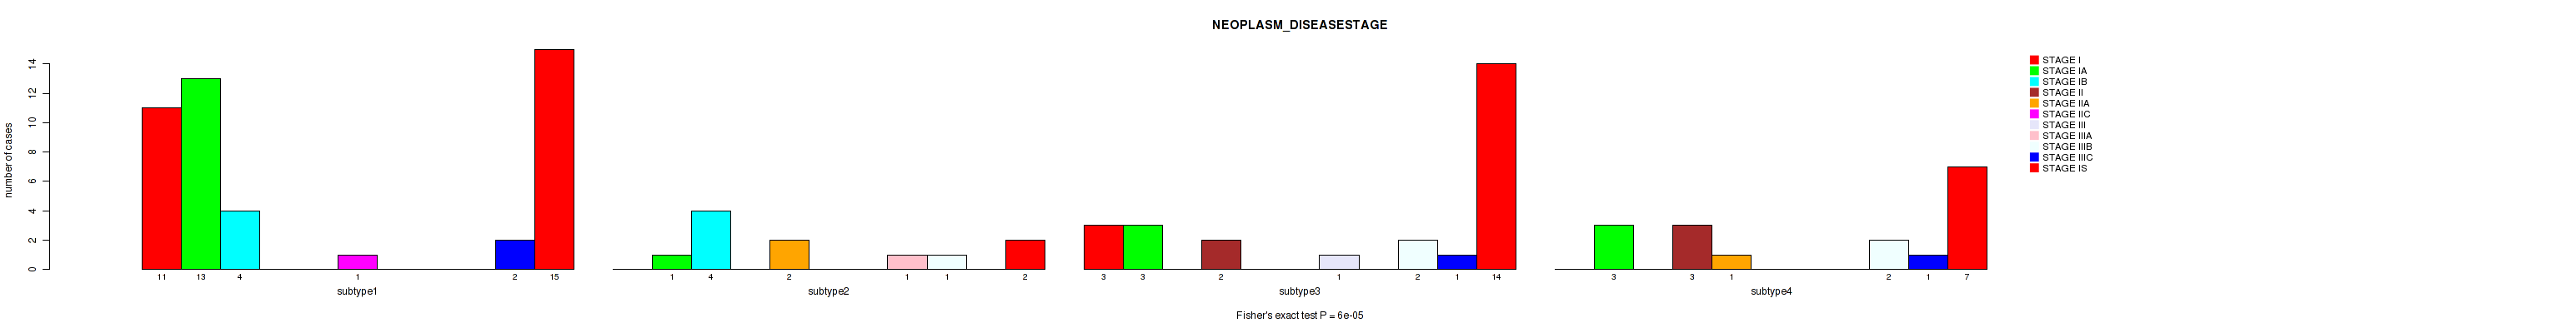
P value = 0.00011 (Fisher's exact test), Q value = 0.0044
Table S23. Clustering Approach #3: 'RPPA CNMF subtypes' versus Clinical Feature #4: 'PATHOLOGY_T_STAGE'
| nPatients | T1 | T2 | T3 |
|---|---|---|---|
| ALL | 60 | 40 | 3 |
| subtype1 | 31 | 16 | 0 |
| subtype2 | 2 | 9 | 0 |
| subtype3 | 21 | 4 | 2 |
| subtype4 | 6 | 11 | 1 |
Figure S20. Get High-res Image Clustering Approach #3: 'RPPA CNMF subtypes' versus Clinical Feature #4: 'PATHOLOGY_T_STAGE'
P value = 0.0156 (Fisher's exact test), Q value = 0.053
Table S24. Clustering Approach #3: 'RPPA CNMF subtypes' versus Clinical Feature #5: 'PATHOLOGY_N_STAGE'
| nPatients | N0 | N1+N2 |
|---|---|---|
| ALL | 40 | 9 |
| subtype1 | 16 | 0 |
| subtype2 | 5 | 4 |
| subtype3 | 12 | 2 |
| subtype4 | 7 | 3 |
Figure S21. Get High-res Image Clustering Approach #3: 'RPPA CNMF subtypes' versus Clinical Feature #5: 'PATHOLOGY_N_STAGE'
P value = 0.033 (Fisher's exact test), Q value = 0.085
Table S25. Clustering Approach #3: 'RPPA CNMF subtypes' versus Clinical Feature #6: 'PATHOLOGY_M_STAGE'
| nPatients | 0 | 1 |
|---|---|---|
| ALL | 89 | 4 |
| subtype1 | 43 | 0 |
| subtype2 | 9 | 1 |
| subtype3 | 21 | 3 |
| subtype4 | 16 | 0 |
Figure S22. Get High-res Image Clustering Approach #3: 'RPPA CNMF subtypes' versus Clinical Feature #6: 'PATHOLOGY_M_STAGE'
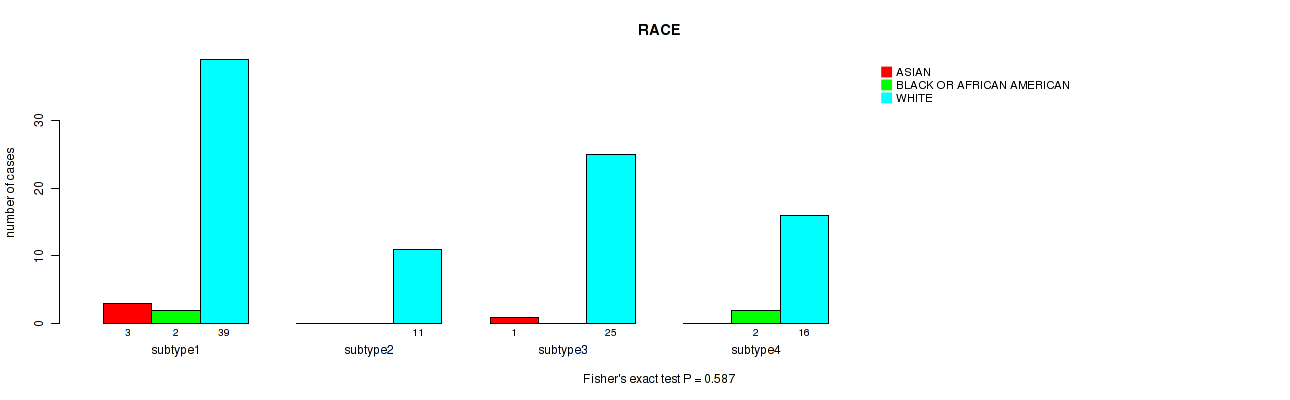
P value = 0.587 (Fisher's exact test), Q value = 0.76
Table S26. Clustering Approach #3: 'RPPA CNMF subtypes' versus Clinical Feature #7: 'RACE'
| nPatients | ASIAN | BLACK OR AFRICAN AMERICAN | WHITE |
|---|---|---|---|
| ALL | 4 | 4 | 91 |
| subtype1 | 3 | 2 | 39 |
| subtype2 | 0 | 0 | 11 |
| subtype3 | 1 | 0 | 25 |
| subtype4 | 0 | 2 | 16 |
Figure S23. Get High-res Image Clustering Approach #3: 'RPPA CNMF subtypes' versus Clinical Feature #7: 'RACE'
P value = 0.84 (Fisher's exact test), Q value = 0.92
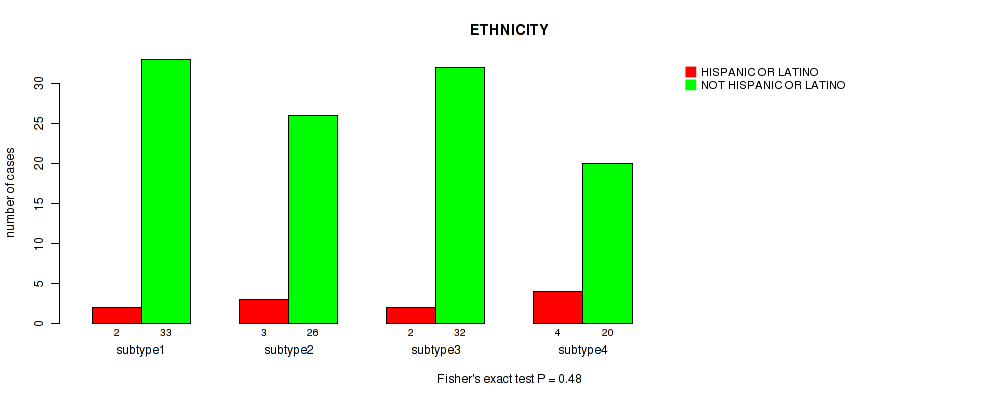
Table S27. Clustering Approach #3: 'RPPA CNMF subtypes' versus Clinical Feature #8: 'ETHNICITY'
| nPatients | HISPANIC OR LATINO | NOT HISPANIC OR LATINO |
|---|---|---|
| ALL | 9 | 85 |
| subtype1 | 5 | 39 |
| subtype2 | 0 | 10 |
| subtype3 | 3 | 21 |
| subtype4 | 1 | 15 |
Figure S24. Get High-res Image Clustering Approach #3: 'RPPA CNMF subtypes' versus Clinical Feature #8: 'ETHNICITY'
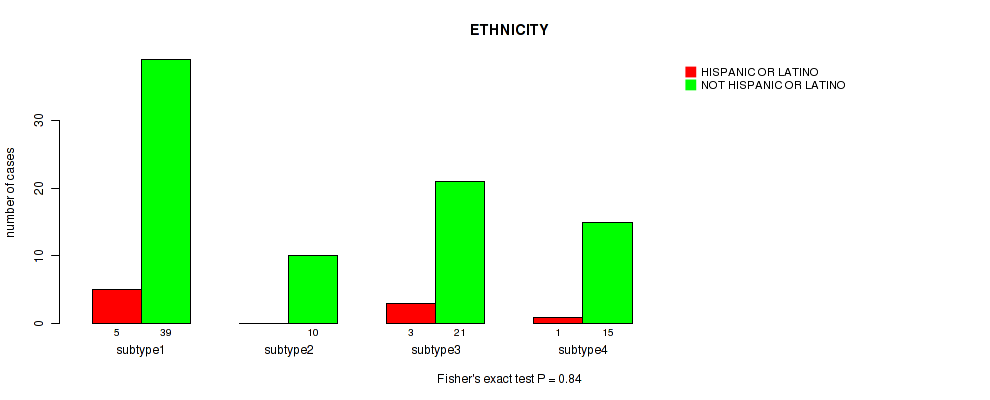
Table S28. Description of clustering approach #4: 'RPPA cHierClus subtypes'
| Cluster Labels | 1 | 2 | 3 |
|---|---|---|---|
| Number of samples | 49 | 19 | 35 |
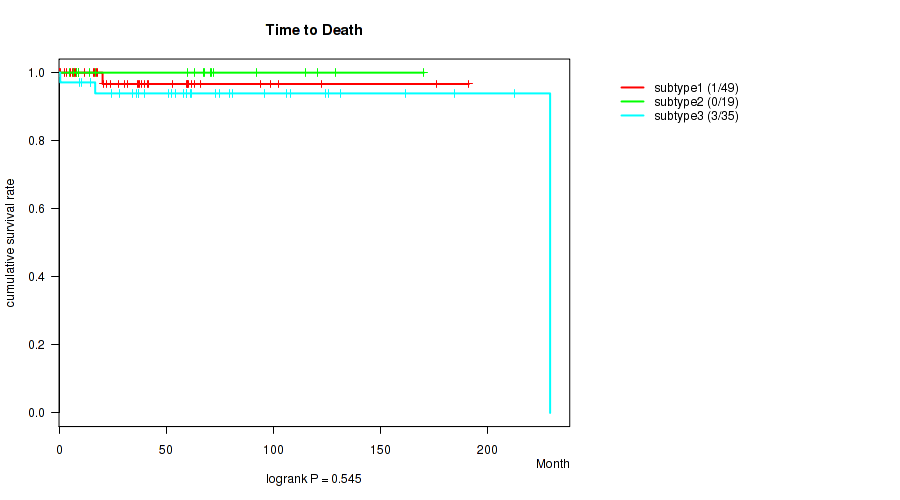
P value = 0.545 (logrank test), Q value = 0.72
Table S29. Clustering Approach #4: 'RPPA cHierClus subtypes' versus Clinical Feature #1: 'Time to Death'
| nPatients | nDeath | Duration Range (Median), Month | |
|---|---|---|---|
| ALL | 103 | 4 | 0.1 - 229.2 (41.5) |
| subtype1 | 49 | 1 | 0.1 - 191.3 (30.4) |
| subtype2 | 19 | 0 | 4.9 - 170.3 (67.7) |
| subtype3 | 35 | 3 | 0.6 - 229.2 (59.3) |
Figure S25. Get High-res Image Clustering Approach #4: 'RPPA cHierClus subtypes' versus Clinical Feature #1: 'Time to Death'
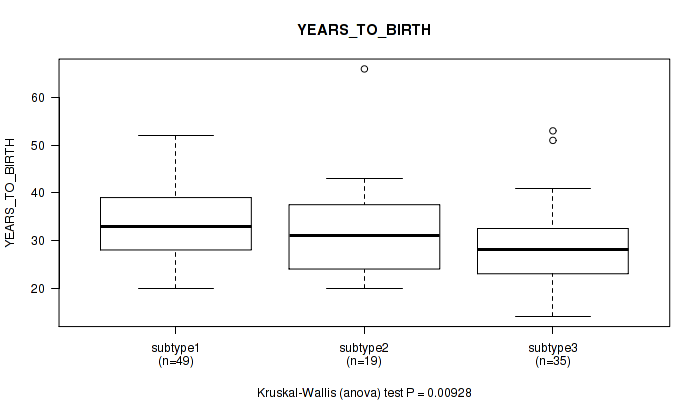
P value = 0.00928 (Kruskal-Wallis (anova)), Q value = 0.039
Table S30. Clustering Approach #4: 'RPPA cHierClus subtypes' versus Clinical Feature #2: 'YEARS_TO_BIRTH'
| nPatients | Mean (Std.Dev) | |
|---|---|---|
| ALL | 103 | 32.0 (9.0) |
| subtype1 | 49 | 34.1 (8.0) |
| subtype2 | 19 | 32.3 (10.9) |
| subtype3 | 35 | 28.7 (8.5) |
Figure S26. Get High-res Image Clustering Approach #4: 'RPPA cHierClus subtypes' versus Clinical Feature #2: 'YEARS_TO_BIRTH'
P value = 0.00357 (Fisher's exact test), Q value = 0.029
Table S31. Clustering Approach #4: 'RPPA cHierClus subtypes' versus Clinical Feature #3: 'NEOPLASM_DISEASESTAGE'
| nPatients | STAGE I | STAGE IA | STAGE IB | STAGE II | STAGE IIA | STAGE IIC | STAGE III | STAGE IIIA | STAGE IIIB | STAGE IIIC | STAGE IS |
|---|---|---|---|---|---|---|---|---|---|---|---|
| ALL | 14 | 20 | 8 | 5 | 3 | 1 | 1 | 1 | 5 | 4 | 38 |
| subtype1 | 11 | 14 | 3 | 0 | 0 | 1 | 0 | 0 | 1 | 2 | 16 |
| subtype2 | 0 | 3 | 4 | 1 | 1 | 0 | 0 | 1 | 1 | 1 | 6 |
| subtype3 | 3 | 3 | 1 | 4 | 2 | 0 | 1 | 0 | 3 | 1 | 16 |
Figure S27. Get High-res Image Clustering Approach #4: 'RPPA cHierClus subtypes' versus Clinical Feature #3: 'NEOPLASM_DISEASESTAGE'
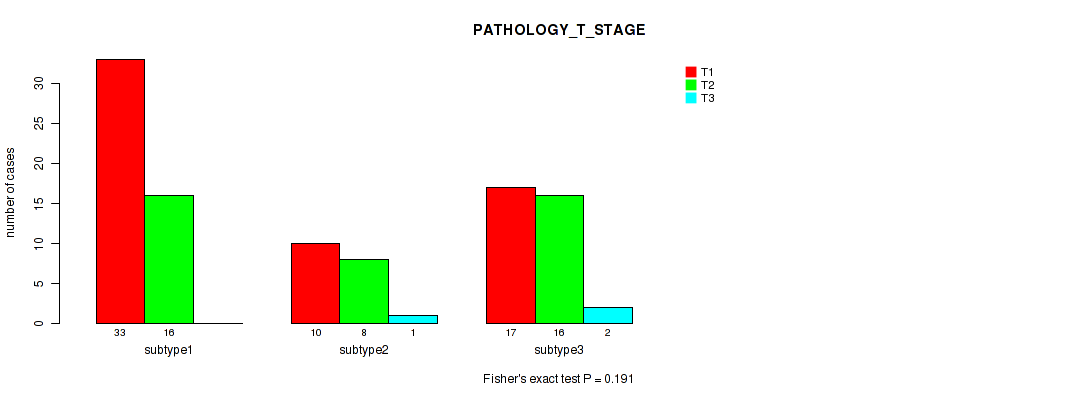
P value = 0.191 (Fisher's exact test), Q value = 0.37
Table S32. Clustering Approach #4: 'RPPA cHierClus subtypes' versus Clinical Feature #4: 'PATHOLOGY_T_STAGE'
| nPatients | T1 | T2 | T3 |
|---|---|---|---|
| ALL | 60 | 40 | 3 |
| subtype1 | 33 | 16 | 0 |
| subtype2 | 10 | 8 | 1 |
| subtype3 | 17 | 16 | 2 |
Figure S28. Get High-res Image Clustering Approach #4: 'RPPA cHierClus subtypes' versus Clinical Feature #4: 'PATHOLOGY_T_STAGE'
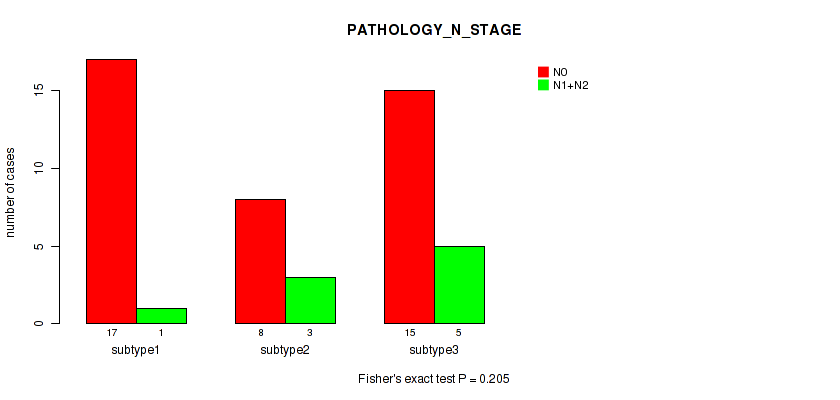
P value = 0.205 (Fisher's exact test), Q value = 0.38
Table S33. Clustering Approach #4: 'RPPA cHierClus subtypes' versus Clinical Feature #5: 'PATHOLOGY_N_STAGE'
| nPatients | N0 | N1+N2 |
|---|---|---|
| ALL | 40 | 9 |
| subtype1 | 17 | 1 |
| subtype2 | 8 | 3 |
| subtype3 | 15 | 5 |
Figure S29. Get High-res Image Clustering Approach #4: 'RPPA cHierClus subtypes' versus Clinical Feature #5: 'PATHOLOGY_N_STAGE'
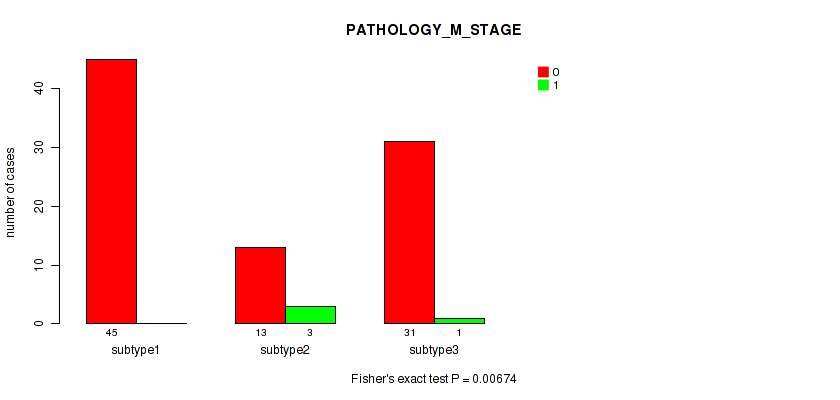
P value = 0.00674 (Fisher's exact test), Q value = 0.03
Table S34. Clustering Approach #4: 'RPPA cHierClus subtypes' versus Clinical Feature #6: 'PATHOLOGY_M_STAGE'
| nPatients | 0 | 1 |
|---|---|---|
| ALL | 89 | 4 |
| subtype1 | 45 | 0 |
| subtype2 | 13 | 3 |
| subtype3 | 31 | 1 |
Figure S30. Get High-res Image Clustering Approach #4: 'RPPA cHierClus subtypes' versus Clinical Feature #6: 'PATHOLOGY_M_STAGE'
P value = 0.837 (Fisher's exact test), Q value = 0.92
Table S35. Clustering Approach #4: 'RPPA cHierClus subtypes' versus Clinical Feature #7: 'RACE'
| nPatients | ASIAN | BLACK OR AFRICAN AMERICAN | WHITE |
|---|---|---|---|
| ALL | 4 | 4 | 91 |
| subtype1 | 3 | 2 | 42 |
| subtype2 | 0 | 0 | 18 |
| subtype3 | 1 | 2 | 31 |
Figure S31. Get High-res Image Clustering Approach #4: 'RPPA cHierClus subtypes' versus Clinical Feature #7: 'RACE'

P value = 0.719 (Fisher's exact test), Q value = 0.88
Table S36. Clustering Approach #4: 'RPPA cHierClus subtypes' versus Clinical Feature #8: 'ETHNICITY'
| nPatients | HISPANIC OR LATINO | NOT HISPANIC OR LATINO |
|---|---|---|
| ALL | 9 | 85 |
| subtype1 | 5 | 41 |
| subtype2 | 2 | 14 |
| subtype3 | 2 | 30 |
Figure S32. Get High-res Image Clustering Approach #4: 'RPPA cHierClus subtypes' versus Clinical Feature #8: 'ETHNICITY'
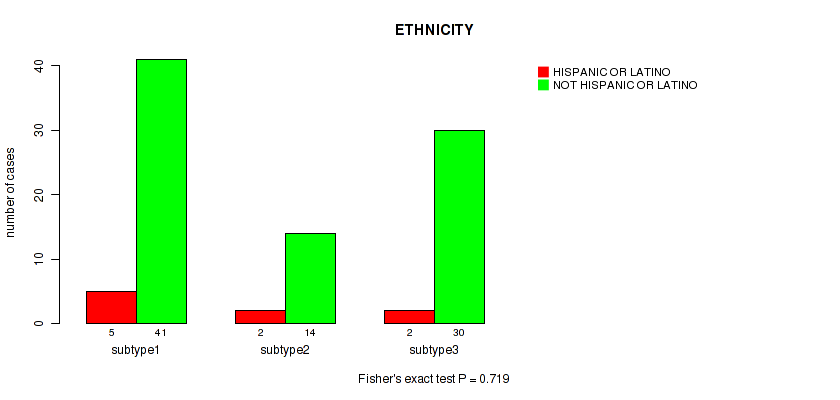
Table S37. Description of clustering approach #5: 'RNAseq CNMF subtypes'
| Cluster Labels | 1 | 2 | 3 |
|---|---|---|---|
| Number of samples | 68 | 36 | 29 |
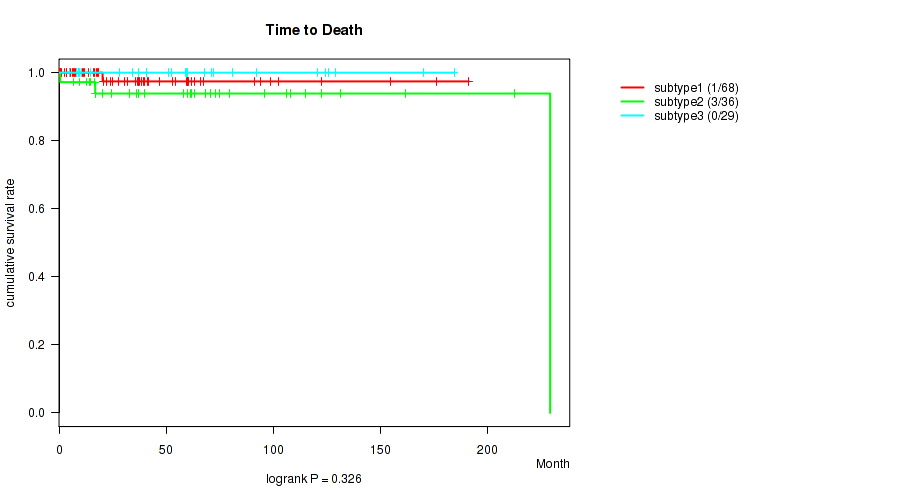
P value = 0.326 (logrank test), Q value = 0.52
Table S38. Clustering Approach #5: 'RNAseq CNMF subtypes' versus Clinical Feature #1: 'Time to Death'
| nPatients | nDeath | Duration Range (Median), Month | |
|---|---|---|---|
| ALL | 133 | 4 | 0.1 - 229.2 (37.7) |
| subtype1 | 68 | 1 | 0.1 - 191.3 (26.3) |
| subtype2 | 36 | 3 | 0.6 - 229.2 (60.8) |
| subtype3 | 29 | 0 | 4.9 - 184.4 (58.9) |
Figure S33. Get High-res Image Clustering Approach #5: 'RNAseq CNMF subtypes' versus Clinical Feature #1: 'Time to Death'
P value = 0.00485 (Kruskal-Wallis (anova)), Q value = 0.029
Table S39. Clustering Approach #5: 'RNAseq CNMF subtypes' versus Clinical Feature #2: 'YEARS_TO_BIRTH'
| nPatients | Mean (Std.Dev) | |
|---|---|---|
| ALL | 133 | 32.0 (9.3) |
| subtype1 | 68 | 33.8 (8.1) |
| subtype2 | 36 | 28.8 (10.1) |
| subtype3 | 29 | 31.6 (10.3) |
Figure S34. Get High-res Image Clustering Approach #5: 'RNAseq CNMF subtypes' versus Clinical Feature #2: 'YEARS_TO_BIRTH'

P value = 0.00061 (Fisher's exact test), Q value = 0.0098
Table S40. Clustering Approach #5: 'RNAseq CNMF subtypes' versus Clinical Feature #3: 'NEOPLASM_DISEASESTAGE'
| nPatients | STAGE I | STAGE IA | STAGE IB | STAGE II | STAGE IIA | STAGE IIB | STAGE IIC | STAGE III | STAGE IIIA | STAGE IIIB | STAGE IIIC | STAGE IS |
|---|---|---|---|---|---|---|---|---|---|---|---|---|
| ALL | 19 | 25 | 11 | 5 | 6 | 1 | 1 | 2 | 1 | 6 | 5 | 46 |
| subtype1 | 15 | 19 | 7 | 0 | 1 | 1 | 1 | 0 | 0 | 1 | 2 | 18 |
| subtype2 | 2 | 3 | 4 | 3 | 4 | 0 | 0 | 1 | 1 | 3 | 1 | 13 |
| subtype3 | 2 | 3 | 0 | 2 | 1 | 0 | 0 | 1 | 0 | 2 | 2 | 15 |
Figure S35. Get High-res Image Clustering Approach #5: 'RNAseq CNMF subtypes' versus Clinical Feature #3: 'NEOPLASM_DISEASESTAGE'
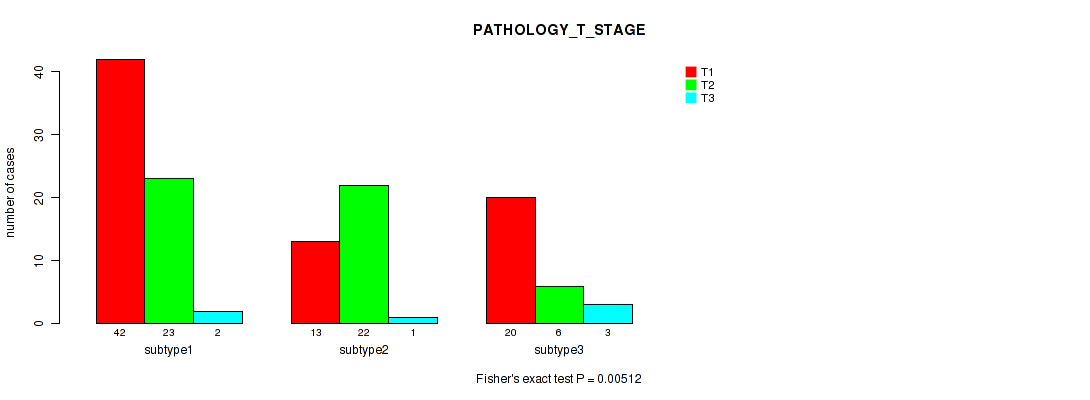
P value = 0.00512 (Fisher's exact test), Q value = 0.029
Table S41. Clustering Approach #5: 'RNAseq CNMF subtypes' versus Clinical Feature #4: 'PATHOLOGY_T_STAGE'
| nPatients | T1 | T2 | T3 |
|---|---|---|---|
| ALL | 75 | 51 | 6 |
| subtype1 | 42 | 23 | 2 |
| subtype2 | 13 | 22 | 1 |
| subtype3 | 20 | 6 | 3 |
Figure S36. Get High-res Image Clustering Approach #5: 'RNAseq CNMF subtypes' versus Clinical Feature #4: 'PATHOLOGY_T_STAGE'
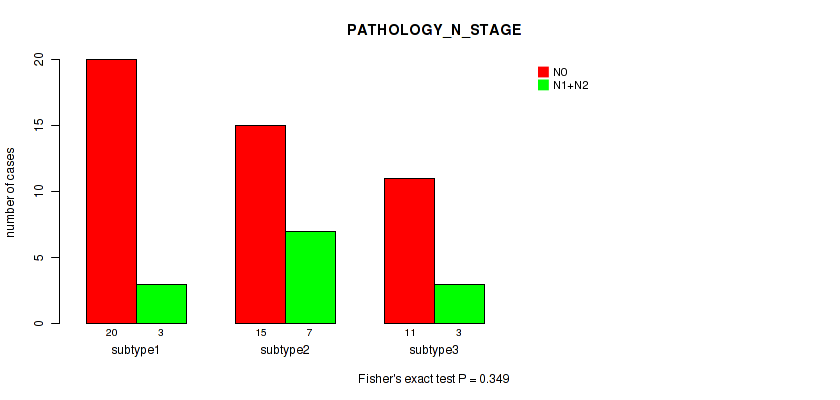
P value = 0.349 (Fisher's exact test), Q value = 0.53
Table S42. Clustering Approach #5: 'RNAseq CNMF subtypes' versus Clinical Feature #5: 'PATHOLOGY_N_STAGE'
| nPatients | N0 | N1+N2 |
|---|---|---|
| ALL | 46 | 13 |
| subtype1 | 20 | 3 |
| subtype2 | 15 | 7 |
| subtype3 | 11 | 3 |
Figure S37. Get High-res Image Clustering Approach #5: 'RNAseq CNMF subtypes' versus Clinical Feature #5: 'PATHOLOGY_N_STAGE'
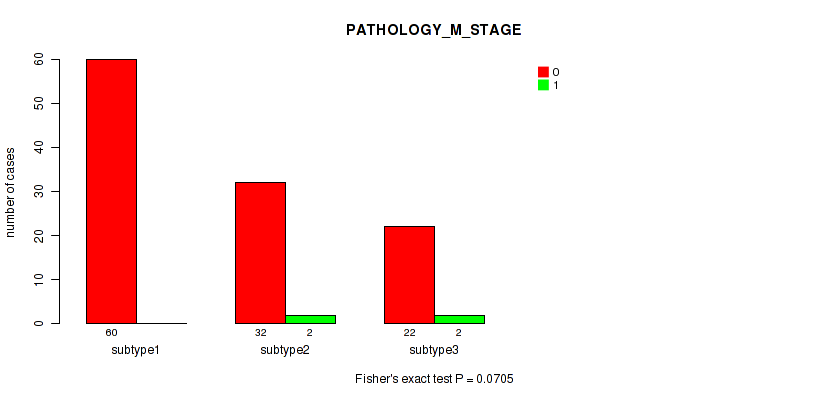
P value = 0.0705 (Fisher's exact test), Q value = 0.17
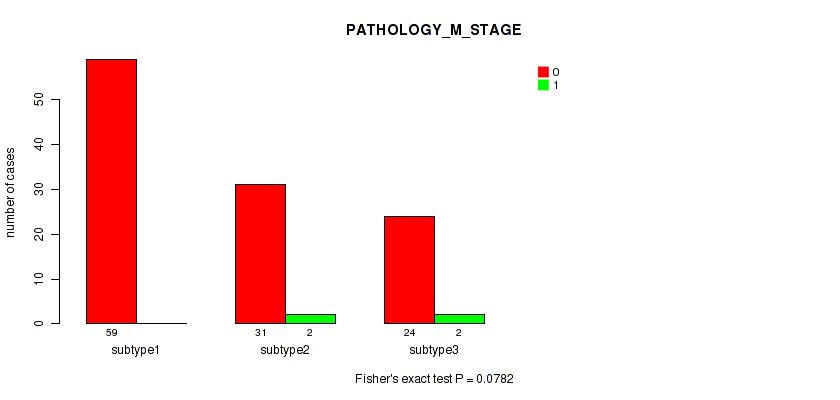
Table S43. Clustering Approach #5: 'RNAseq CNMF subtypes' versus Clinical Feature #6: 'PATHOLOGY_M_STAGE'
| nPatients | 0 | 1 |
|---|---|---|
| ALL | 114 | 4 |
| subtype1 | 60 | 0 |
| subtype2 | 32 | 2 |
| subtype3 | 22 | 2 |
Figure S38. Get High-res Image Clustering Approach #5: 'RNAseq CNMF subtypes' versus Clinical Feature #6: 'PATHOLOGY_M_STAGE'
P value = 0.861 (Fisher's exact test), Q value = 0.92
Table S44. Clustering Approach #5: 'RNAseq CNMF subtypes' versus Clinical Feature #7: 'RACE'
| nPatients | ASIAN | BLACK OR AFRICAN AMERICAN | WHITE |
|---|---|---|---|
| ALL | 4 | 6 | 118 |
| subtype1 | 3 | 3 | 59 |
| subtype2 | 0 | 2 | 34 |
| subtype3 | 1 | 1 | 25 |
Figure S39. Get High-res Image Clustering Approach #5: 'RNAseq CNMF subtypes' versus Clinical Feature #7: 'RACE'

P value = 0.37 (Fisher's exact test), Q value = 0.53
Table S45. Clustering Approach #5: 'RNAseq CNMF subtypes' versus Clinical Feature #8: 'ETHNICITY'
| nPatients | HISPANIC OR LATINO | NOT HISPANIC OR LATINO |
|---|---|---|
| ALL | 11 | 111 |
| subtype1 | 5 | 59 |
| subtype2 | 2 | 32 |
| subtype3 | 4 | 20 |
Figure S40. Get High-res Image Clustering Approach #5: 'RNAseq CNMF subtypes' versus Clinical Feature #8: 'ETHNICITY'

Table S46. Description of clustering approach #6: 'RNAseq cHierClus subtypes'
| Cluster Labels | 1 | 2 | 3 | 4 | 5 | 6 | 7 |
|---|---|---|---|---|---|---|---|
| Number of samples | 42 | 26 | 10 | 17 | 8 | 20 | 10 |
P value = 0.018 (logrank test), Q value = 0.053
Table S47. Clustering Approach #6: 'RNAseq cHierClus subtypes' versus Clinical Feature #1: 'Time to Death'
| nPatients | nDeath | Duration Range (Median), Month | |
|---|---|---|---|
| ALL | 133 | 4 | 0.1 - 229.2 (37.7) |
| subtype1 | 42 | 1 | 0.1 - 154.6 (22.8) |
| subtype2 | 26 | 0 | 0.4 - 191.3 (29.0) |
| subtype3 | 10 | 2 | 0.6 - 212.7 (43.7) |
| subtype4 | 17 | 0 | 8.9 - 184.4 (68.0) |
| subtype5 | 8 | 0 | 6.9 - 161.7 (38.7) |
| subtype6 | 20 | 1 | 12.9 - 229.2 (61.6) |
| subtype7 | 10 | 0 | 4.9 - 125.7 (40.8) |
Figure S41. Get High-res Image Clustering Approach #6: 'RNAseq cHierClus subtypes' versus Clinical Feature #1: 'Time to Death'

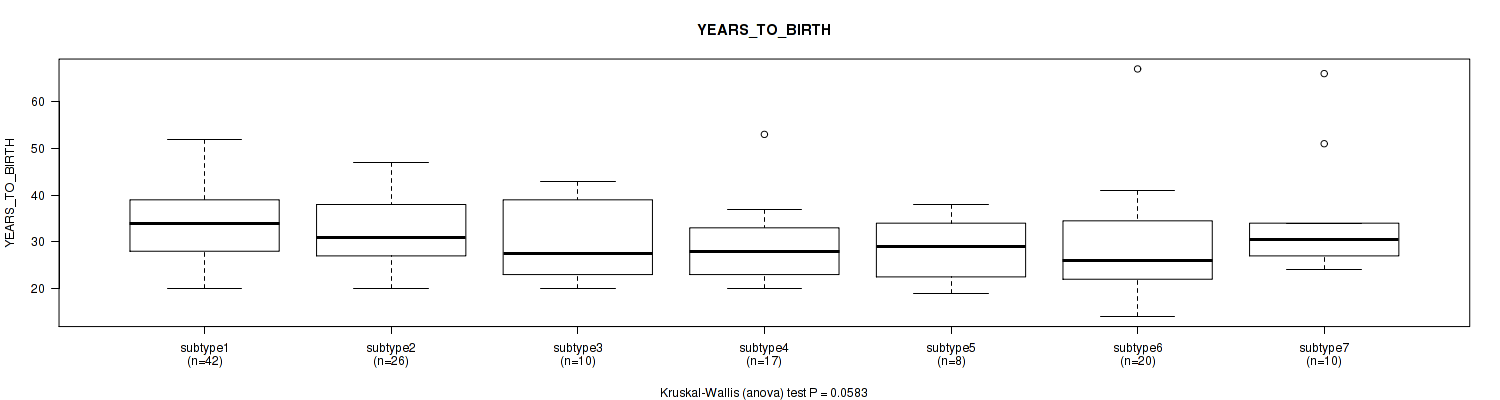
P value = 0.0583 (Kruskal-Wallis (anova)), Q value = 0.14
Table S48. Clustering Approach #6: 'RNAseq cHierClus subtypes' versus Clinical Feature #2: 'YEARS_TO_BIRTH'
| nPatients | Mean (Std.Dev) | |
|---|---|---|
| ALL | 133 | 32.0 (9.3) |
| subtype1 | 42 | 34.7 (8.7) |
| subtype2 | 26 | 32.5 (7.0) |
| subtype3 | 10 | 30.0 (8.4) |
| subtype4 | 17 | 29.0 (8.3) |
| subtype5 | 8 | 28.5 (6.8) |
| subtype6 | 20 | 29.0 (11.9) |
| subtype7 | 10 | 35.0 (13.2) |
Figure S42. Get High-res Image Clustering Approach #6: 'RNAseq cHierClus subtypes' versus Clinical Feature #2: 'YEARS_TO_BIRTH'
P value = 0.00571 (Fisher's exact test), Q value = 0.03
Table S49. Clustering Approach #6: 'RNAseq cHierClus subtypes' versus Clinical Feature #3: 'NEOPLASM_DISEASESTAGE'
| nPatients | STAGE I | STAGE IA | STAGE IB | STAGE II | STAGE IIA | STAGE IIB | STAGE IIC | STAGE III | STAGE IIIA | STAGE IIIB | STAGE IIIC | STAGE IS |
|---|---|---|---|---|---|---|---|---|---|---|---|---|
| ALL | 19 | 25 | 11 | 5 | 6 | 1 | 1 | 2 | 1 | 6 | 5 | 46 |
| subtype1 | 9 | 12 | 5 | 0 | 1 | 0 | 1 | 0 | 0 | 1 | 2 | 9 |
| subtype2 | 6 | 7 | 2 | 0 | 0 | 1 | 0 | 0 | 0 | 0 | 0 | 9 |
| subtype3 | 1 | 0 | 1 | 0 | 0 | 0 | 0 | 0 | 0 | 2 | 1 | 5 |
| subtype4 | 2 | 2 | 0 | 1 | 1 | 0 | 0 | 0 | 0 | 1 | 1 | 9 |
| subtype5 | 0 | 0 | 2 | 1 | 3 | 0 | 0 | 0 | 1 | 0 | 0 | 1 |
| subtype6 | 1 | 3 | 1 | 2 | 1 | 0 | 0 | 1 | 0 | 2 | 0 | 8 |
| subtype7 | 0 | 1 | 0 | 1 | 0 | 0 | 0 | 1 | 0 | 0 | 1 | 5 |
Figure S43. Get High-res Image Clustering Approach #6: 'RNAseq cHierClus subtypes' versus Clinical Feature #3: 'NEOPLASM_DISEASESTAGE'

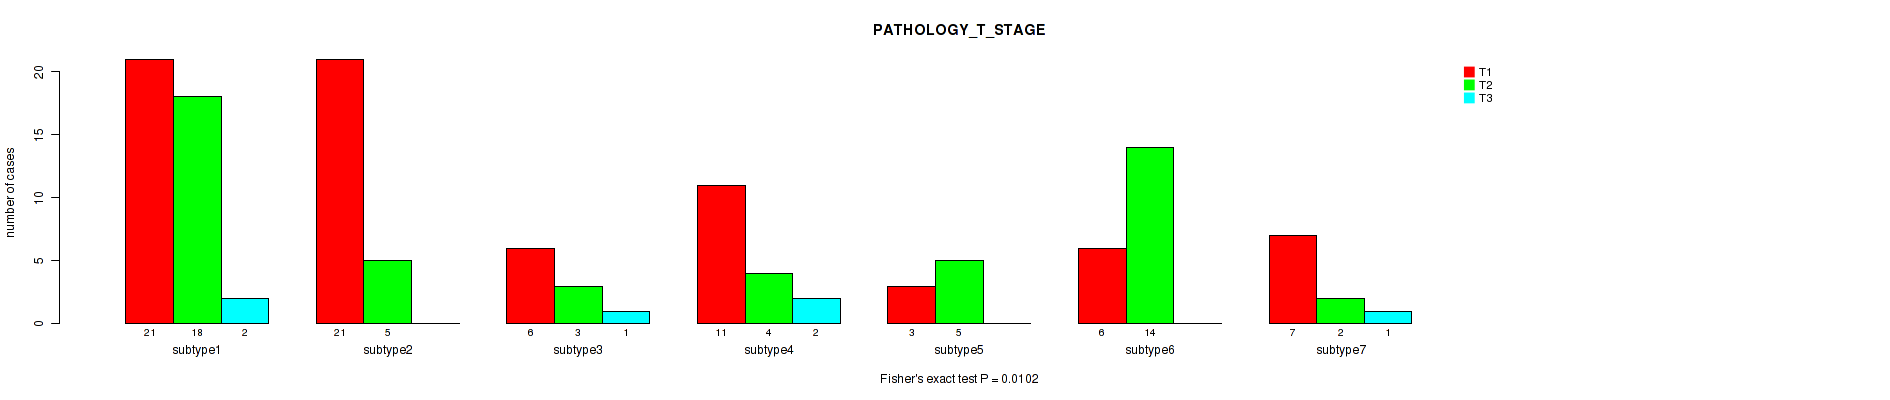
P value = 0.0102 (Fisher's exact test), Q value = 0.041
Table S50. Clustering Approach #6: 'RNAseq cHierClus subtypes' versus Clinical Feature #4: 'PATHOLOGY_T_STAGE'
| nPatients | T1 | T2 | T3 |
|---|---|---|---|
| ALL | 75 | 51 | 6 |
| subtype1 | 21 | 18 | 2 |
| subtype2 | 21 | 5 | 0 |
| subtype3 | 6 | 3 | 1 |
| subtype4 | 11 | 4 | 2 |
| subtype5 | 3 | 5 | 0 |
| subtype6 | 6 | 14 | 0 |
| subtype7 | 7 | 2 | 1 |
Figure S44. Get High-res Image Clustering Approach #6: 'RNAseq cHierClus subtypes' versus Clinical Feature #4: 'PATHOLOGY_T_STAGE'
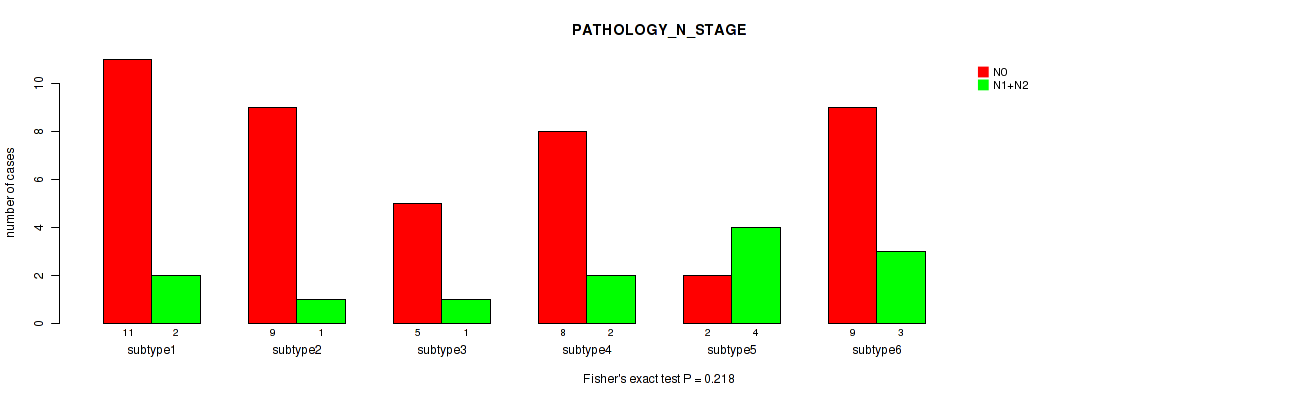
P value = 0.218 (Fisher's exact test), Q value = 0.4
Table S51. Clustering Approach #6: 'RNAseq cHierClus subtypes' versus Clinical Feature #5: 'PATHOLOGY_N_STAGE'
| nPatients | N0 | N1+N2 |
|---|---|---|
| ALL | 46 | 13 |
| subtype1 | 11 | 2 |
| subtype2 | 9 | 1 |
| subtype3 | 5 | 1 |
| subtype4 | 8 | 2 |
| subtype5 | 2 | 4 |
| subtype6 | 9 | 3 |
| subtype7 | 2 | 0 |
Figure S45. Get High-res Image Clustering Approach #6: 'RNAseq cHierClus subtypes' versus Clinical Feature #5: 'PATHOLOGY_N_STAGE'
P value = 0.0257 (Fisher's exact test), Q value = 0.069
Table S52. Clustering Approach #6: 'RNAseq cHierClus subtypes' versus Clinical Feature #6: 'PATHOLOGY_M_STAGE'
| nPatients | 0 | 1 |
|---|---|---|
| ALL | 114 | 4 |
| subtype1 | 37 | 0 |
| subtype2 | 23 | 0 |
| subtype3 | 8 | 1 |
| subtype4 | 15 | 1 |
| subtype5 | 7 | 1 |
| subtype6 | 19 | 0 |
| subtype7 | 5 | 1 |
Figure S46. Get High-res Image Clustering Approach #6: 'RNAseq cHierClus subtypes' versus Clinical Feature #6: 'PATHOLOGY_M_STAGE'

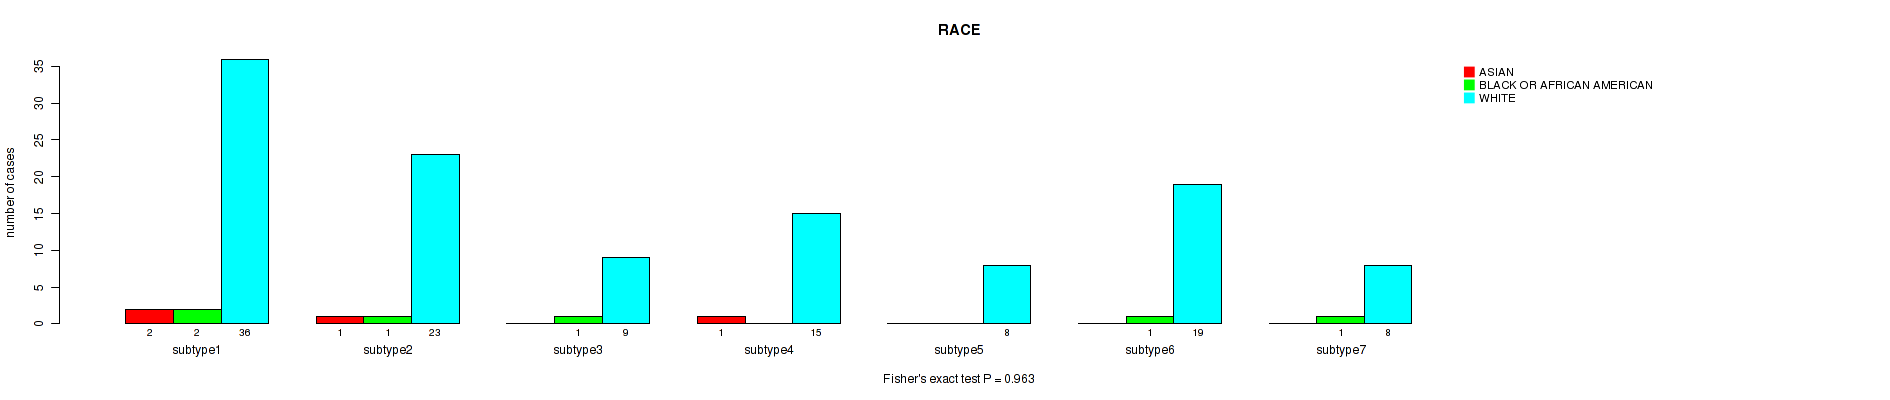
P value = 0.963 (Fisher's exact test), Q value = 0.98
Table S53. Clustering Approach #6: 'RNAseq cHierClus subtypes' versus Clinical Feature #7: 'RACE'
| nPatients | ASIAN | BLACK OR AFRICAN AMERICAN | WHITE |
|---|---|---|---|
| ALL | 4 | 6 | 118 |
| subtype1 | 2 | 2 | 36 |
| subtype2 | 1 | 1 | 23 |
| subtype3 | 0 | 1 | 9 |
| subtype4 | 1 | 0 | 15 |
| subtype5 | 0 | 0 | 8 |
| subtype6 | 0 | 1 | 19 |
| subtype7 | 0 | 1 | 8 |
Figure S47. Get High-res Image Clustering Approach #6: 'RNAseq cHierClus subtypes' versus Clinical Feature #7: 'RACE'
P value = 0.48 (Fisher's exact test), Q value = 0.65
Table S54. Clustering Approach #6: 'RNAseq cHierClus subtypes' versus Clinical Feature #8: 'ETHNICITY'
| nPatients | HISPANIC OR LATINO | NOT HISPANIC OR LATINO |
|---|---|---|
| ALL | 11 | 111 |
| subtype1 | 2 | 37 |
| subtype2 | 3 | 22 |
| subtype3 | 0 | 9 |
| subtype4 | 3 | 13 |
| subtype5 | 1 | 7 |
| subtype6 | 1 | 18 |
| subtype7 | 1 | 5 |
Figure S48. Get High-res Image Clustering Approach #6: 'RNAseq cHierClus subtypes' versus Clinical Feature #8: 'ETHNICITY'
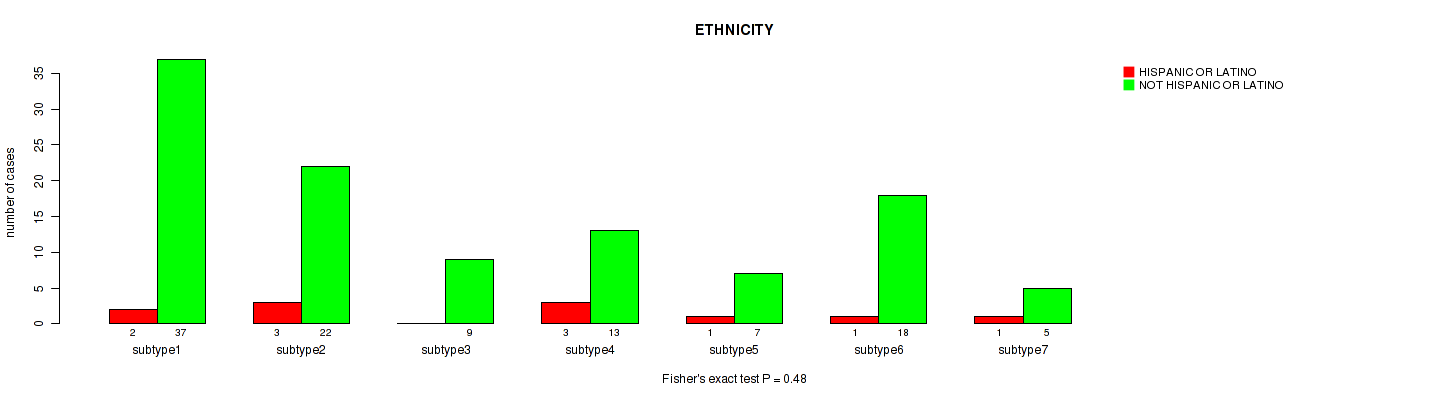
Table S55. Description of clustering approach #7: 'MIRSEQ CNMF'
| Cluster Labels | 1 | 2 | 3 |
|---|---|---|---|
| Number of samples | 51 | 53 | 29 |
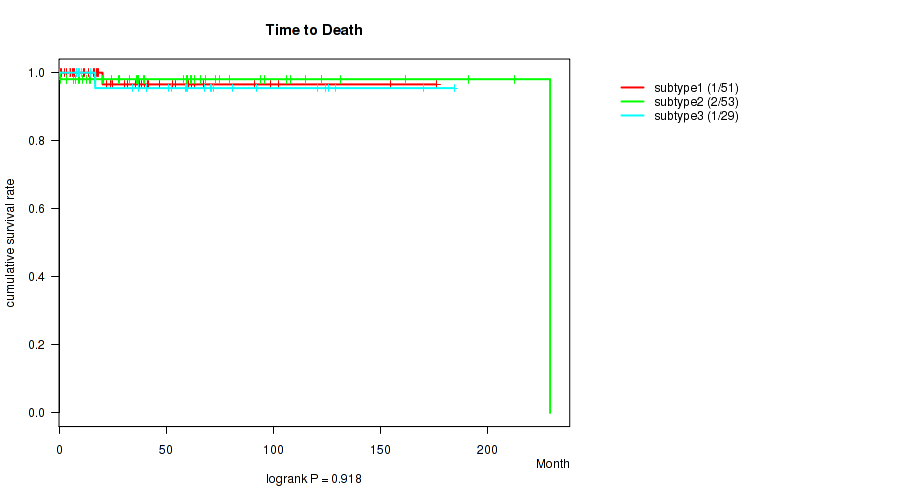
P value = 0.918 (logrank test), Q value = 0.94
Table S56. Clustering Approach #7: 'MIRSEQ CNMF' versus Clinical Feature #1: 'Time to Death'
| nPatients | nDeath | Duration Range (Median), Month | |
|---|---|---|---|
| ALL | 133 | 4 | 0.1 - 229.2 (37.7) |
| subtype1 | 51 | 1 | 0.1 - 176.2 (25.0) |
| subtype2 | 53 | 2 | 0.4 - 229.2 (39.4) |
| subtype3 | 29 | 1 | 4.9 - 184.4 (58.9) |
Figure S49. Get High-res Image Clustering Approach #7: 'MIRSEQ CNMF' versus Clinical Feature #1: 'Time to Death'
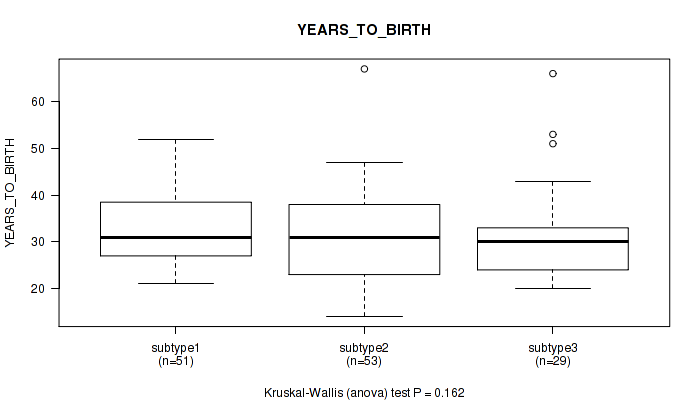
P value = 0.162 (Kruskal-Wallis (anova)), Q value = 0.34
Table S57. Clustering Approach #7: 'MIRSEQ CNMF' versus Clinical Feature #2: 'YEARS_TO_BIRTH'
| nPatients | Mean (Std.Dev) | |
|---|---|---|
| ALL | 133 | 32.0 (9.3) |
| subtype1 | 51 | 33.6 (8.3) |
| subtype2 | 53 | 30.6 (9.6) |
| subtype3 | 29 | 31.5 (10.4) |
Figure S50. Get High-res Image Clustering Approach #7: 'MIRSEQ CNMF' versus Clinical Feature #2: 'YEARS_TO_BIRTH'
P value = 0.0499 (Fisher's exact test), Q value = 0.12
Table S58. Clustering Approach #7: 'MIRSEQ CNMF' versus Clinical Feature #3: 'NEOPLASM_DISEASESTAGE'
| nPatients | STAGE I | STAGE IA | STAGE IB | STAGE II | STAGE IIA | STAGE IIB | STAGE IIC | STAGE III | STAGE IIIA | STAGE IIIB | STAGE IIIC | STAGE IS |
|---|---|---|---|---|---|---|---|---|---|---|---|---|
| ALL | 19 | 25 | 11 | 5 | 6 | 1 | 1 | 2 | 1 | 6 | 5 | 46 |
| subtype1 | 11 | 15 | 5 | 0 | 1 | 0 | 1 | 0 | 0 | 1 | 2 | 13 |
| subtype2 | 6 | 7 | 6 | 3 | 4 | 1 | 0 | 1 | 1 | 3 | 1 | 18 |
| subtype3 | 2 | 3 | 0 | 2 | 1 | 0 | 0 | 1 | 0 | 2 | 2 | 15 |
Figure S51. Get High-res Image Clustering Approach #7: 'MIRSEQ CNMF' versus Clinical Feature #3: 'NEOPLASM_DISEASESTAGE'

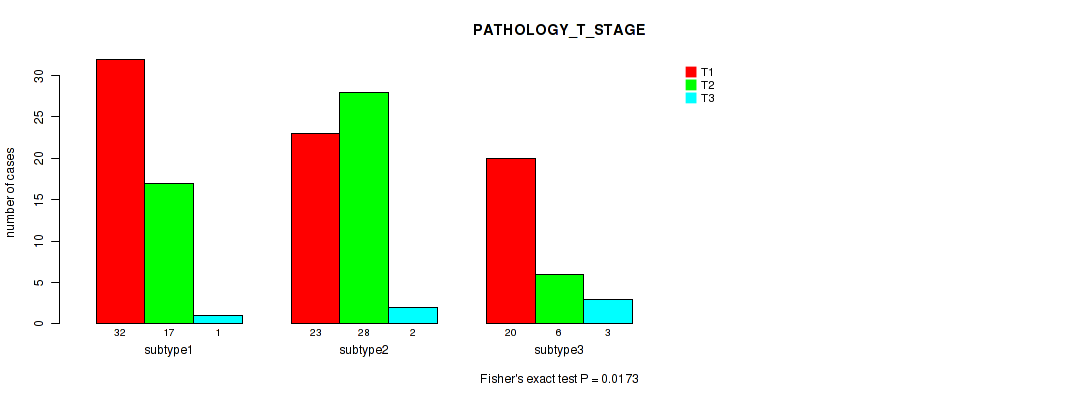
P value = 0.0173 (Fisher's exact test), Q value = 0.053
Table S59. Clustering Approach #7: 'MIRSEQ CNMF' versus Clinical Feature #4: 'PATHOLOGY_T_STAGE'
| nPatients | T1 | T2 | T3 |
|---|---|---|---|
| ALL | 75 | 51 | 6 |
| subtype1 | 32 | 17 | 1 |
| subtype2 | 23 | 28 | 2 |
| subtype3 | 20 | 6 | 3 |
Figure S52. Get High-res Image Clustering Approach #7: 'MIRSEQ CNMF' versus Clinical Feature #4: 'PATHOLOGY_T_STAGE'
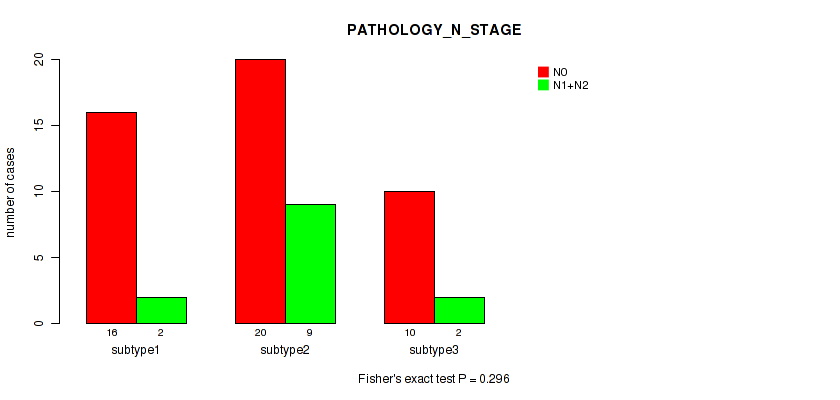
P value = 0.296 (Fisher's exact test), Q value = 0.49
Table S60. Clustering Approach #7: 'MIRSEQ CNMF' versus Clinical Feature #5: 'PATHOLOGY_N_STAGE'
| nPatients | N0 | N1+N2 |
|---|---|---|
| ALL | 46 | 13 |
| subtype1 | 16 | 2 |
| subtype2 | 20 | 9 |
| subtype3 | 10 | 2 |
Figure S53. Get High-res Image Clustering Approach #7: 'MIRSEQ CNMF' versus Clinical Feature #5: 'PATHOLOGY_N_STAGE'
P value = 0.026 (Fisher's exact test), Q value = 0.069
Table S61. Clustering Approach #7: 'MIRSEQ CNMF' versus Clinical Feature #6: 'PATHOLOGY_M_STAGE'
| nPatients | 0 | 1 |
|---|---|---|
| ALL | 114 | 4 |
| subtype1 | 44 | 0 |
| subtype2 | 49 | 1 |
| subtype3 | 21 | 3 |
Figure S54. Get High-res Image Clustering Approach #7: 'MIRSEQ CNMF' versus Clinical Feature #6: 'PATHOLOGY_M_STAGE'

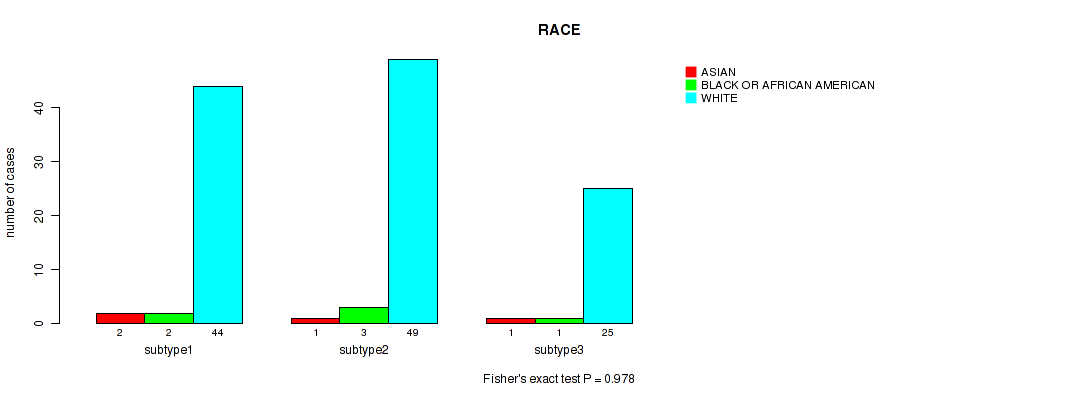
P value = 0.978 (Fisher's exact test), Q value = 0.98
Table S62. Clustering Approach #7: 'MIRSEQ CNMF' versus Clinical Feature #7: 'RACE'
| nPatients | ASIAN | BLACK OR AFRICAN AMERICAN | WHITE |
|---|---|---|---|
| ALL | 4 | 6 | 118 |
| subtype1 | 2 | 2 | 44 |
| subtype2 | 1 | 3 | 49 |
| subtype3 | 1 | 1 | 25 |
Figure S55. Get High-res Image Clustering Approach #7: 'MIRSEQ CNMF' versus Clinical Feature #7: 'RACE'
P value = 0.35 (Fisher's exact test), Q value = 0.53
Table S63. Clustering Approach #7: 'MIRSEQ CNMF' versus Clinical Feature #8: 'ETHNICITY'
| nPatients | HISPANIC OR LATINO | NOT HISPANIC OR LATINO |
|---|---|---|
| ALL | 11 | 111 |
| subtype1 | 4 | 43 |
| subtype2 | 3 | 48 |
| subtype3 | 4 | 20 |
Figure S56. Get High-res Image Clustering Approach #7: 'MIRSEQ CNMF' versus Clinical Feature #8: 'ETHNICITY'
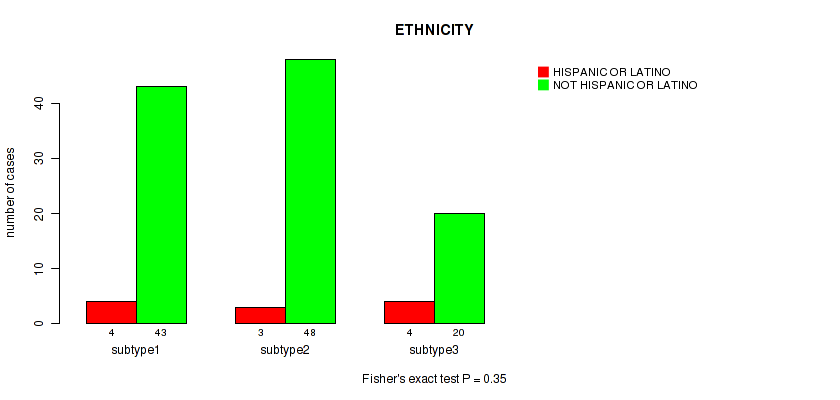
Table S64. Description of clustering approach #8: 'MIRSEQ CHIERARCHICAL'
| Cluster Labels | 1 | 2 | 3 |
|---|---|---|---|
| Number of samples | 68 | 36 | 29 |
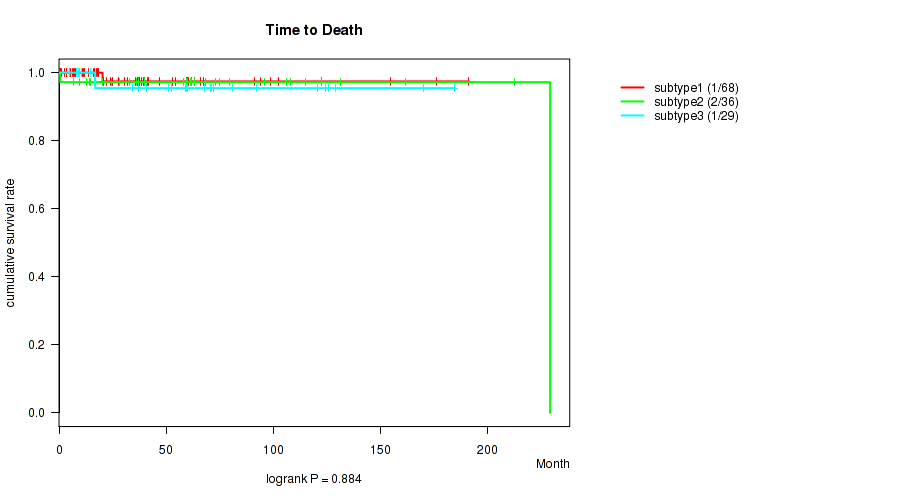
P value = 0.884 (logrank test), Q value = 0.92
Table S65. Clustering Approach #8: 'MIRSEQ CHIERARCHICAL' versus Clinical Feature #1: 'Time to Death'
| nPatients | nDeath | Duration Range (Median), Month | |
|---|---|---|---|
| ALL | 133 | 4 | 0.1 - 229.2 (37.7) |
| subtype1 | 68 | 1 | 0.1 - 191.3 (26.3) |
| subtype2 | 36 | 2 | 0.6 - 229.2 (59.7) |
| subtype3 | 29 | 1 | 4.9 - 184.4 (58.9) |
Figure S57. Get High-res Image Clustering Approach #8: 'MIRSEQ CHIERARCHICAL' versus Clinical Feature #1: 'Time to Death'
P value = 0.00597 (Kruskal-Wallis (anova)), Q value = 0.03
Table S66. Clustering Approach #8: 'MIRSEQ CHIERARCHICAL' versus Clinical Feature #2: 'YEARS_TO_BIRTH'
| nPatients | Mean (Std.Dev) | |
|---|---|---|
| ALL | 133 | 32.0 (9.3) |
| subtype1 | 68 | 33.8 (8.1) |
| subtype2 | 36 | 28.8 (9.9) |
| subtype3 | 29 | 31.5 (10.4) |
Figure S58. Get High-res Image Clustering Approach #8: 'MIRSEQ CHIERARCHICAL' versus Clinical Feature #2: 'YEARS_TO_BIRTH'

P value = 0.00075 (Fisher's exact test), Q value = 0.01
Table S67. Clustering Approach #8: 'MIRSEQ CHIERARCHICAL' versus Clinical Feature #3: 'NEOPLASM_DISEASESTAGE'
| nPatients | STAGE I | STAGE IA | STAGE IB | STAGE II | STAGE IIA | STAGE IIB | STAGE IIC | STAGE III | STAGE IIIA | STAGE IIIB | STAGE IIIC | STAGE IS |
|---|---|---|---|---|---|---|---|---|---|---|---|---|
| ALL | 19 | 25 | 11 | 5 | 6 | 1 | 1 | 2 | 1 | 6 | 5 | 46 |
| subtype1 | 15 | 19 | 7 | 0 | 1 | 1 | 1 | 0 | 0 | 1 | 2 | 18 |
| subtype2 | 2 | 3 | 4 | 3 | 4 | 0 | 0 | 1 | 1 | 3 | 1 | 13 |
| subtype3 | 2 | 3 | 0 | 2 | 1 | 0 | 0 | 1 | 0 | 2 | 2 | 15 |
Figure S59. Get High-res Image Clustering Approach #8: 'MIRSEQ CHIERARCHICAL' versus Clinical Feature #3: 'NEOPLASM_DISEASESTAGE'

P value = 0.00505 (Fisher's exact test), Q value = 0.029
Table S68. Clustering Approach #8: 'MIRSEQ CHIERARCHICAL' versus Clinical Feature #4: 'PATHOLOGY_T_STAGE'
| nPatients | T1 | T2 | T3 |
|---|---|---|---|
| ALL | 75 | 51 | 6 |
| subtype1 | 42 | 23 | 2 |
| subtype2 | 13 | 22 | 1 |
| subtype3 | 20 | 6 | 3 |
Figure S60. Get High-res Image Clustering Approach #8: 'MIRSEQ CHIERARCHICAL' versus Clinical Feature #4: 'PATHOLOGY_T_STAGE'

P value = 0.253 (Fisher's exact test), Q value = 0.44
Table S69. Clustering Approach #8: 'MIRSEQ CHIERARCHICAL' versus Clinical Feature #5: 'PATHOLOGY_N_STAGE'
| nPatients | N0 | N1+N2 |
|---|---|---|
| ALL | 46 | 13 |
| subtype1 | 20 | 3 |
| subtype2 | 16 | 8 |
| subtype3 | 10 | 2 |
Figure S61. Get High-res Image Clustering Approach #8: 'MIRSEQ CHIERARCHICAL' versus Clinical Feature #5: 'PATHOLOGY_N_STAGE'

P value = 0.0163 (Fisher's exact test), Q value = 0.053
Table S70. Clustering Approach #8: 'MIRSEQ CHIERARCHICAL' versus Clinical Feature #6: 'PATHOLOGY_M_STAGE'
| nPatients | 0 | 1 |
|---|---|---|
| ALL | 114 | 4 |
| subtype1 | 60 | 0 |
| subtype2 | 33 | 1 |
| subtype3 | 21 | 3 |
Figure S62. Get High-res Image Clustering Approach #8: 'MIRSEQ CHIERARCHICAL' versus Clinical Feature #6: 'PATHOLOGY_M_STAGE'

P value = 0.863 (Fisher's exact test), Q value = 0.92
Table S71. Clustering Approach #8: 'MIRSEQ CHIERARCHICAL' versus Clinical Feature #7: 'RACE'
| nPatients | ASIAN | BLACK OR AFRICAN AMERICAN | WHITE |
|---|---|---|---|
| ALL | 4 | 6 | 118 |
| subtype1 | 3 | 3 | 59 |
| subtype2 | 0 | 2 | 34 |
| subtype3 | 1 | 1 | 25 |
Figure S63. Get High-res Image Clustering Approach #8: 'MIRSEQ CHIERARCHICAL' versus Clinical Feature #7: 'RACE'

P value = 0.366 (Fisher's exact test), Q value = 0.53
Table S72. Clustering Approach #8: 'MIRSEQ CHIERARCHICAL' versus Clinical Feature #8: 'ETHNICITY'
| nPatients | HISPANIC OR LATINO | NOT HISPANIC OR LATINO |
|---|---|---|
| ALL | 11 | 111 |
| subtype1 | 5 | 59 |
| subtype2 | 2 | 32 |
| subtype3 | 4 | 20 |
Figure S64. Get High-res Image Clustering Approach #8: 'MIRSEQ CHIERARCHICAL' versus Clinical Feature #8: 'ETHNICITY'

Table S73. Description of clustering approach #9: 'MIRseq Mature CNMF subtypes'
| Cluster Labels | 1 | 2 | 3 |
|---|---|---|---|
| Number of samples | 67 | 34 | 32 |
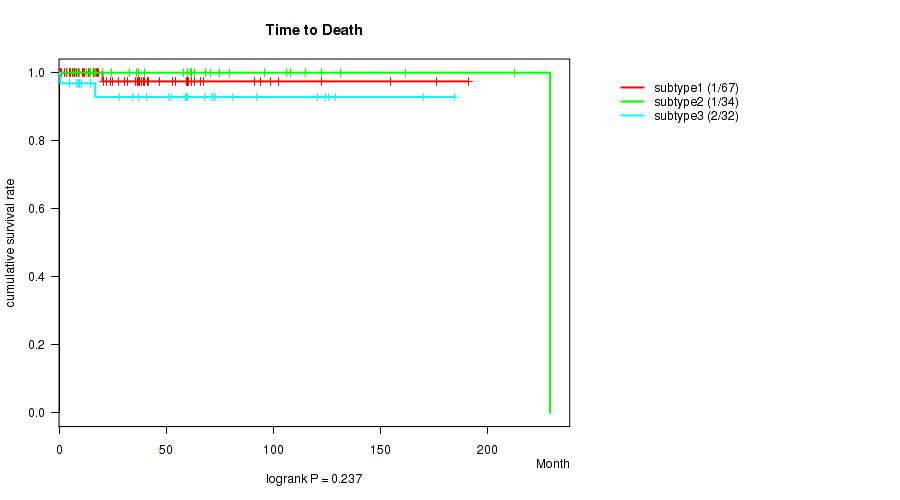
P value = 0.237 (logrank test), Q value = 0.42
Table S74. Clustering Approach #9: 'MIRseq Mature CNMF subtypes' versus Clinical Feature #1: 'Time to Death'
| nPatients | nDeath | Duration Range (Median), Month | |
|---|---|---|---|
| ALL | 133 | 4 | 0.1 - 229.2 (37.7) |
| subtype1 | 67 | 1 | 0.1 - 191.3 (27.6) |
| subtype2 | 34 | 1 | 6.9 - 229.2 (60.8) |
| subtype3 | 32 | 2 | 0.6 - 184.4 (55.6) |
Figure S65. Get High-res Image Clustering Approach #9: 'MIRseq Mature CNMF subtypes' versus Clinical Feature #1: 'Time to Death'
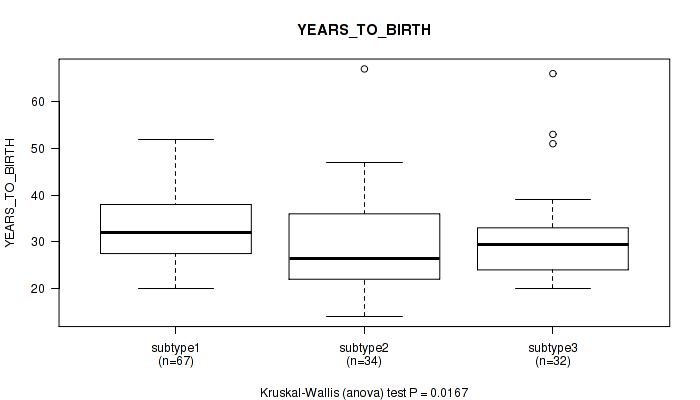
P value = 0.0167 (Kruskal-Wallis (anova)), Q value = 0.053
Table S75. Clustering Approach #9: 'MIRseq Mature CNMF subtypes' versus Clinical Feature #2: 'YEARS_TO_BIRTH'
| nPatients | Mean (Std.Dev) | |
|---|---|---|
| ALL | 133 | 32.0 (9.3) |
| subtype1 | 67 | 33.6 (8.0) |
| subtype2 | 34 | 29.6 (10.7) |
| subtype3 | 32 | 31.0 (9.9) |
Figure S66. Get High-res Image Clustering Approach #9: 'MIRseq Mature CNMF subtypes' versus Clinical Feature #2: 'YEARS_TO_BIRTH'
P value = 0.00026 (Fisher's exact test), Q value = 0.0069
Table S76. Clustering Approach #9: 'MIRseq Mature CNMF subtypes' versus Clinical Feature #3: 'NEOPLASM_DISEASESTAGE'
| nPatients | STAGE I | STAGE IA | STAGE IB | STAGE II | STAGE IIA | STAGE IIB | STAGE IIC | STAGE III | STAGE IIIA | STAGE IIIB | STAGE IIIC | STAGE IS |
|---|---|---|---|---|---|---|---|---|---|---|---|---|
| ALL | 19 | 25 | 11 | 5 | 6 | 1 | 1 | 2 | 1 | 6 | 5 | 46 |
| subtype1 | 15 | 18 | 7 | 0 | 1 | 1 | 1 | 0 | 0 | 1 | 2 | 18 |
| subtype2 | 2 | 4 | 4 | 3 | 4 | 0 | 0 | 1 | 1 | 3 | 0 | 11 |
| subtype3 | 2 | 3 | 0 | 2 | 1 | 0 | 0 | 1 | 0 | 2 | 3 | 17 |
Figure S67. Get High-res Image Clustering Approach #9: 'MIRseq Mature CNMF subtypes' versus Clinical Feature #3: 'NEOPLASM_DISEASESTAGE'

P value = 0.00043 (Fisher's exact test), Q value = 0.0086
Table S77. Clustering Approach #9: 'MIRseq Mature CNMF subtypes' versus Clinical Feature #4: 'PATHOLOGY_T_STAGE'
| nPatients | T1 | T2 | T3 |
|---|---|---|---|
| ALL | 75 | 51 | 6 |
| subtype1 | 41 | 23 | 2 |
| subtype2 | 12 | 22 | 0 |
| subtype3 | 22 | 6 | 4 |
Figure S68. Get High-res Image Clustering Approach #9: 'MIRseq Mature CNMF subtypes' versus Clinical Feature #4: 'PATHOLOGY_T_STAGE'
P value = 0.293 (Fisher's exact test), Q value = 0.49
Table S78. Clustering Approach #9: 'MIRseq Mature CNMF subtypes' versus Clinical Feature #5: 'PATHOLOGY_N_STAGE'
| nPatients | N0 | N1+N2 |
|---|---|---|
| ALL | 46 | 13 |
| subtype1 | 20 | 3 |
| subtype2 | 14 | 7 |
| subtype3 | 12 | 3 |
Figure S69. Get High-res Image Clustering Approach #9: 'MIRseq Mature CNMF subtypes' versus Clinical Feature #5: 'PATHOLOGY_N_STAGE'

P value = 0.0782 (Fisher's exact test), Q value = 0.18
Table S79. Clustering Approach #9: 'MIRseq Mature CNMF subtypes' versus Clinical Feature #6: 'PATHOLOGY_M_STAGE'
| nPatients | 0 | 1 |
|---|---|---|
| ALL | 114 | 4 |
| subtype1 | 59 | 0 |
| subtype2 | 31 | 2 |
| subtype3 | 24 | 2 |
Figure S70. Get High-res Image Clustering Approach #9: 'MIRseq Mature CNMF subtypes' versus Clinical Feature #6: 'PATHOLOGY_M_STAGE'
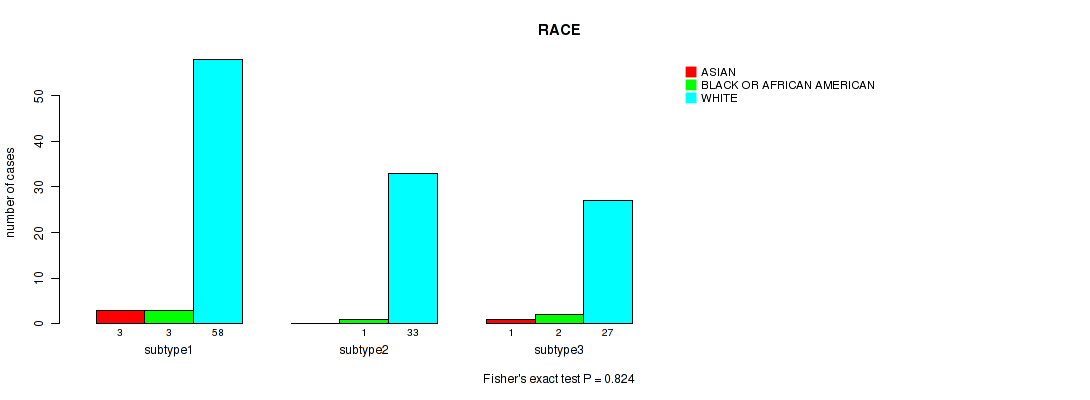
P value = 0.824 (Fisher's exact test), Q value = 0.92
Table S80. Clustering Approach #9: 'MIRseq Mature CNMF subtypes' versus Clinical Feature #7: 'RACE'
| nPatients | ASIAN | BLACK OR AFRICAN AMERICAN | WHITE |
|---|---|---|---|
| ALL | 4 | 6 | 118 |
| subtype1 | 3 | 3 | 58 |
| subtype2 | 0 | 1 | 33 |
| subtype3 | 1 | 2 | 27 |
Figure S71. Get High-res Image Clustering Approach #9: 'MIRseq Mature CNMF subtypes' versus Clinical Feature #7: 'RACE'
P value = 0.489 (Fisher's exact test), Q value = 0.65
Table S81. Clustering Approach #9: 'MIRseq Mature CNMF subtypes' versus Clinical Feature #8: 'ETHNICITY'
| nPatients | HISPANIC OR LATINO | NOT HISPANIC OR LATINO |
|---|---|---|
| ALL | 11 | 111 |
| subtype1 | 5 | 58 |
| subtype2 | 2 | 31 |
| subtype3 | 4 | 22 |
Figure S72. Get High-res Image Clustering Approach #9: 'MIRseq Mature CNMF subtypes' versus Clinical Feature #8: 'ETHNICITY'
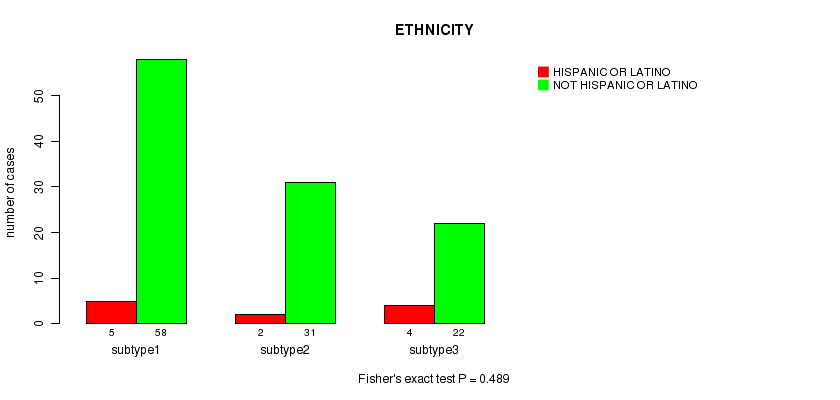
Table S82. Description of clustering approach #10: 'MIRseq Mature cHierClus subtypes'
| Cluster Labels | 1 | 2 | 3 | 4 |
|---|---|---|---|---|
| Number of samples | 36 | 32 | 36 | 29 |
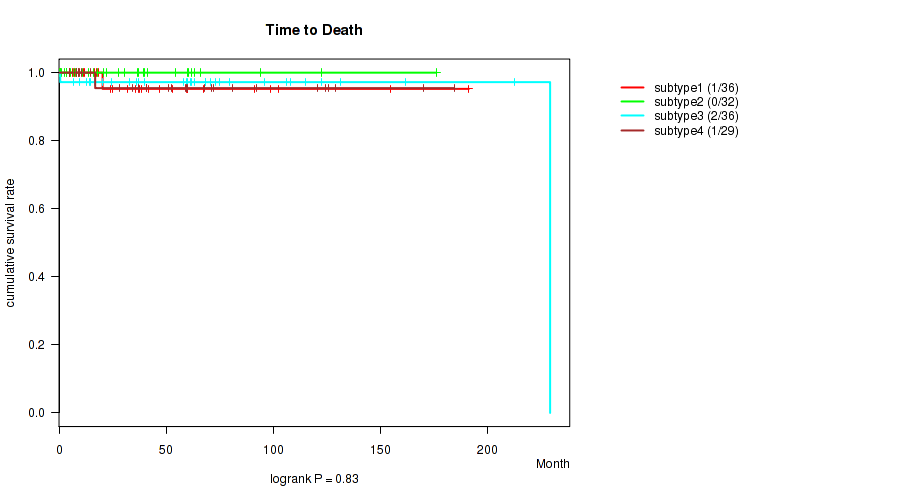
P value = 0.83 (logrank test), Q value = 0.92
Table S83. Clustering Approach #10: 'MIRseq Mature cHierClus subtypes' versus Clinical Feature #1: 'Time to Death'
| nPatients | nDeath | Duration Range (Median), Month | |
|---|---|---|---|
| ALL | 133 | 4 | 0.1 - 229.2 (37.7) |
| subtype1 | 36 | 1 | 0.1 - 191.3 (28.5) |
| subtype2 | 32 | 0 | 0.4 - 176.2 (24.8) |
| subtype3 | 36 | 2 | 0.6 - 229.2 (60.8) |
| subtype4 | 29 | 1 | 4.9 - 184.4 (52.4) |
Figure S73. Get High-res Image Clustering Approach #10: 'MIRseq Mature cHierClus subtypes' versus Clinical Feature #1: 'Time to Death'
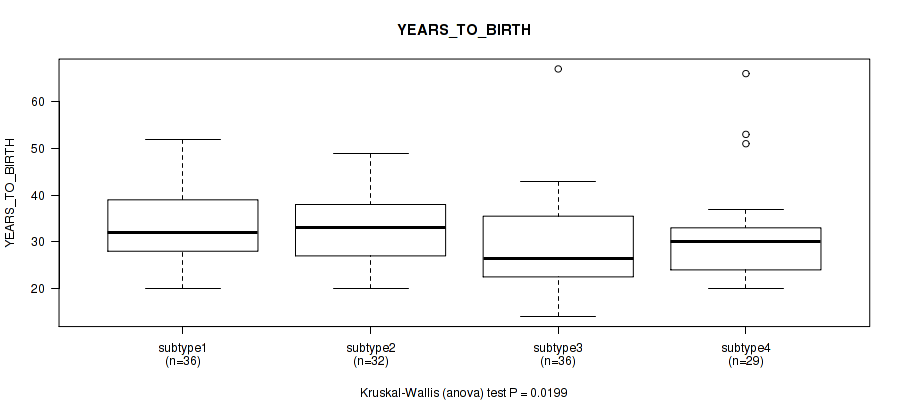
P value = 0.0199 (Kruskal-Wallis (anova)), Q value = 0.057
Table S84. Clustering Approach #10: 'MIRseq Mature cHierClus subtypes' versus Clinical Feature #2: 'YEARS_TO_BIRTH'
| nPatients | Mean (Std.Dev) | |
|---|---|---|
| ALL | 133 | 32.0 (9.3) |
| subtype1 | 36 | 33.9 (8.4) |
| subtype2 | 32 | 33.7 (8.0) |
| subtype3 | 36 | 29.1 (10.2) |
| subtype4 | 29 | 31.1 (10.2) |
Figure S74. Get High-res Image Clustering Approach #10: 'MIRseq Mature cHierClus subtypes' versus Clinical Feature #2: 'YEARS_TO_BIRTH'
P value = 0.00221 (Fisher's exact test), Q value = 0.02
Table S85. Clustering Approach #10: 'MIRseq Mature cHierClus subtypes' versus Clinical Feature #3: 'NEOPLASM_DISEASESTAGE'
| nPatients | STAGE I | STAGE IA | STAGE IB | STAGE II | STAGE IIA | STAGE IIB | STAGE IIC | STAGE III | STAGE IIIA | STAGE IIIB | STAGE IIIC | STAGE IS |
|---|---|---|---|---|---|---|---|---|---|---|---|---|
| ALL | 19 | 25 | 11 | 5 | 6 | 1 | 1 | 2 | 1 | 6 | 5 | 46 |
| subtype1 | 9 | 13 | 3 | 0 | 1 | 0 | 1 | 0 | 0 | 0 | 0 | 9 |
| subtype2 | 6 | 6 | 4 | 0 | 0 | 1 | 0 | 0 | 0 | 1 | 2 | 9 |
| subtype3 | 2 | 3 | 4 | 3 | 4 | 0 | 0 | 1 | 1 | 4 | 1 | 12 |
| subtype4 | 2 | 3 | 0 | 2 | 1 | 0 | 0 | 1 | 0 | 1 | 2 | 16 |
Figure S75. Get High-res Image Clustering Approach #10: 'MIRseq Mature cHierClus subtypes' versus Clinical Feature #3: 'NEOPLASM_DISEASESTAGE'

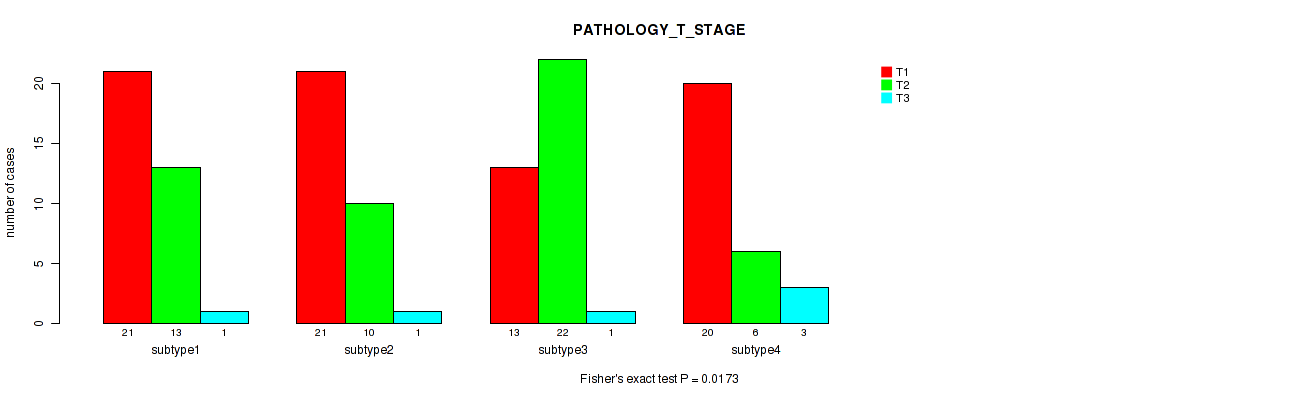
P value = 0.0173 (Fisher's exact test), Q value = 0.053
Table S86. Clustering Approach #10: 'MIRseq Mature cHierClus subtypes' versus Clinical Feature #4: 'PATHOLOGY_T_STAGE'
| nPatients | T1 | T2 | T3 |
|---|---|---|---|
| ALL | 75 | 51 | 6 |
| subtype1 | 21 | 13 | 1 |
| subtype2 | 21 | 10 | 1 |
| subtype3 | 13 | 22 | 1 |
| subtype4 | 20 | 6 | 3 |
Figure S76. Get High-res Image Clustering Approach #10: 'MIRseq Mature cHierClus subtypes' versus Clinical Feature #4: 'PATHOLOGY_T_STAGE'
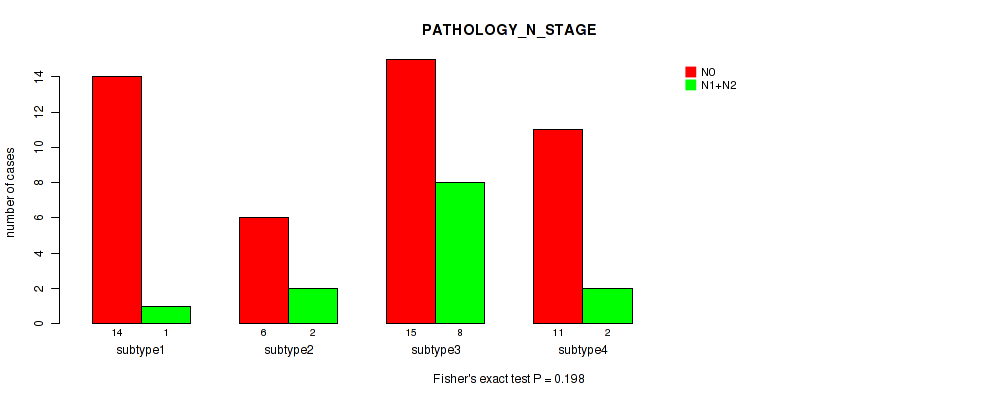
P value = 0.198 (Fisher's exact test), Q value = 0.38
Table S87. Clustering Approach #10: 'MIRseq Mature cHierClus subtypes' versus Clinical Feature #5: 'PATHOLOGY_N_STAGE'
| nPatients | N0 | N1+N2 |
|---|---|---|
| ALL | 46 | 13 |
| subtype1 | 14 | 1 |
| subtype2 | 6 | 2 |
| subtype3 | 15 | 8 |
| subtype4 | 11 | 2 |
Figure S77. Get High-res Image Clustering Approach #10: 'MIRseq Mature cHierClus subtypes' versus Clinical Feature #5: 'PATHOLOGY_N_STAGE'
P value = 0.182 (Fisher's exact test), Q value = 0.36
Table S88. Clustering Approach #10: 'MIRseq Mature cHierClus subtypes' versus Clinical Feature #6: 'PATHOLOGY_M_STAGE'
| nPatients | 0 | 1 |
|---|---|---|
| ALL | 114 | 4 |
| subtype1 | 33 | 0 |
| subtype2 | 27 | 0 |
| subtype3 | 32 | 2 |
| subtype4 | 22 | 2 |
Figure S78. Get High-res Image Clustering Approach #10: 'MIRseq Mature cHierClus subtypes' versus Clinical Feature #6: 'PATHOLOGY_M_STAGE'
P value = 0.877 (Fisher's exact test), Q value = 0.92
Table S89. Clustering Approach #10: 'MIRseq Mature cHierClus subtypes' versus Clinical Feature #7: 'RACE'
| nPatients | ASIAN | BLACK OR AFRICAN AMERICAN | WHITE |
|---|---|---|---|
| ALL | 4 | 6 | 118 |
| subtype1 | 2 | 1 | 32 |
| subtype2 | 1 | 2 | 27 |
| subtype3 | 0 | 2 | 34 |
| subtype4 | 1 | 1 | 25 |
Figure S79. Get High-res Image Clustering Approach #10: 'MIRseq Mature cHierClus subtypes' versus Clinical Feature #7: 'RACE'

P value = 0.48 (Fisher's exact test), Q value = 0.65
Table S90. Clustering Approach #10: 'MIRseq Mature cHierClus subtypes' versus Clinical Feature #8: 'ETHNICITY'
| nPatients | HISPANIC OR LATINO | NOT HISPANIC OR LATINO |
|---|---|---|
| ALL | 11 | 111 |
| subtype1 | 2 | 33 |
| subtype2 | 3 | 26 |
| subtype3 | 2 | 32 |
| subtype4 | 4 | 20 |
Figure S80. Get High-res Image Clustering Approach #10: 'MIRseq Mature cHierClus subtypes' versus Clinical Feature #8: 'ETHNICITY'
-
Cluster data file = /xchip/cga/gdac-prod/tcga-gdac/jobResults/GDAC_mergedClustering/TGCT-TP/15111345/TGCT-TP.mergedcluster.txt
-
Clinical data file = /xchip/cga/gdac-prod/tcga-gdac/jobResults/Append_Data/TGCT-TP/15092576/TGCT-TP.merged_data.txt
-
Number of patients = 133
-
Number of clustering approaches = 10
-
Number of selected clinical features = 8
-
Exclude small clusters that include fewer than K patients, K = 3
consensus non-negative matrix factorization clustering approach (Brunet et al. 2004)
Resampling-based clustering method (Monti et al. 2003)
For survival clinical features, the Kaplan-Meier survival curves of tumors with and without gene mutations were plotted and the statistical significance P values were estimated by logrank test (Bland and Altman 2004) using the 'survdiff' function in R
For binary clinical features, two-tailed Fisher's exact tests (Fisher 1922) were used to estimate the P values using the 'fisher.test' function in R
For multiple hypothesis correction, Q value is the False Discovery Rate (FDR) analogue of the P value (Benjamini and Hochberg 1995), defined as the minimum FDR at which the test may be called significant. We used the 'Benjamini and Hochberg' method of 'p.adjust' function in R to convert P values into Q values.
In addition to the links below, the full results of the analysis summarized in this report can also be downloaded programmatically using firehose_get, or interactively from either the Broad GDAC website or TCGA Data Coordination Center Portal.