This pipeline computes the correlation between significantly recurrent gene mutations and selected clinical features.
Testing the association between mutation status of 59 genes and 8 clinical features across 130 patients, 3 significant findings detected with Q value < 0.25.
-
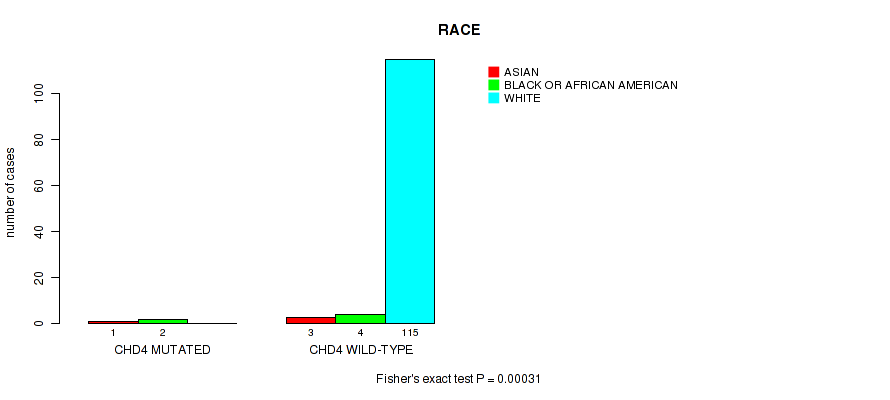
CHD4 mutation correlated to 'Time to Death' and 'RACE'.
-
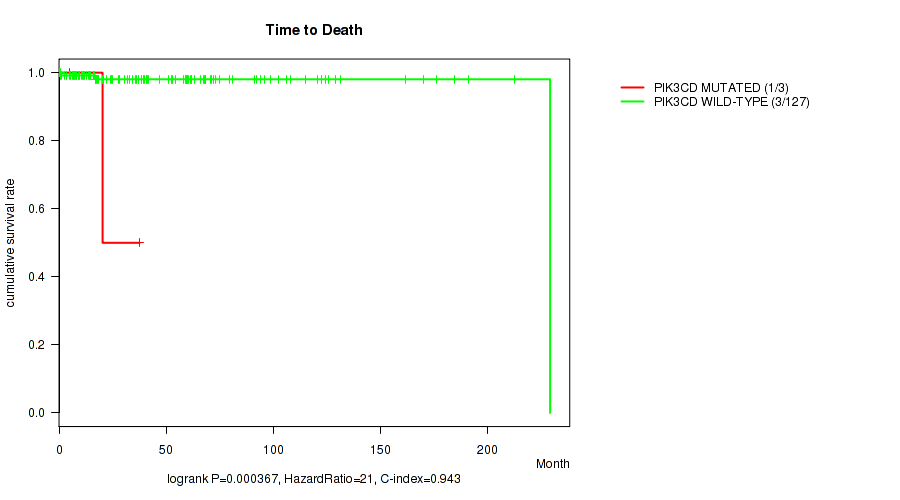
PIK3CD mutation correlated to 'Time to Death'.
Table 1. Get Full Table Overview of the association between mutation status of 59 genes and 8 clinical features. Shown in the table are P values (Q values). Thresholded by Q value < 0.25, 3 significant findings detected.
|
Clinical Features |
Time to Death |
YEARS TO BIRTH |
NEOPLASM DISEASESTAGE |
PATHOLOGY T STAGE |
PATHOLOGY N STAGE |
PATHOLOGY M STAGE |
RACE | ETHNICITY | ||
| nMutated (%) | nWild-Type | logrank test | Wilcoxon-test | Fisher's exact test | Fisher's exact test | Fisher's exact test | Fisher's exact test | Fisher's exact test | Fisher's exact test | |
| CHD4 | 3 (2%) | 127 |
9.29e-07 (0.000438) |
0.452 (1.00) |
0.289 (1.00) |
0.0709 (1.00) |
1 (1.00) |
0.00031 (0.0577) |
1 (1.00) |
|
| PIK3CD | 3 (2%) | 127 |
0.000367 (0.0577) |
0.471 (1.00) |
0.61 (1.00) |
0.368 (1.00) |
1 (1.00) |
1 (1.00) |
1 (1.00) |
|
| KIT | 25 (19%) | 105 |
0.434 (1.00) |
0.107 (1.00) |
0.133 (1.00) |
0.603 (1.00) |
0.667 (1.00) |
1 (1.00) |
0.217 (1.00) |
0.687 (1.00) |
| KRAS | 19 (15%) | 111 |
0.388 (1.00) |
0.288 (1.00) |
0.588 (1.00) |
0.682 (1.00) |
1 (1.00) |
1 (1.00) |
0.781 (1.00) |
1 (1.00) |
| ANKLE1 | 11 (8%) | 119 |
0.585 (1.00) |
0.688 (1.00) |
0.943 (1.00) |
0.444 (1.00) |
0.325 (1.00) |
1 (1.00) |
0.34 (1.00) |
1 (1.00) |
| FAM104B | 6 (5%) | 124 |
0.755 (1.00) |
0.665 (1.00) |
0.228 (1.00) |
1 (1.00) |
1 (1.00) |
1 (1.00) |
0.387 (1.00) |
|
| DDX11 | 6 (5%) | 124 |
0.727 (1.00) |
0.0561 (1.00) |
0.25 (1.00) |
0.551 (1.00) |
1 (1.00) |
0.398 (1.00) |
1 (1.00) |
|
| NRAS | 6 (5%) | 124 |
0.755 (1.00) |
0.248 (1.00) |
0.34 (1.00) |
0.551 (1.00) |
1 (1.00) |
0.166 (1.00) |
1 (1.00) |
|
| PNPLA4 | 5 (4%) | 125 |
0.711 (1.00) |
0.557 (1.00) |
0.296 (1.00) |
0.199 (1.00) |
1 (1.00) |
1 (1.00) |
0.323 (1.00) |
|
| SERINC2 | 3 (2%) | 127 |
0.757 (1.00) |
0.744 (1.00) |
0.861 (1.00) |
1 (1.00) |
1 (1.00) |
1 (1.00) |
1 (1.00) |
1 (1.00) |
| RBM10 | 4 (3%) | 126 |
0.719 (1.00) |
0.919 (1.00) |
0.763 (1.00) |
0.708 (1.00) |
1 (1.00) |
1 (1.00) |
1 (1.00) |
1 (1.00) |
| DEK | 5 (4%) | 125 |
0.686 (1.00) |
0.505 (1.00) |
0.713 (1.00) |
0.722 (1.00) |
1 (1.00) |
1 (1.00) |
1 (1.00) |
0.387 (1.00) |
| ERC1 | 6 (5%) | 124 |
0.711 (1.00) |
0.36 (1.00) |
0.327 (1.00) |
0.175 (1.00) |
0.515 (1.00) |
1 (1.00) |
1 (1.00) |
1 (1.00) |
| HSF4 | 6 (5%) | 124 |
0.678 (1.00) |
0.863 (1.00) |
0.4 (1.00) |
0.422 (1.00) |
1 (1.00) |
1 (1.00) |
1 (1.00) |
|
| MUC6 | 13 (10%) | 117 |
0.549 (1.00) |
0.689 (1.00) |
0.744 (1.00) |
0.479 (1.00) |
0.596 (1.00) |
1 (1.00) |
0.403 (1.00) |
1 (1.00) |
| FANK1 | 4 (3%) | 126 |
0.777 (1.00) |
0.676 (1.00) |
0.226 (1.00) |
0.125 (1.00) |
1 (1.00) |
1 (1.00) |
0.323 (1.00) |
|
| MLLT3 | 3 (2%) | 127 |
0.773 (1.00) |
0.0769 (1.00) |
0.403 (1.00) |
1 (1.00) |
1 (1.00) |
1 (1.00) |
0.252 (1.00) |
|
| RHPN2 | 6 (5%) | 124 |
0.0506 (1.00) |
0.769 (1.00) |
0.349 (1.00) |
0.233 (1.00) |
1 (1.00) |
0.164 (1.00) |
1 (1.00) |
1 (1.00) |
| SP8 | 4 (3%) | 126 |
0.777 (1.00) |
0.426 (1.00) |
0.414 (1.00) |
1 (1.00) |
1 (1.00) |
1 (1.00) |
0.323 (1.00) |
|
| KRTAP1-1 | 3 (2%) | 127 |
0.827 (1.00) |
0.0304 (1.00) |
0.19 (1.00) |
1 (1.00) |
0.101 (1.00) |
1 (1.00) |
||
| ANKRD11 | 5 (4%) | 125 |
0.686 (1.00) |
0.342 (1.00) |
0.812 (1.00) |
1 (1.00) |
1 (1.00) |
0.0524 (1.00) |
1 (1.00) |
|
| SPIN2A | 3 (2%) | 127 |
0.827 (1.00) |
0.16 (1.00) |
0.796 (1.00) |
0.623 (1.00) |
1 (1.00) |
1 (1.00) |
0.0219 (1.00) |
|
| ATXN3 | 3 (2%) | 127 |
0.789 (1.00) |
0.816 (1.00) |
0.173 (1.00) |
1 (1.00) |
0.101 (1.00) |
1 (1.00) |
0.252 (1.00) |
|
| SSBP3 | 3 (2%) | 127 |
0.789 (1.00) |
0.642 (1.00) |
0.547 (1.00) |
1 (1.00) |
1 (1.00) |
1 (1.00) |
1 (1.00) |
|
| KRTAP10-10 | 4 (3%) | 126 |
0.747 (1.00) |
0.803 (1.00) |
0.953 (1.00) |
0.297 (1.00) |
1 (1.00) |
1 (1.00) |
0.323 (1.00) |
|
| BCL11B | 5 (4%) | 125 |
0.686 (1.00) |
0.0176 (1.00) |
0.515 (1.00) |
1 (1.00) |
1 (1.00) |
0.17 (1.00) |
1 (1.00) |
|
| FAM101B | 4 (3%) | 126 |
0.808 (1.00) |
0.691 (1.00) |
0.761 (1.00) |
0.708 (1.00) |
1 (1.00) |
0.032 (1.00) |
0.323 (1.00) |
|
| PSMD11 | 4 (3%) | 126 |
0.827 (1.00) |
0.214 (1.00) |
0.831 (1.00) |
0.708 (1.00) |
1 (1.00) |
1 (1.00) |
1 (1.00) |
|
| FAM8A1 | 3 (2%) | 127 |
0.808 (1.00) |
0.846 (1.00) |
0.713 (1.00) |
1 (1.00) |
1 (1.00) |
1 (1.00) |
||
| SPTAN1 | 3 (2%) | 127 |
0.789 (1.00) |
0.1 (1.00) |
0.464 (1.00) |
1 (1.00) |
1 (1.00) |
1 (1.00) |
0.252 (1.00) |
|
| CRB2 | 6 (5%) | 124 |
0.702 (1.00) |
0.351 (1.00) |
0.526 (1.00) |
0.551 (1.00) |
1 (1.00) |
1 (1.00) |
0.399 (1.00) |
1 (1.00) |
| OPLAH | 4 (3%) | 126 |
0.789 (1.00) |
0.808 (1.00) |
0.0475 (1.00) |
0.706 (1.00) |
0.133 (1.00) |
1 (1.00) |
1 (1.00) |
|
| GAS2L2 | 3 (2%) | 127 |
0.789 (1.00) |
0.963 (1.00) |
0.403 (1.00) |
0.621 (1.00) |
1 (1.00) |
1 (1.00) |
1 (1.00) |
|
| CDC27 | 6 (5%) | 124 |
0.719 (1.00) |
0.773 (1.00) |
0.37 (1.00) |
1 (1.00) |
1 (1.00) |
1 (1.00) |
0.4 (1.00) |
1 (1.00) |
| MUC2 | 14 (11%) | 116 |
0.533 (1.00) |
0.701 (1.00) |
0.191 (1.00) |
0.366 (1.00) |
1 (1.00) |
1 (1.00) |
0.681 (1.00) |
1 (1.00) |
| TPTE2 | 4 (3%) | 126 |
0.795 (1.00) |
0.618 (1.00) |
0.42 (1.00) |
1 (1.00) |
1 (1.00) |
1 (1.00) |
1 (1.00) |
|
| NAT10 | 4 (3%) | 126 |
0.777 (1.00) |
0.277 (1.00) |
0.886 (1.00) |
0.709 (1.00) |
1 (1.00) |
1 (1.00) |
0.323 (1.00) |
|
| INTS4 | 3 (2%) | 127 |
0.789 (1.00) |
0.134 (1.00) |
0.641 (1.00) |
0.624 (1.00) |
1 (1.00) |
0.252 (1.00) |
||
| TTC38 | 4 (3%) | 126 |
0.719 (1.00) |
0.544 (1.00) |
0.141 (1.00) |
0.195 (1.00) |
0.515 (1.00) |
0.133 (1.00) |
1 (1.00) |
1 (1.00) |
| RBM3 | 3 (2%) | 127 |
0.789 (1.00) |
0.298 (1.00) |
0.0671 (1.00) |
0.624 (1.00) |
1 (1.00) |
1 (1.00) |
1 (1.00) |
|
| TCHH | 5 (4%) | 125 |
0.686 (1.00) |
0.861 (1.00) |
0.0221 (1.00) |
0.724 (1.00) |
0.109 (1.00) |
1 (1.00) |
0.0507 (1.00) |
1 (1.00) |
| ZC3H11A | 3 (2%) | 127 |
0.757 (1.00) |
0.721 (1.00) |
0.0213 (1.00) |
1 (1.00) |
1 (1.00) |
0.223 (1.00) |
1 (1.00) |
|
| RAC1 | 4 (3%) | 126 |
0.777 (1.00) |
0.28 (1.00) |
0.727 (1.00) |
0.0418 (1.00) |
1 (1.00) |
1 (1.00) |
1 (1.00) |
1 (1.00) |
| MTIF3 | 3 (2%) | 127 |
0.773 (1.00) |
0.515 (1.00) |
1 (1.00) |
0.366 (1.00) |
1 (1.00) |
0.252 (1.00) |
||
| MFF | 3 (2%) | 127 |
0.757 (1.00) |
0.63 (1.00) |
0.37 (1.00) |
1 (1.00) |
1 (1.00) |
1 (1.00) |
||
| PABPC3 | 3 (2%) | 127 |
0.843 (1.00) |
0.238 (1.00) |
0.752 (1.00) |
1 (1.00) |
1 (1.00) |
1 (1.00) |
1 (1.00) |
1 (1.00) |
| CUX1 | 5 (4%) | 125 |
0.711 (1.00) |
0.153 (1.00) |
0.751 (1.00) |
0.138 (1.00) |
0.569 (1.00) |
1 (1.00) |
0.169 (1.00) |
1 (1.00) |
| PCMTD1 | 5 (4%) | 125 |
0.711 (1.00) |
0.475 (1.00) |
0.245 (1.00) |
0.722 (1.00) |
1 (1.00) |
1 (1.00) |
0.343 (1.00) |
1 (1.00) |
| EZH2 | 4 (3%) | 126 |
0.808 (1.00) |
0.362 (1.00) |
0.303 (1.00) |
0.128 (1.00) |
1 (1.00) |
1 (1.00) |
1 (1.00) |
|
| HTT | 3 (2%) | 127 |
0.827 (1.00) |
0.244 (1.00) |
0.676 (1.00) |
0.191 (1.00) |
1 (1.00) |
1 (1.00) |
0.252 (1.00) |
|
| AHDC1 | 3 (2%) | 127 |
0.757 (1.00) |
0.0937 (1.00) |
0.464 (1.00) |
1 (1.00) |
1 (1.00) |
1 (1.00) |
1 (1.00) |
|
| RFC3 | 3 (2%) | 127 |
0.789 (1.00) |
0.203 (1.00) |
0.469 (1.00) |
1 (1.00) |
1 (1.00) |
1 (1.00) |
0.252 (1.00) |
|
| RUNX2 | 4 (3%) | 126 |
0.777 (1.00) |
0.352 (1.00) |
0.652 (1.00) |
0.708 (1.00) |
1 (1.00) |
0.288 (1.00) |
1 (1.00) |
|
| SP4 | 3 (2%) | 127 |
0.789 (1.00) |
0.438 (1.00) |
0.12 (1.00) |
1 (1.00) |
1 (1.00) |
1 (1.00) |
1 (1.00) |
|
| DIAPH1 | 3 (2%) | 127 |
0.827 (1.00) |
0.0968 (1.00) |
0.0724 (1.00) |
1 (1.00) |
1 (1.00) |
1 (1.00) |
||
| PLEC | 6 (5%) | 124 |
0.752 (1.00) |
0.125 (1.00) |
0.0522 (1.00) |
0.526 (1.00) |
1 (1.00) |
1 (1.00) |
1 (1.00) |
|
| NHS | 3 (2%) | 127 |
0.757 (1.00) |
0.571 (1.00) |
0.329 (1.00) |
1 (1.00) |
0.515 (1.00) |
1 (1.00) |
1 (1.00) |
1 (1.00) |
| EPAS1 | 4 (3%) | 126 |
0.773 (1.00) |
0.122 (1.00) |
0.137 (1.00) |
0.368 (1.00) |
1 (1.00) |
1 (1.00) |
1 (1.00) |
|
| DLC1 | 3 (2%) | 127 |
0.843 (1.00) |
0.71 (1.00) |
0.362 (1.00) |
0.367 (1.00) |
1 (1.00) |
0.22 (1.00) |
1 (1.00) |
P value = 9.29e-07 (logrank test), Q value = 0.00044
Table S1. Gene #51: 'CHD4 MUTATION STATUS' versus Clinical Feature #1: 'Time to Death'
| nPatients | nDeath | Duration Range (Median), Month | |
|---|---|---|---|
| ALL | 130 | 4 | 0.1 - 229.2 (38.0) |
| CHD4 MUTATED | 3 | 1 | 0.4 - 41.7 (0.6) |
| CHD4 WILD-TYPE | 127 | 3 | 0.1 - 229.2 (38.3) |
Figure S1. Get High-res Image Gene #51: 'CHD4 MUTATION STATUS' versus Clinical Feature #1: 'Time to Death'

P value = 0.00031 (Fisher's exact test), Q value = 0.058
Table S2. Gene #51: 'CHD4 MUTATION STATUS' versus Clinical Feature #7: 'RACE'
| nPatients | ASIAN | BLACK OR AFRICAN AMERICAN | WHITE |
|---|---|---|---|
| ALL | 4 | 6 | 115 |
| CHD4 MUTATED | 1 | 2 | 0 |
| CHD4 WILD-TYPE | 3 | 4 | 115 |
Figure S2. Get High-res Image Gene #51: 'CHD4 MUTATION STATUS' versus Clinical Feature #7: 'RACE'
P value = 0.000367 (logrank test), Q value = 0.058
Table S3. Gene #57: 'PIK3CD MUTATION STATUS' versus Clinical Feature #1: 'Time to Death'
| nPatients | nDeath | Duration Range (Median), Month | |
|---|---|---|---|
| ALL | 130 | 4 | 0.1 - 229.2 (38.0) |
| PIK3CD MUTATED | 3 | 1 | 5.1 - 37.7 (20.3) |
| PIK3CD WILD-TYPE | 127 | 3 | 0.1 - 229.2 (39.4) |
Figure S3. Get High-res Image Gene #57: 'PIK3CD MUTATION STATUS' versus Clinical Feature #1: 'Time to Death'
-
Mutation data file = sample_sig_gene_table.txt from Mutsig_2CV pipeline
-
Processed Mutation data file = /xchip/cga/gdac-prod/tcga-gdac/jobResults/GDAC_Correlate_Genomic_Events_Preprocess/TGCT-TP/15890413/transformed.cor.cli.txt
-
Clinical data file = /xchip/cga/gdac-prod/tcga-gdac/jobResults/Append_Data/TGCT-TP/15092576/TGCT-TP.merged_data.txt
-
Number of patients = 130
-
Number of significantly mutated genes = 59
-
Number of selected clinical features = 8
-
Exclude genes that fewer than K tumors have mutations, K = 3
For survival clinical features, the Kaplan-Meier survival curves of tumors with and without gene mutations were plotted and the statistical significance P values were estimated by logrank test (Bland and Altman 2004) using the 'survdiff' function in R
For binary or multi-class clinical features (nominal or ordinal), two-tailed Fisher's exact tests (Fisher 1922) were used to estimate the P values using the 'fisher.test' function in R
For multiple hypothesis correction, Q value is the False Discovery Rate (FDR) analogue of the P value (Benjamini and Hochberg 1995), defined as the minimum FDR at which the test may be called significant. We used the 'Benjamini and Hochberg' method of 'p.adjust' function in R to convert P values into Q values.
In addition to the links below, the full results of the analysis summarized in this report can also be downloaded programmatically using firehose_get, or interactively from either the Broad GDAC website or TCGA Data Coordination Center Portal.