This pipeline computes the correlation between significant arm-level copy number variations (cnvs) and selected clinical features.
Testing the association between copy number variation 52 arm-level events and 5 clinical features across 121 patients, 26 significant findings detected with Q value < 0.25.
-
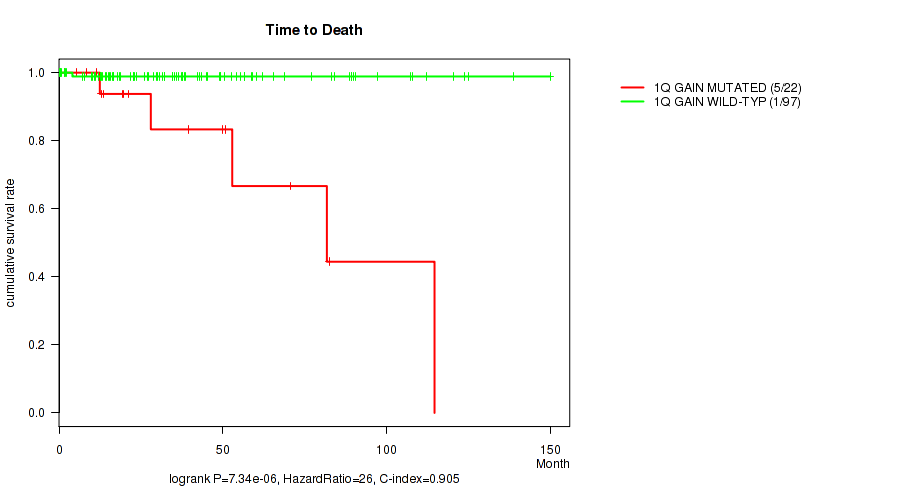
1q gain cnv correlated to 'Time to Death'.
-
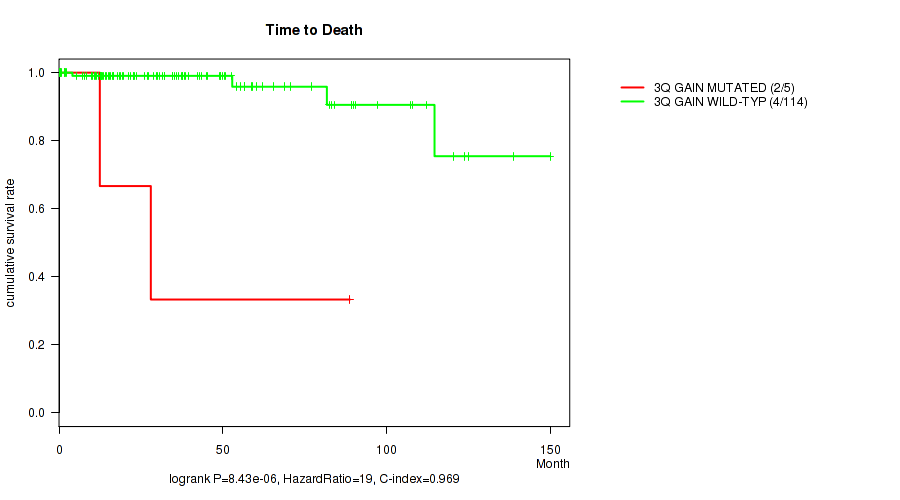
3q gain cnv correlated to 'Time to Death'.
-
7p gain cnv correlated to 'Time to Death'.
-
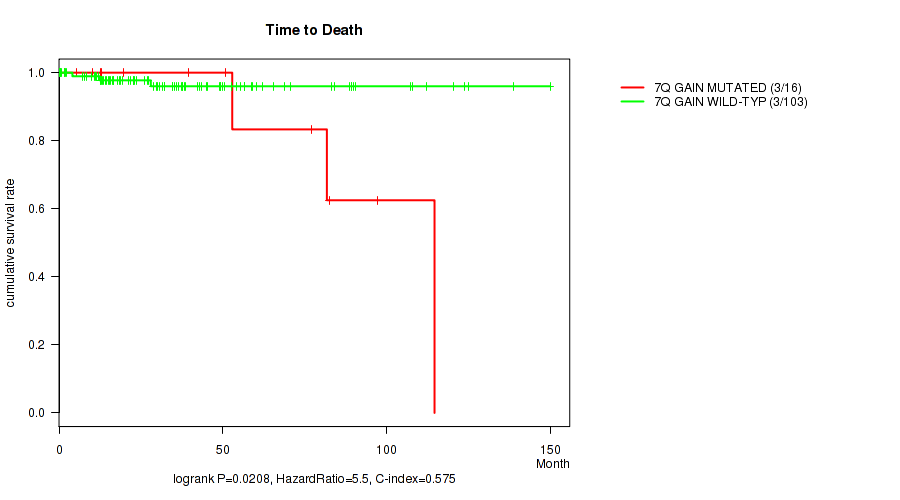
7q gain cnv correlated to 'Time to Death'.
-
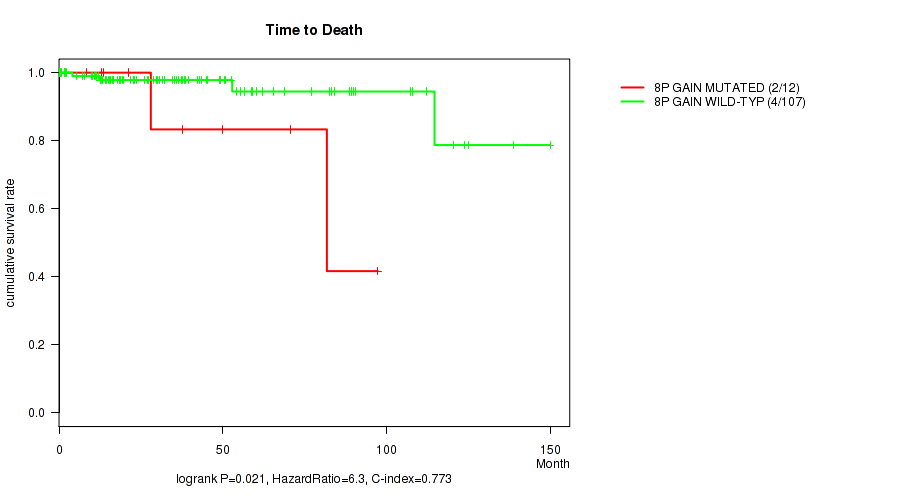
8p gain cnv correlated to 'Time to Death'.
-
8q gain cnv correlated to 'Time to Death'.
-
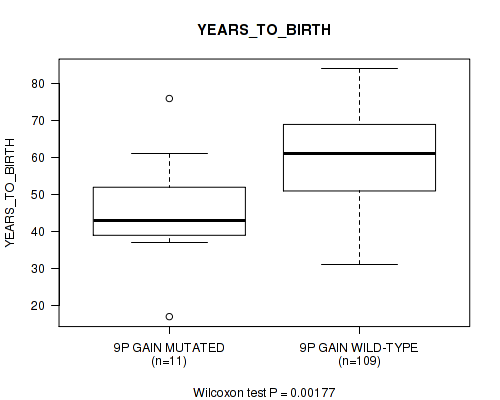
9p gain cnv correlated to 'YEARS_TO_BIRTH'.
-
9q gain cnv correlated to 'YEARS_TO_BIRTH'.
-
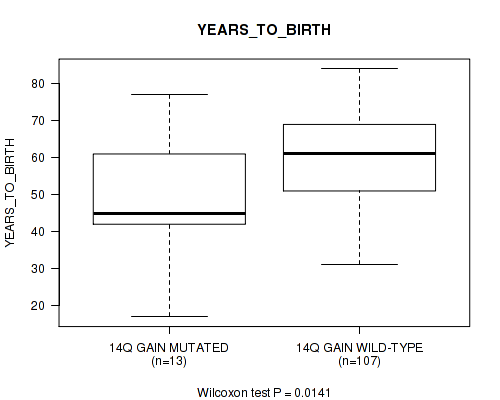
14q gain cnv correlated to 'YEARS_TO_BIRTH'.
-
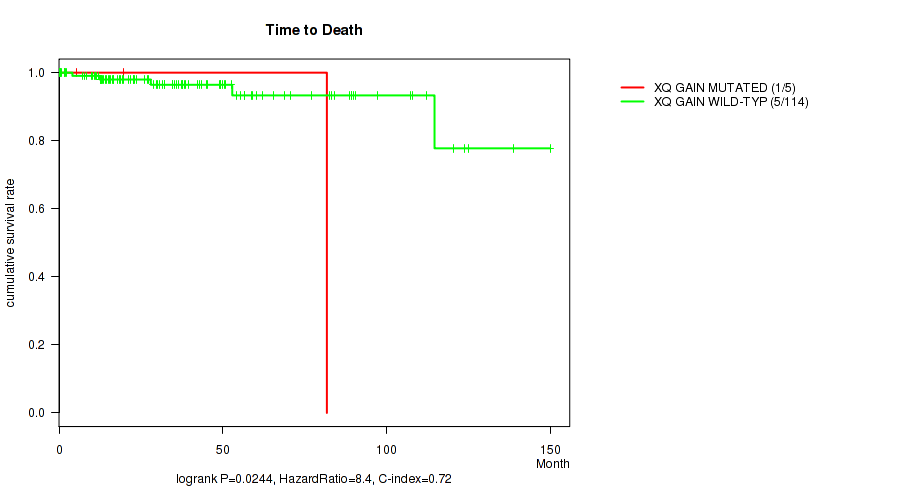
xq gain cnv correlated to 'Time to Death'.
-
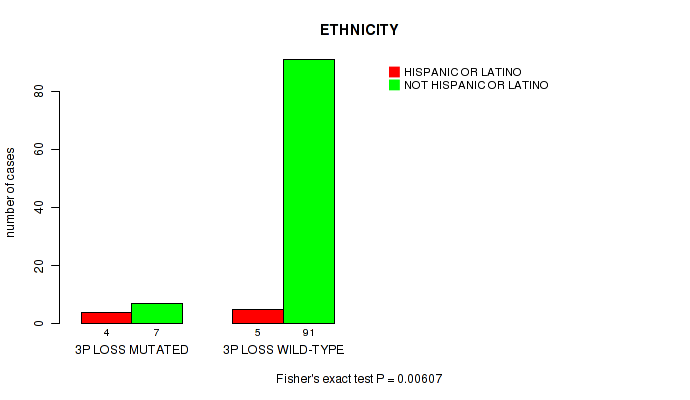
3p loss cnv correlated to 'ETHNICITY'.
-
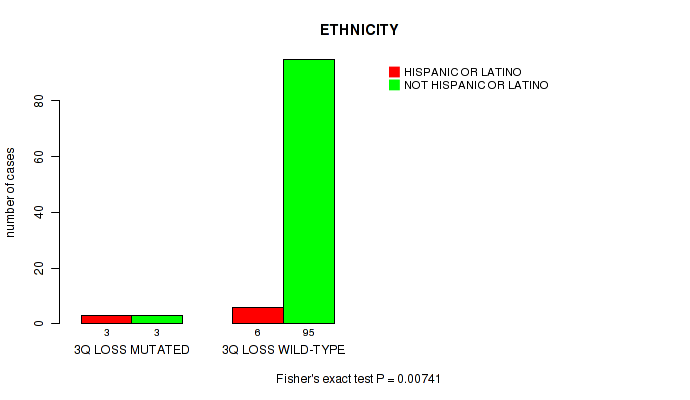
3q loss cnv correlated to 'ETHNICITY'.
-
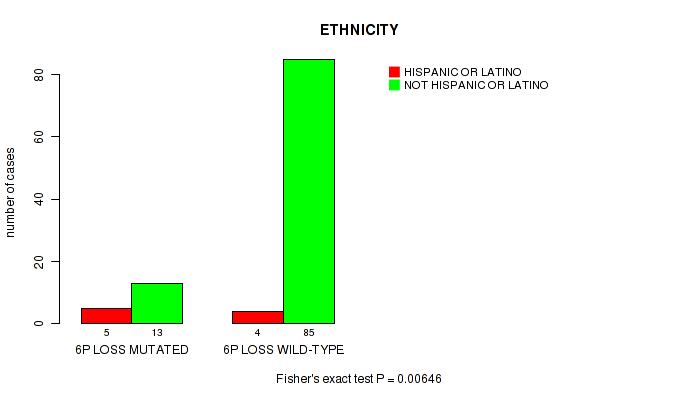
6p loss cnv correlated to 'ETHNICITY'.
-
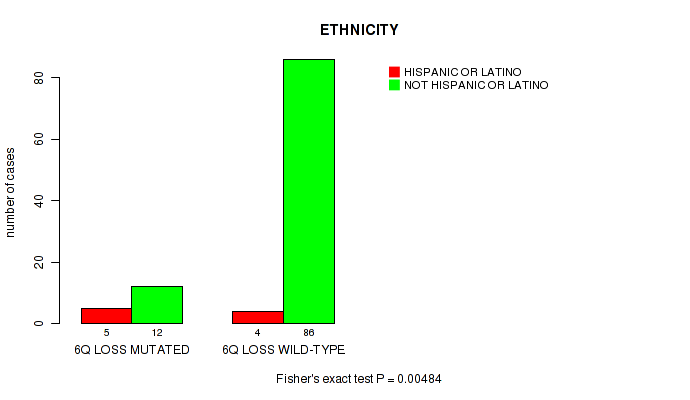
6q loss cnv correlated to 'ETHNICITY'.
-
11p loss cnv correlated to 'ETHNICITY'.
-
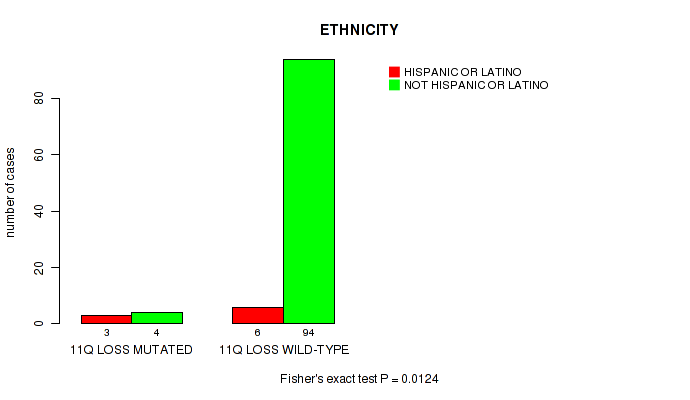
11q loss cnv correlated to 'YEARS_TO_BIRTH' and 'ETHNICITY'.
-
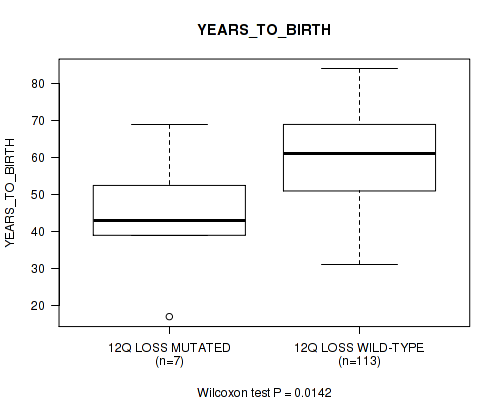
12q loss cnv correlated to 'YEARS_TO_BIRTH'.
-
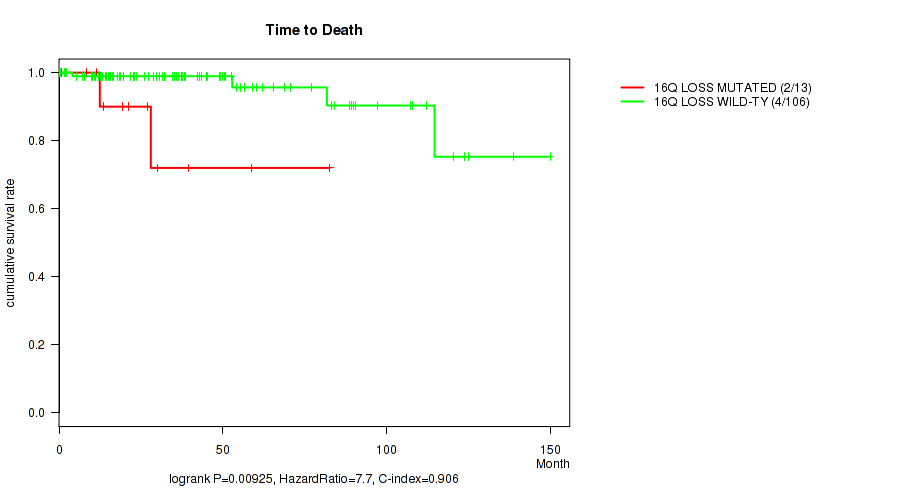
16q loss cnv correlated to 'Time to Death'.
-
17p loss cnv correlated to 'ETHNICITY'.
-
17q loss cnv correlated to 'ETHNICITY'.
-
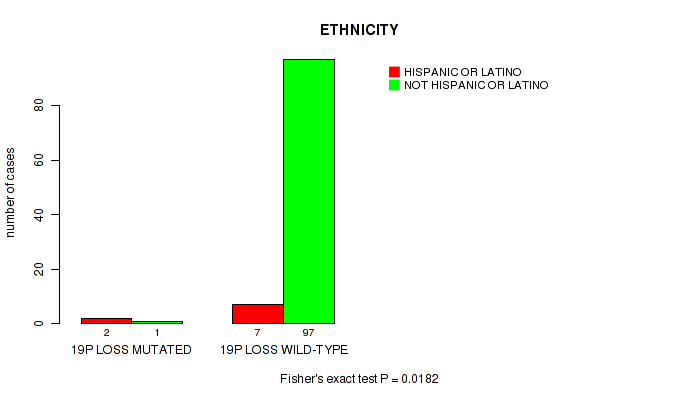
19p loss cnv correlated to 'ETHNICITY'.
-
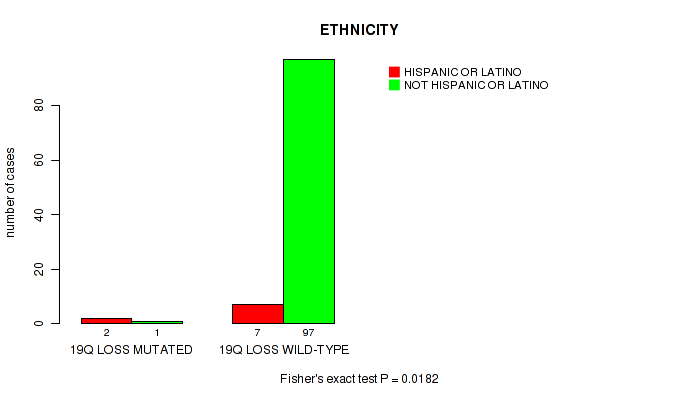
19q loss cnv correlated to 'ETHNICITY'.
-
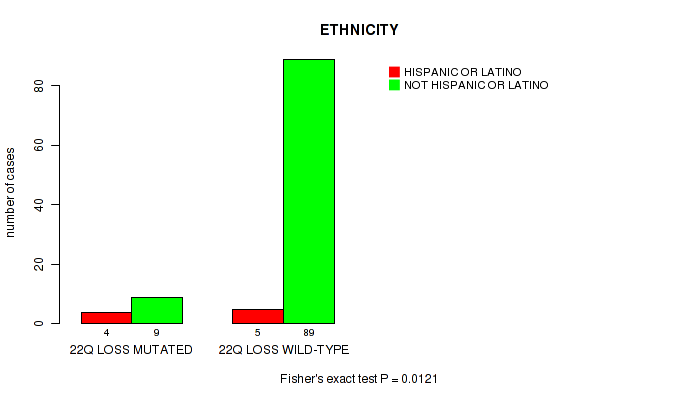
22q loss cnv correlated to 'ETHNICITY'.
-
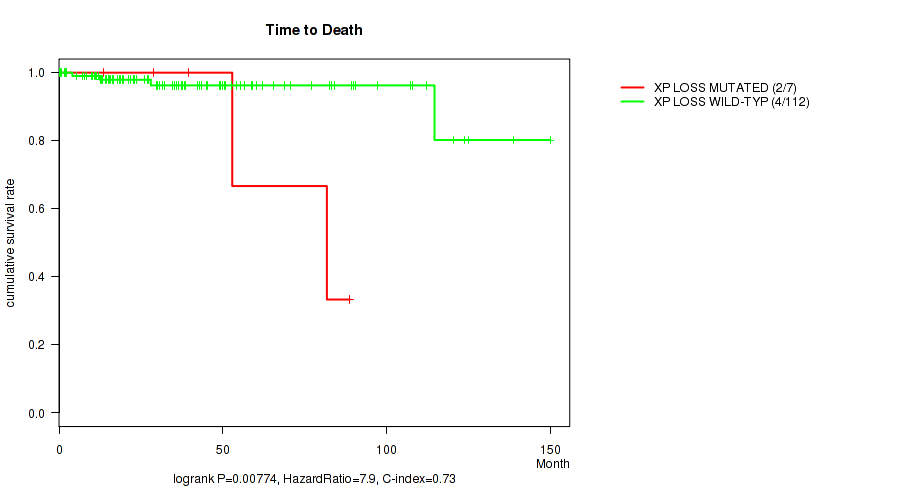
xp loss cnv correlated to 'Time to Death'.
-
xq loss cnv correlated to 'ETHNICITY'.
Table 1. Get Full Table Overview of the association between significant copy number variation of 52 arm-level events and 5 clinical features. Shown in the table are P values (Q values). Thresholded by Q value < 0.25, 26 significant findings detected.
|
Clinical Features |
Time to Death |
YEARS TO BIRTH |
GENDER | RACE | ETHNICITY | ||
| nCNV (%) | nWild-Type | logrank test | Wilcoxon-test | Fisher's exact test | Fisher's exact test | Fisher's exact test | |
| 11q loss | 7 (6%) | 114 |
0.506 (1.00) |
0.0117 (0.215) |
0.44 (1.00) |
0.712 (1.00) |
0.0124 (0.215) |
| 1q gain | 22 (18%) | 99 |
7.34e-06 (0.0011) |
0.462 (1.00) |
0.348 (0.896) |
0.361 (0.896) |
0.674 (1.00) |
| 3q gain | 5 (4%) | 116 |
8.43e-06 (0.0011) |
0.101 (0.523) |
0.674 (1.00) |
1 (1.00) |
1 (1.00) |
| 7p gain | 16 (13%) | 105 |
0.0208 (0.219) |
0.323 (0.872) |
1 (1.00) |
1 (1.00) |
1 (1.00) |
| 7q gain | 16 (13%) | 105 |
0.0208 (0.219) |
0.323 (0.872) |
1 (1.00) |
1 (1.00) |
1 (1.00) |
| 8p gain | 12 (10%) | 109 |
0.021 (0.219) |
0.224 (0.732) |
0.364 (0.896) |
0.808 (1.00) |
1 (1.00) |
| 8q gain | 12 (10%) | 109 |
0.021 (0.219) |
0.224 (0.732) |
0.364 (0.896) |
0.806 (1.00) |
1 (1.00) |
| 9p gain | 11 (9%) | 110 |
0.206 (0.713) |
0.00177 (0.115) |
1 (1.00) |
0.0343 (0.288) |
0.597 (1.00) |
| 9q gain | 11 (9%) | 110 |
0.206 (0.713) |
0.00177 (0.115) |
1 (1.00) |
0.034 (0.288) |
0.597 (1.00) |
| 14q gain | 13 (11%) | 108 |
0.2 (0.713) |
0.0141 (0.216) |
0.774 (1.00) |
0.807 (1.00) |
0.597 (1.00) |
| xq gain | 5 (4%) | 116 |
0.0244 (0.244) |
0.379 (0.92) |
0.674 (1.00) |
1 (1.00) |
1 (1.00) |
| 3p loss | 12 (10%) | 109 |
0.468 (1.00) |
0.201 (0.713) |
0.763 (1.00) |
1 (1.00) |
0.00607 (0.183) |
| 3q loss | 7 (6%) | 114 |
0.515 (1.00) |
0.184 (0.713) |
0.115 (0.524) |
0.713 (1.00) |
0.00741 (0.183) |
| 6p loss | 20 (17%) | 101 |
0.118 (0.527) |
0.0571 (0.403) |
0.809 (1.00) |
0.871 (1.00) |
0.00646 (0.183) |
| 6q loss | 19 (16%) | 102 |
0.0957 (0.508) |
0.0811 (0.449) |
0.805 (1.00) |
0.572 (1.00) |
0.00484 (0.183) |
| 11p loss | 9 (7%) | 112 |
0.496 (1.00) |
0.137 (0.576) |
1 (1.00) |
1 (1.00) |
0.00252 (0.131) |
| 12q loss | 7 (6%) | 114 |
0.607 (1.00) |
0.0142 (0.216) |
0.115 (0.524) |
0.711 (1.00) |
0.106 (0.523) |
| 16q loss | 13 (11%) | 108 |
0.00925 (0.2) |
0.771 (1.00) |
0.774 (1.00) |
0.827 (1.00) |
0.0771 (0.449) |
| 17p loss | 14 (12%) | 107 |
0.517 (1.00) |
0.479 (1.00) |
0.397 (0.947) |
0.844 (1.00) |
0.0163 (0.219) |
| 17q loss | 6 (5%) | 115 |
0.692 (1.00) |
0.191 (0.713) |
0.68 (1.00) |
0.654 (1.00) |
0.00741 (0.183) |
| 19p loss | 3 (2%) | 118 |
0.823 (1.00) |
0.289 (0.86) |
0.613 (1.00) |
1 (1.00) |
0.0182 (0.219) |
| 19q loss | 3 (2%) | 118 |
0.823 (1.00) |
0.289 (0.86) |
0.613 (1.00) |
1 (1.00) |
0.0182 (0.219) |
| 22q loss | 13 (11%) | 108 |
0.332 (0.882) |
0.107 (0.523) |
0.774 (1.00) |
1 (1.00) |
0.0121 (0.215) |
| xp loss | 7 (6%) | 114 |
0.00774 (0.183) |
0.0678 (0.43) |
1 (1.00) |
1 (1.00) |
0.0794 (0.449) |
| xq loss | 4 (3%) | 117 |
0.0301 (0.279) |
0.219 (0.732) |
0.356 (0.896) |
1 (1.00) |
0.0182 (0.219) |
| 1p gain | 8 (7%) | 113 |
0.0434 (0.353) |
0.933 (1.00) |
0.484 (1.00) |
1 (1.00) |
0.106 (0.523) |
| 5p gain | 11 (9%) | 110 |
0.0611 (0.403) |
0.696 (1.00) |
0.12 (0.527) |
0.766 (1.00) |
0.166 (0.654) |
| 5q gain | 9 (7%) | 112 |
0.0505 (0.386) |
0.601 (1.00) |
0.0898 (0.487) |
0.734 (1.00) |
0.469 (1.00) |
| 12p gain | 4 (3%) | 117 |
0.062 (0.403) |
0.413 (0.95) |
0.619 (1.00) |
1 (1.00) |
0.3 (0.86) |
| 12q gain | 4 (3%) | 117 |
0.062 (0.403) |
0.413 (0.95) |
0.619 (1.00) |
1 (1.00) |
0.3 (0.86) |
| 15q gain | 12 (10%) | 109 |
0.122 (0.527) |
0.817 (1.00) |
1 (1.00) |
1 (1.00) |
1 (1.00) |
| 17q gain | 7 (6%) | 114 |
0.529 (1.00) |
0.622 (1.00) |
1 (1.00) |
0.714 (1.00) |
1 (1.00) |
| 18p gain | 3 (2%) | 118 |
0.841 (1.00) |
0.65 (1.00) |
1 (1.00) |
1 (1.00) |
0.234 (0.732) |
| 18q gain | 3 (2%) | 118 |
0.841 (1.00) |
0.65 (1.00) |
1 (1.00) |
1 (1.00) |
0.234 (0.732) |
| 19p gain | 3 (2%) | 118 |
0.704 (1.00) |
0.325 (0.872) |
0.613 (1.00) |
1 (1.00) |
1 (1.00) |
| 19q gain | 3 (2%) | 118 |
0.704 (1.00) |
0.325 (0.872) |
0.613 (1.00) |
1 (1.00) |
1 (1.00) |
| 20p gain | 10 (8%) | 111 |
0.41 (0.95) |
0.924 (1.00) |
1 (1.00) |
0.602 (1.00) |
0.198 (0.713) |
| 20q gain | 10 (8%) | 111 |
0.41 (0.95) |
0.924 (1.00) |
1 (1.00) |
0.608 (1.00) |
0.198 (0.713) |
| 21q gain | 3 (2%) | 118 |
0.888 (1.00) |
0.232 (0.732) |
0.113 (0.524) |
1 (1.00) |
1 (1.00) |
| 22q gain | 5 (4%) | 116 |
0.723 (1.00) |
0.318 (0.872) |
0.2 (0.713) |
0.587 (1.00) |
1 (1.00) |
| xp gain | 3 (2%) | 118 |
0.864 (1.00) |
0.686 (1.00) |
0.113 (0.524) |
1 (1.00) |
1 (1.00) |
| 1p loss | 4 (3%) | 117 |
0.639 (1.00) |
0.0697 (0.432) |
0.356 (0.896) |
1 (1.00) |
0.3 (0.86) |
| 4p loss | 5 (4%) | 116 |
0.489 (1.00) |
0.482 (1.00) |
1 (1.00) |
1 (1.00) |
1 (1.00) |
| 4q loss | 4 (3%) | 117 |
0.508 (1.00) |
0.907 (1.00) |
0.619 (1.00) |
1 (1.00) |
1 (1.00) |
| 9p loss | 4 (3%) | 117 |
0.841 (1.00) |
0.14 (0.576) |
0.356 (0.896) |
1 (1.00) |
0.3 (0.86) |
| 10p loss | 3 (2%) | 118 |
0.823 (1.00) |
0.301 (0.86) |
0.613 (1.00) |
1 (1.00) |
0.234 (0.732) |
| 12p loss | 8 (7%) | 113 |
0.582 (1.00) |
0.033 (0.288) |
0.274 (0.847) |
1 (1.00) |
0.135 (0.576) |
| 13q loss | 14 (12%) | 107 |
0.387 (0.931) |
0.219 (0.732) |
0.778 (1.00) |
0.844 (1.00) |
0.0621 (0.403) |
| 16p loss | 5 (4%) | 116 |
0.636 (1.00) |
0.507 (1.00) |
0.365 (0.896) |
0.308 (0.87) |
0.0554 (0.403) |
| 18p loss | 7 (6%) | 114 |
0.155 (0.62) |
0.853 (1.00) |
0.713 (1.00) |
1 (1.00) |
0.0794 (0.449) |
| 18q loss | 7 (6%) | 114 |
0.155 (0.62) |
0.853 (1.00) |
0.713 (1.00) |
1 (1.00) |
0.0794 (0.449) |
| 21q loss | 9 (7%) | 112 |
0.58 (1.00) |
0.0456 (0.36) |
1 (1.00) |
1 (1.00) |
0.0272 (0.262) |
P value = 7.34e-06 (logrank test), Q value = 0.0011
Table S1. Gene #2: '1q gain' versus Clinical Feature #1: 'Time to Death'
| nPatients | nDeath | Duration Range (Median), Month | |
|---|---|---|---|
| ALL | 119 | 6 | 0.1 - 150.0 (30.7) |
| 1Q GAIN MUTATED | 22 | 5 | 0.1 - 114.7 (19.8) |
| 1Q GAIN WILD-TYPE | 97 | 1 | 0.2 - 150.0 (32.2) |
Figure S1. Get High-res Image Gene #2: '1q gain' versus Clinical Feature #1: 'Time to Death'
P value = 8.43e-06 (logrank test), Q value = 0.0011
Table S2. Gene #3: '3q gain' versus Clinical Feature #1: 'Time to Death'
| nPatients | nDeath | Duration Range (Median), Month | |
|---|---|---|---|
| ALL | 119 | 6 | 0.1 - 150.0 (30.7) |
| 3Q GAIN MUTATED | 5 | 2 | 0.3 - 88.8 (12.5) |
| 3Q GAIN WILD-TYPE | 114 | 4 | 0.1 - 150.0 (31.9) |
Figure S2. Get High-res Image Gene #3: '3q gain' versus Clinical Feature #1: 'Time to Death'
P value = 0.0208 (logrank test), Q value = 0.22
Table S3. Gene #6: '7p gain' versus Clinical Feature #1: 'Time to Death'
| nPatients | nDeath | Duration Range (Median), Month | |
|---|---|---|---|
| ALL | 119 | 6 | 0.1 - 150.0 (30.7) |
| 7P GAIN MUTATED | 16 | 3 | 0.2 - 114.7 (29.6) |
| 7P GAIN WILD-TYPE | 103 | 3 | 0.1 - 150.0 (30.7) |
Figure S3. Get High-res Image Gene #6: '7p gain' versus Clinical Feature #1: 'Time to Death'

P value = 0.0208 (logrank test), Q value = 0.22
Table S4. Gene #7: '7q gain' versus Clinical Feature #1: 'Time to Death'
| nPatients | nDeath | Duration Range (Median), Month | |
|---|---|---|---|
| ALL | 119 | 6 | 0.1 - 150.0 (30.7) |
| 7Q GAIN MUTATED | 16 | 3 | 0.2 - 114.7 (29.6) |
| 7Q GAIN WILD-TYPE | 103 | 3 | 0.1 - 150.0 (30.7) |
Figure S4. Get High-res Image Gene #7: '7q gain' versus Clinical Feature #1: 'Time to Death'
P value = 0.021 (logrank test), Q value = 0.22
Table S5. Gene #8: '8p gain' versus Clinical Feature #1: 'Time to Death'
| nPatients | nDeath | Duration Range (Median), Month | |
|---|---|---|---|
| ALL | 119 | 6 | 0.1 - 150.0 (30.7) |
| 8P GAIN MUTATED | 12 | 2 | 0.2 - 97.4 (24.6) |
| 8P GAIN WILD-TYPE | 107 | 4 | 0.1 - 150.0 (31.5) |
Figure S5. Get High-res Image Gene #8: '8p gain' versus Clinical Feature #1: 'Time to Death'
P value = 0.021 (logrank test), Q value = 0.22
Table S6. Gene #9: '8q gain' versus Clinical Feature #1: 'Time to Death'
| nPatients | nDeath | Duration Range (Median), Month | |
|---|---|---|---|
| ALL | 119 | 6 | 0.1 - 150.0 (30.7) |
| 8Q GAIN MUTATED | 12 | 2 | 0.2 - 97.4 (24.6) |
| 8Q GAIN WILD-TYPE | 107 | 4 | 0.1 - 150.0 (31.5) |
Figure S6. Get High-res Image Gene #9: '8q gain' versus Clinical Feature #1: 'Time to Death'

P value = 0.00177 (Wilcoxon-test), Q value = 0.12
Table S7. Gene #10: '9p gain' versus Clinical Feature #2: 'YEARS_TO_BIRTH'
| nPatients | Mean (Std.Dev) | |
|---|---|---|
| ALL | 120 | 58.7 (12.7) |
| 9P GAIN MUTATED | 11 | 45.7 (15.0) |
| 9P GAIN WILD-TYPE | 109 | 60.0 (11.7) |
Figure S7. Get High-res Image Gene #10: '9p gain' versus Clinical Feature #2: 'YEARS_TO_BIRTH'
P value = 0.00177 (Wilcoxon-test), Q value = 0.12
Table S8. Gene #11: '9q gain' versus Clinical Feature #2: 'YEARS_TO_BIRTH'
| nPatients | Mean (Std.Dev) | |
|---|---|---|
| ALL | 120 | 58.7 (12.7) |
| 9Q GAIN MUTATED | 11 | 45.7 (15.0) |
| 9Q GAIN WILD-TYPE | 109 | 60.0 (11.7) |
Figure S8. Get High-res Image Gene #11: '9q gain' versus Clinical Feature #2: 'YEARS_TO_BIRTH'

P value = 0.0141 (Wilcoxon-test), Q value = 0.22
Table S9. Gene #14: '14q gain' versus Clinical Feature #2: 'YEARS_TO_BIRTH'
| nPatients | Mean (Std.Dev) | |
|---|---|---|
| ALL | 120 | 58.7 (12.7) |
| 14Q GAIN MUTATED | 13 | 49.4 (15.4) |
| 14Q GAIN WILD-TYPE | 107 | 59.8 (11.9) |
Figure S9. Get High-res Image Gene #14: '14q gain' versus Clinical Feature #2: 'YEARS_TO_BIRTH'
P value = 0.0244 (logrank test), Q value = 0.24
Table S10. Gene #26: 'xq gain' versus Clinical Feature #1: 'Time to Death'
| nPatients | nDeath | Duration Range (Median), Month | |
|---|---|---|---|
| ALL | 119 | 6 | 0.1 - 150.0 (30.7) |
| XQ GAIN MUTATED | 5 | 1 | 0.2 - 81.8 (5.2) |
| XQ GAIN WILD-TYPE | 114 | 5 | 0.1 - 150.0 (31.9) |
Figure S10. Get High-res Image Gene #26: 'xq gain' versus Clinical Feature #1: 'Time to Death'
P value = 0.00607 (Fisher's exact test), Q value = 0.18
Table S11. Gene #28: '3p loss' versus Clinical Feature #5: 'ETHNICITY'
| nPatients | HISPANIC OR LATINO | NOT HISPANIC OR LATINO |
|---|---|---|
| ALL | 9 | 98 |
| 3P LOSS MUTATED | 4 | 7 |
| 3P LOSS WILD-TYPE | 5 | 91 |
Figure S11. Get High-res Image Gene #28: '3p loss' versus Clinical Feature #5: 'ETHNICITY'
P value = 0.00741 (Fisher's exact test), Q value = 0.18
Table S12. Gene #29: '3q loss' versus Clinical Feature #5: 'ETHNICITY'
| nPatients | HISPANIC OR LATINO | NOT HISPANIC OR LATINO |
|---|---|---|
| ALL | 9 | 98 |
| 3Q LOSS MUTATED | 3 | 3 |
| 3Q LOSS WILD-TYPE | 6 | 95 |
Figure S12. Get High-res Image Gene #29: '3q loss' versus Clinical Feature #5: 'ETHNICITY'
P value = 0.00646 (Fisher's exact test), Q value = 0.18
Table S13. Gene #32: '6p loss' versus Clinical Feature #5: 'ETHNICITY'
| nPatients | HISPANIC OR LATINO | NOT HISPANIC OR LATINO |
|---|---|---|
| ALL | 9 | 98 |
| 6P LOSS MUTATED | 5 | 13 |
| 6P LOSS WILD-TYPE | 4 | 85 |
Figure S13. Get High-res Image Gene #32: '6p loss' versus Clinical Feature #5: 'ETHNICITY'
P value = 0.00484 (Fisher's exact test), Q value = 0.18
Table S14. Gene #33: '6q loss' versus Clinical Feature #5: 'ETHNICITY'
| nPatients | HISPANIC OR LATINO | NOT HISPANIC OR LATINO |
|---|---|---|
| ALL | 9 | 98 |
| 6Q LOSS MUTATED | 5 | 12 |
| 6Q LOSS WILD-TYPE | 4 | 86 |
Figure S14. Get High-res Image Gene #33: '6q loss' versus Clinical Feature #5: 'ETHNICITY'
P value = 0.00252 (Fisher's exact test), Q value = 0.13
Table S15. Gene #36: '11p loss' versus Clinical Feature #5: 'ETHNICITY'
| nPatients | HISPANIC OR LATINO | NOT HISPANIC OR LATINO |
|---|---|---|
| ALL | 9 | 98 |
| 11P LOSS MUTATED | 4 | 5 |
| 11P LOSS WILD-TYPE | 5 | 93 |
Figure S15. Get High-res Image Gene #36: '11p loss' versus Clinical Feature #5: 'ETHNICITY'

P value = 0.0117 (Wilcoxon-test), Q value = 0.21
Table S16. Gene #37: '11q loss' versus Clinical Feature #2: 'YEARS_TO_BIRTH'
| nPatients | Mean (Std.Dev) | |
|---|---|---|
| ALL | 120 | 58.7 (12.7) |
| 11Q LOSS MUTATED | 7 | 44.4 (16.5) |
| 11Q LOSS WILD-TYPE | 113 | 59.5 (12.0) |
Figure S16. Get High-res Image Gene #37: '11q loss' versus Clinical Feature #2: 'YEARS_TO_BIRTH'

P value = 0.0124 (Fisher's exact test), Q value = 0.21
Table S17. Gene #37: '11q loss' versus Clinical Feature #5: 'ETHNICITY'
| nPatients | HISPANIC OR LATINO | NOT HISPANIC OR LATINO |
|---|---|---|
| ALL | 9 | 98 |
| 11Q LOSS MUTATED | 3 | 4 |
| 11Q LOSS WILD-TYPE | 6 | 94 |
Figure S17. Get High-res Image Gene #37: '11q loss' versus Clinical Feature #5: 'ETHNICITY'
P value = 0.0142 (Wilcoxon-test), Q value = 0.22
Table S18. Gene #39: '12q loss' versus Clinical Feature #2: 'YEARS_TO_BIRTH'
| nPatients | Mean (Std.Dev) | |
|---|---|---|
| ALL | 120 | 58.7 (12.7) |
| 12Q LOSS MUTATED | 7 | 44.6 (17.0) |
| 12Q LOSS WILD-TYPE | 113 | 59.5 (11.9) |
Figure S18. Get High-res Image Gene #39: '12q loss' versus Clinical Feature #2: 'YEARS_TO_BIRTH'
P value = 0.00925 (logrank test), Q value = 0.2
Table S19. Gene #42: '16q loss' versus Clinical Feature #1: 'Time to Death'
| nPatients | nDeath | Duration Range (Median), Month | |
|---|---|---|---|
| ALL | 119 | 6 | 0.1 - 150.0 (30.7) |
| 16Q LOSS MUTATED | 13 | 2 | 0.7 - 82.7 (21.1) |
| 16Q LOSS WILD-TYPE | 106 | 4 | 0.1 - 150.0 (32.3) |
Figure S19. Get High-res Image Gene #42: '16q loss' versus Clinical Feature #1: 'Time to Death'
P value = 0.0163 (Fisher's exact test), Q value = 0.22
Table S20. Gene #43: '17p loss' versus Clinical Feature #5: 'ETHNICITY'
| nPatients | HISPANIC OR LATINO | NOT HISPANIC OR LATINO |
|---|---|---|
| ALL | 9 | 98 |
| 17P LOSS MUTATED | 4 | 10 |
| 17P LOSS WILD-TYPE | 5 | 88 |
Figure S20. Get High-res Image Gene #43: '17p loss' versus Clinical Feature #5: 'ETHNICITY'

P value = 0.00741 (Fisher's exact test), Q value = 0.18
Table S21. Gene #44: '17q loss' versus Clinical Feature #5: 'ETHNICITY'
| nPatients | HISPANIC OR LATINO | NOT HISPANIC OR LATINO |
|---|---|---|
| ALL | 9 | 98 |
| 17Q LOSS MUTATED | 3 | 3 |
| 17Q LOSS WILD-TYPE | 6 | 95 |
Figure S21. Get High-res Image Gene #44: '17q loss' versus Clinical Feature #5: 'ETHNICITY'

P value = 0.0182 (Fisher's exact test), Q value = 0.22
Table S22. Gene #47: '19p loss' versus Clinical Feature #5: 'ETHNICITY'
| nPatients | HISPANIC OR LATINO | NOT HISPANIC OR LATINO |
|---|---|---|
| ALL | 9 | 98 |
| 19P LOSS MUTATED | 2 | 1 |
| 19P LOSS WILD-TYPE | 7 | 97 |
Figure S22. Get High-res Image Gene #47: '19p loss' versus Clinical Feature #5: 'ETHNICITY'
P value = 0.0182 (Fisher's exact test), Q value = 0.22
Table S23. Gene #48: '19q loss' versus Clinical Feature #5: 'ETHNICITY'
| nPatients | HISPANIC OR LATINO | NOT HISPANIC OR LATINO |
|---|---|---|
| ALL | 9 | 98 |
| 19Q LOSS MUTATED | 2 | 1 |
| 19Q LOSS WILD-TYPE | 7 | 97 |
Figure S23. Get High-res Image Gene #48: '19q loss' versus Clinical Feature #5: 'ETHNICITY'
P value = 0.0121 (Fisher's exact test), Q value = 0.21
Table S24. Gene #50: '22q loss' versus Clinical Feature #5: 'ETHNICITY'
| nPatients | HISPANIC OR LATINO | NOT HISPANIC OR LATINO |
|---|---|---|
| ALL | 9 | 98 |
| 22Q LOSS MUTATED | 4 | 9 |
| 22Q LOSS WILD-TYPE | 5 | 89 |
Figure S24. Get High-res Image Gene #50: '22q loss' versus Clinical Feature #5: 'ETHNICITY'
P value = 0.00774 (logrank test), Q value = 0.18
Table S25. Gene #51: 'xp loss' versus Clinical Feature #1: 'Time to Death'
| nPatients | nDeath | Duration Range (Median), Month | |
|---|---|---|---|
| ALL | 119 | 6 | 0.1 - 150.0 (30.7) |
| XP LOSS MUTATED | 7 | 2 | 0.2 - 88.8 (39.5) |
| XP LOSS WILD-TYPE | 112 | 4 | 0.1 - 150.0 (30.4) |
Figure S25. Get High-res Image Gene #51: 'xp loss' versus Clinical Feature #1: 'Time to Death'
P value = 0.0182 (Fisher's exact test), Q value = 0.22
Table S26. Gene #52: 'xq loss' versus Clinical Feature #5: 'ETHNICITY'
| nPatients | HISPANIC OR LATINO | NOT HISPANIC OR LATINO |
|---|---|---|
| ALL | 9 | 98 |
| XQ LOSS MUTATED | 2 | 1 |
| XQ LOSS WILD-TYPE | 7 | 97 |
Figure S26. Get High-res Image Gene #52: 'xq loss' versus Clinical Feature #5: 'ETHNICITY'

-
Copy number data file = broad_values_by_arm.txt from GISTIC pipeline
-
Processed Copy number data file = /xchip/cga/gdac-prod/tcga-gdac/jobResults/GDAC_Correlate_Genomic_Events_Preprocess/THYM-TP/15104466/transformed.cor.cli.txt
-
Clinical data file = /xchip/cga/gdac-prod/tcga-gdac/jobResults/Append_Data/THYM-TP/15092844/THYM-TP.merged_data.txt
-
Number of patients = 121
-
Number of significantly arm-level cnvs = 52
-
Number of selected clinical features = 5
-
Exclude regions that fewer than K tumors have mutations, K = 3
For survival clinical features, the Kaplan-Meier survival curves of tumors with and without gene mutations were plotted and the statistical significance P values were estimated by logrank test (Bland and Altman 2004) using the 'survdiff' function in R
For binary or multi-class clinical features (nominal or ordinal), two-tailed Fisher's exact tests (Fisher 1922) were used to estimate the P values using the 'fisher.test' function in R
For multiple hypothesis correction, Q value is the False Discovery Rate (FDR) analogue of the P value (Benjamini and Hochberg 1995), defined as the minimum FDR at which the test may be called significant. We used the 'Benjamini and Hochberg' method of 'p.adjust' function in R to convert P values into Q values.
In addition to the links below, the full results of the analysis summarized in this report can also be downloaded programmatically using firehose_get, or interactively from either the Broad GDAC website or TCGA Data Coordination Center Portal.