This pipeline computes the correlation between significant copy number variation (cnv focal) genes and selected clinical features.
Testing the association between copy number variation 12 focal events and 5 clinical features across 121 patients, 10 significant findings detected with Q value < 0.25.
-
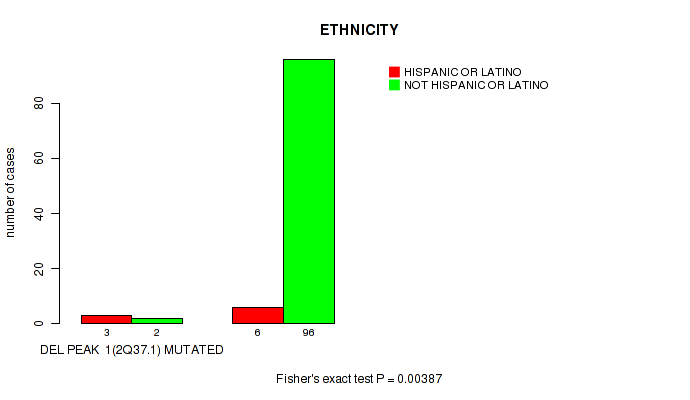
del_2q37.1 cnv correlated to 'ETHNICITY'.
-
del_3p22.2 cnv correlated to 'ETHNICITY'.
-
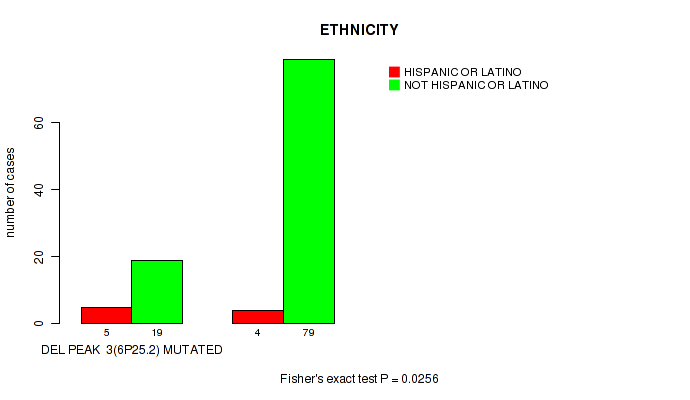
del_6p25.2 cnv correlated to 'ETHNICITY'.
-
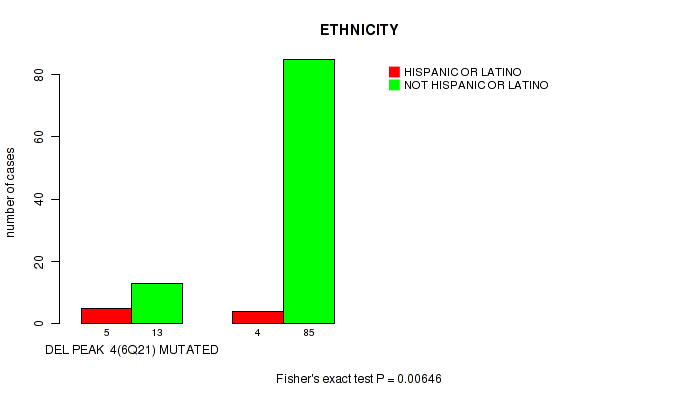
del_6q21 cnv correlated to 'ETHNICITY'.
-
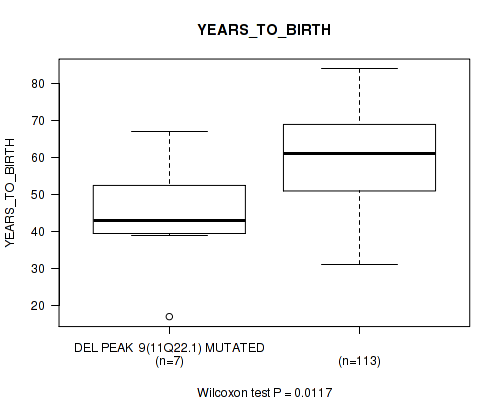
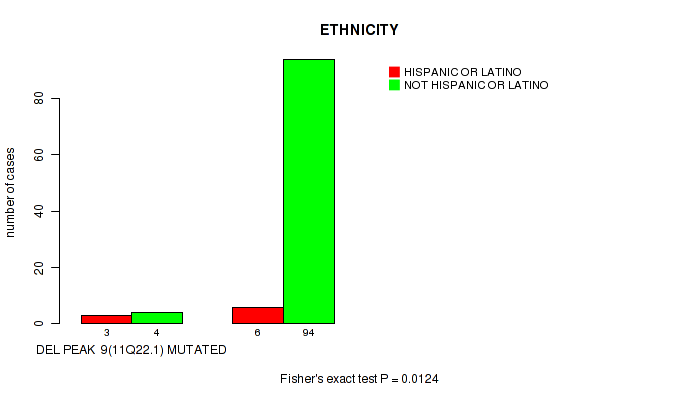
del_11q22.1 cnv correlated to 'YEARS_TO_BIRTH' and 'ETHNICITY'.
-
del_22q12.1 cnv correlated to 'YEARS_TO_BIRTH' and 'ETHNICITY'.
-
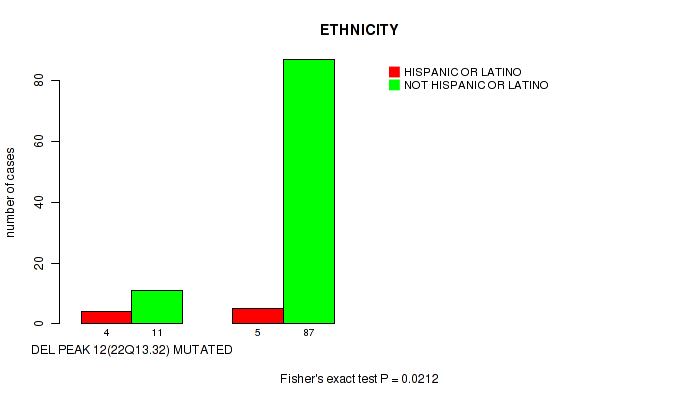
del_22q13.32 cnv correlated to 'YEARS_TO_BIRTH' and 'ETHNICITY'.
Table 1. Get Full Table Overview of the association between significant copy number variation of 12 focal events and 5 clinical features. Shown in the table are P values (Q values). Thresholded by Q value < 0.25, 10 significant findings detected.
|
Clinical Features |
Time to Death |
YEARS TO BIRTH |
GENDER | RACE | ETHNICITY | ||
| nCNV (%) | nWild-Type | logrank test | Wilcoxon-test | Fisher's exact test | Fisher's exact test | Fisher's exact test | |
| del 11q22 1 | 7 (6%) | 114 |
0.506 (0.855) |
0.0117 (0.11) |
0.44 (0.825) |
0.711 (0.948) |
0.0124 (0.11) |
| del 22q12 1 | 19 (16%) | 102 |
0.642 (0.914) |
0.0128 (0.11) |
0.458 (0.832) |
0.872 (1.00) |
0.00845 (0.11) |
| del 22q13 32 | 15 (12%) | 106 |
0.332 (0.761) |
0.034 (0.204) |
0.415 (0.825) |
1 (1.00) |
0.0212 (0.159) |
| del 2q37 1 | 5 (4%) | 116 |
0.707 (0.948) |
0.351 (0.761) |
1 (1.00) |
0.31 (0.761) |
0.00387 (0.11) |
| del 3p22 2 | 14 (12%) | 107 |
0.513 (0.855) |
0.598 (0.914) |
1 (1.00) |
1 (1.00) |
0.0121 (0.11) |
| del 6p25 2 | 26 (21%) | 95 |
0.0714 (0.306) |
0.628 (0.914) |
0.827 (1.00) |
0.286 (0.746) |
0.0256 (0.171) |
| del 6q21 | 20 (17%) | 101 |
0.0998 (0.384) |
0.15 (0.499) |
0.628 (0.914) |
0.507 (0.855) |
0.00646 (0.11) |
| del 7q36 3 | 3 (2%) | 118 |
0.805 (1.00) |
0.65 (0.914) |
0.613 (0.914) |
1 (1.00) |
0.234 (0.637) |
| del 9p21 3 | 11 (9%) | 110 |
0.102 (0.384) |
0.14 (0.496) |
0.355 (0.761) |
1 (1.00) |
0.232 (0.637) |
| del 9q22 33 | 3 (2%) | 118 |
0.841 (1.00) |
0.346 (0.761) |
1 (1.00) |
1 (1.00) |
0.234 (0.637) |
| del 10q26 3 | 6 (5%) | 115 |
0.0712 (0.306) |
0.885 (1.00) |
0.432 (0.825) |
0.655 (0.914) |
0.418 (0.825) |
| del 19p13 11 | 5 (4%) | 116 |
0.823 (1.00) |
0.0678 (0.306) |
0.2 (0.631) |
1 (1.00) |
0.0554 (0.302) |
P value = 0.00387 (Fisher's exact test), Q value = 0.11
Table S1. Gene #1: 'del_2q37.1' versus Clinical Feature #5: 'ETHNICITY'
| nPatients | HISPANIC OR LATINO | NOT HISPANIC OR LATINO |
|---|---|---|
| ALL | 9 | 98 |
| DEL PEAK 1(2Q37.1) MUTATED | 3 | 2 |
| DEL PEAK 1(2Q37.1) WILD-TYPE | 6 | 96 |
Figure S1. Get High-res Image Gene #1: 'del_2q37.1' versus Clinical Feature #5: 'ETHNICITY'
P value = 0.0121 (Fisher's exact test), Q value = 0.11
Table S2. Gene #2: 'del_3p22.2' versus Clinical Feature #5: 'ETHNICITY'
| nPatients | HISPANIC OR LATINO | NOT HISPANIC OR LATINO |
|---|---|---|
| ALL | 9 | 98 |
| DEL PEAK 2(3P22.2) MUTATED | 4 | 9 |
| DEL PEAK 2(3P22.2) WILD-TYPE | 5 | 89 |
Figure S2. Get High-res Image Gene #2: 'del_3p22.2' versus Clinical Feature #5: 'ETHNICITY'

P value = 0.0256 (Fisher's exact test), Q value = 0.17
Table S3. Gene #3: 'del_6p25.2' versus Clinical Feature #5: 'ETHNICITY'
| nPatients | HISPANIC OR LATINO | NOT HISPANIC OR LATINO |
|---|---|---|
| ALL | 9 | 98 |
| DEL PEAK 3(6P25.2) MUTATED | 5 | 19 |
| DEL PEAK 3(6P25.2) WILD-TYPE | 4 | 79 |
Figure S3. Get High-res Image Gene #3: 'del_6p25.2' versus Clinical Feature #5: 'ETHNICITY'
P value = 0.00646 (Fisher's exact test), Q value = 0.11
Table S4. Gene #4: 'del_6q21' versus Clinical Feature #5: 'ETHNICITY'
| nPatients | HISPANIC OR LATINO | NOT HISPANIC OR LATINO |
|---|---|---|
| ALL | 9 | 98 |
| DEL PEAK 4(6Q21) MUTATED | 5 | 13 |
| DEL PEAK 4(6Q21) WILD-TYPE | 4 | 85 |
Figure S4. Get High-res Image Gene #4: 'del_6q21' versus Clinical Feature #5: 'ETHNICITY'
P value = 0.0117 (Wilcoxon-test), Q value = 0.11
Table S5. Gene #9: 'del_11q22.1' versus Clinical Feature #2: 'YEARS_TO_BIRTH'
| nPatients | Mean (Std.Dev) | |
|---|---|---|
| ALL | 120 | 58.7 (12.7) |
| DEL PEAK 9(11Q22.1) MUTATED | 7 | 44.4 (16.5) |
| DEL PEAK 9(11Q22.1) WILD-TYPE | 113 | 59.5 (12.0) |
Figure S5. Get High-res Image Gene #9: 'del_11q22.1' versus Clinical Feature #2: 'YEARS_TO_BIRTH'
P value = 0.0124 (Fisher's exact test), Q value = 0.11
Table S6. Gene #9: 'del_11q22.1' versus Clinical Feature #5: 'ETHNICITY'
| nPatients | HISPANIC OR LATINO | NOT HISPANIC OR LATINO |
|---|---|---|
| ALL | 9 | 98 |
| DEL PEAK 9(11Q22.1) MUTATED | 3 | 4 |
| DEL PEAK 9(11Q22.1) WILD-TYPE | 6 | 94 |
Figure S6. Get High-res Image Gene #9: 'del_11q22.1' versus Clinical Feature #5: 'ETHNICITY'
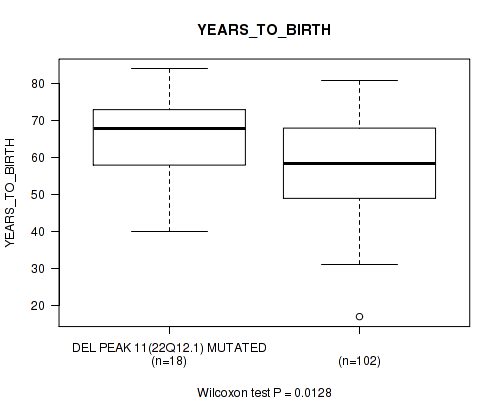
P value = 0.0128 (Wilcoxon-test), Q value = 0.11
Table S7. Gene #11: 'del_22q12.1' versus Clinical Feature #2: 'YEARS_TO_BIRTH'
| nPatients | Mean (Std.Dev) | |
|---|---|---|
| ALL | 120 | 58.7 (12.7) |
| DEL PEAK 11(22Q12.1) MUTATED | 18 | 65.3 (11.3) |
| DEL PEAK 11(22Q12.1) WILD-TYPE | 102 | 57.5 (12.6) |
Figure S7. Get High-res Image Gene #11: 'del_22q12.1' versus Clinical Feature #2: 'YEARS_TO_BIRTH'
P value = 0.00845 (Fisher's exact test), Q value = 0.11
Table S8. Gene #11: 'del_22q12.1' versus Clinical Feature #5: 'ETHNICITY'
| nPatients | HISPANIC OR LATINO | NOT HISPANIC OR LATINO |
|---|---|---|
| ALL | 9 | 98 |
| DEL PEAK 11(22Q12.1) MUTATED | 5 | 14 |
| DEL PEAK 11(22Q12.1) WILD-TYPE | 4 | 84 |
Figure S8. Get High-res Image Gene #11: 'del_22q12.1' versus Clinical Feature #5: 'ETHNICITY'

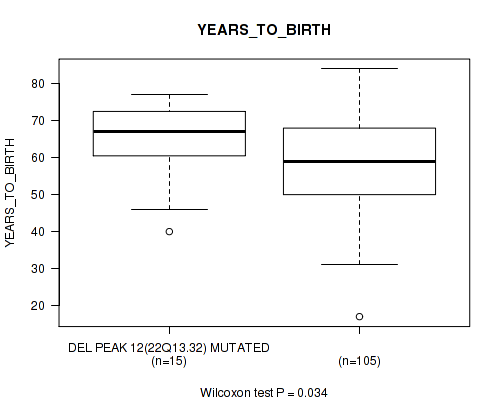
P value = 0.034 (Wilcoxon-test), Q value = 0.2
Table S9. Gene #12: 'del_22q13.32' versus Clinical Feature #2: 'YEARS_TO_BIRTH'
| nPatients | Mean (Std.Dev) | |
|---|---|---|
| ALL | 120 | 58.7 (12.7) |
| DEL PEAK 12(22Q13.32) MUTATED | 15 | 64.7 (11.2) |
| DEL PEAK 12(22Q13.32) WILD-TYPE | 105 | 57.8 (12.7) |
Figure S9. Get High-res Image Gene #12: 'del_22q13.32' versus Clinical Feature #2: 'YEARS_TO_BIRTH'
P value = 0.0212 (Fisher's exact test), Q value = 0.16
Table S10. Gene #12: 'del_22q13.32' versus Clinical Feature #5: 'ETHNICITY'
| nPatients | HISPANIC OR LATINO | NOT HISPANIC OR LATINO |
|---|---|---|
| ALL | 9 | 98 |
| DEL PEAK 12(22Q13.32) MUTATED | 4 | 11 |
| DEL PEAK 12(22Q13.32) WILD-TYPE | 5 | 87 |
Figure S10. Get High-res Image Gene #12: 'del_22q13.32' versus Clinical Feature #5: 'ETHNICITY'
-
Copy number data file = all_lesions.txt from GISTIC pipeline
-
Processed Copy number data file = /xchip/cga/gdac-prod/tcga-gdac/jobResults/GDAC_Correlate_Genomic_Events_Preprocess/THYM-TP/15104465/transformed.cor.cli.txt
-
Clinical data file = /xchip/cga/gdac-prod/tcga-gdac/jobResults/Append_Data/THYM-TP/15092844/THYM-TP.merged_data.txt
-
Number of patients = 121
-
Number of significantly focal cnvs = 12
-
Number of selected clinical features = 5
-
Exclude genes that fewer than K tumors have mutations, K = 3
For survival clinical features, the Kaplan-Meier survival curves of tumors with and without gene mutations were plotted and the statistical significance P values were estimated by logrank test (Bland and Altman 2004) using the 'survdiff' function in R
For binary or multi-class clinical features (nominal or ordinal), two-tailed Fisher's exact tests (Fisher 1922) were used to estimate the P values using the 'fisher.test' function in R
For multiple hypothesis correction, Q value is the False Discovery Rate (FDR) analogue of the P value (Benjamini and Hochberg 1995), defined as the minimum FDR at which the test may be called significant. We used the 'Benjamini and Hochberg' method of 'p.adjust' function in R to convert P values into Q values.
In addition to the links below, the full results of the analysis summarized in this report can also be downloaded programmatically using firehose_get, or interactively from either the Broad GDAC website or TCGA Data Coordination Center Portal.